University of New Orleans University of New Orleans
ScholarWorks@UNO
ScholarWorks@UNO
University of New Orleans Theses and
Dissertations Dissertations and Theses
Summer 8-2-2012
RNA CoMPASS: RNA Comprehensive Multi-Processor Analysis
RNA CoMPASS: RNA Comprehensive Multi-Processor Analysis
System for Sequencing
System for Sequencing
Guorong Xu
Follow this and additional works at: https://scholarworks.uno.edu/td
Recommended Citation Recommended Citation
Xu, Guorong, "RNA CoMPASS: RNA Comprehensive Multi-Processor Analysis System for Sequencing" (2012). University of New Orleans Theses and Dissertations. 1531.
https://scholarworks.uno.edu/td/1531
This Dissertation is protected by copyright and/or related rights. It has been brought to you by ScholarWorks@UNO with permission from the rights-holder(s). You are free to use this Dissertation in any way that is permitted by the copyright and related rights legislation that applies to your use. For other uses you need to obtain permission from the rights-holder(s) directly, unless additional rights are indicated by a Creative Commons license in the record and/ or on the work itself.
RNA CoMPASS: RNA Comprehensive Multi-Processor Analysis System for Sequencing
A Dissertation
Submitted to the Graduate Faculty of the University of New Orleans in partial fulfillment of the requirements for the degree of
Doctor of Philosophy in
Engineering and Applied Sciences
by
Guorong Xu
ii
iii
Acknowledgments
First and foremost, I want to thank my advisor Dr. Christopher Taylor. His
endless support and wisdom helped me finish this dissertation. His enthusiasm for
Bioinformatics was contagious—and I definitely caught it. His depth of knowledge and
very precise academic guidance brought me to develop a web-based GUI distributed
computational pipeline, which provides all-in-one functionality including human
transcriptome quantification, other typical endogenous RNA-Sequencing analysis and
additionally the investigation of exogenous sequences.
I would like to thank Dr. Erik Flemington. The major experiment data and
biology knowledge were provided by his lab. I really appreciate his consistent support.
I express my deep gratitude to all the professors in my dissertation committee for
their precious suggestions about my Ph.D. research and valuable comments on my
dissertation.
I wish to thank our bioinformatics group members: Mohamad Qayoom and
Joseph Coco and Carl Baribault and Dr. Zhu Dongxiao’s lab. Each individual provided
insights that guided and challenged my thinking, substantially improved the dissertation.
I am grateful to Dr. Mahdi Abdelguerfi who cared much about my research and
my family during the period of my Ph.D. study.
Lastly, I would like to thank my family members, especially my wife Yan Gao,
for supporting and encouraging me to pursue this degree. Without my wife’s
iv
Table of Contents
List of Figures ... vii
List of Tables ... x
Abstract ... xi
Chapter 1 Background and Introduction ... 1
1.1 Microarray technology ... 1
1.2 Next-generation sequencing technology ... 2
1.3 RNA-seq technology ... 3
1.4 Sequence alignment... 4
1.5 Junction mapping ... 5
1.6 Sequence searching ... 6
1.7 Taxonomical analysis ... 7
1.8 De novo assembly... 7
1.9 Introduction to transcriptome ... 8
1.10 Analysis of exogenous sequence ... 9
1.11 Analysis of endogenous sequence ... 10
1.12 Motivation ... 12
1.13 Overview ... 12
Chapter 2 Architecture of RNA CoMPASS ... 15
2.1 Introduction ... 15
2.2 Java Parallel Processing Framework (JPPF) ... 16
2.3 Grid system managed by Portable Batch System (PBS) submission ... 16
2.4 Layer structure of RNA CoMPASS ... 17
Chapter 3 Methods and Tools ... 20
3.1 Introduction ... 20
3.2 Data flow through RNA CoMPASS ... 20
3.3 Initial Serial Pipeline ... 22
3.4 Methods ... 23
3.4.1 Exons reads alignment using Novoalign... 23
3.4.2 Junctions reads alignment using TopHat ... 24
3.4.3 Sequence searching using BLAST... 25
3.4.4 Taxonomical analysis using MEGAN ... 26
v
3.4.6 Gene expression calculation ... 27
3.4.7 Transcript expression calculation ... 28
3.4.8 Detection of differentially expressed genes and isoforms ... 32
3.4.9 Generation of reads coverage file for visualization ... 33
3.5 Existing bioinformatics tools used in RNA CoMPASS ... 33
3.5.1 Novoalign ... 34
3.5.2 Bowtie ... 35
3.5.3 TopHat ... 35
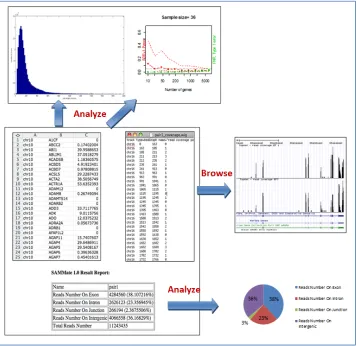
3.5.4 SAMMate ... 36
3.5.5 SAMtools ... 36
3.5.6 BLAST ... 36
3.5.7 MEGAN ... 37
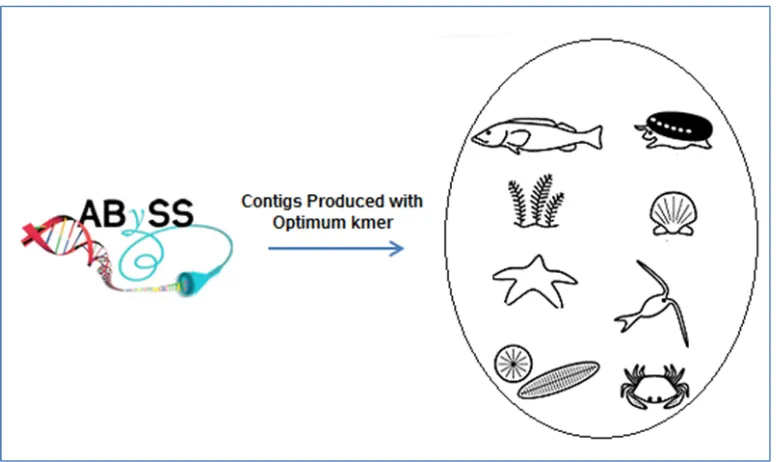
3.5.8 ABySS... 37
Chapter 4 Key Features... 39
4.1 Introduction ... 39
4.2 Investigation of exogenous sequences of non-host origin ... 40
4.2.1 Feature: Alignment of short RNA sequences against human, virus and bacterial genomes... 40
4.2.2 Feature: Searching unmapped sequences against human RNA and NT databases ... 42
4.2.3 Feature: Visualization of taxonomic distribution of reads using MEGAN 43 4.2.4 Feature: Assembling pools of exogenous reads into longer transcripts with ABySS 45 4.3 Performs extensive endogenous analysis for the host organism ... 46
4.3.1 Feature: calculation of genomic feature abundance scores at gene level ... 46
4.3.2 Feature: calculation of genomic feature abundance scores at isoform level 49 4.3.3 Feature: generation of signal map for peak detection ... 50
4.3.4 Feature: generation of wiggle files for visualization ... 50
4.3.5 Feature: generation of alignment report ... 52
Chapter 5 Performance Results ... 53
5.1 The performance comparison in analyzing human organism dataset ... 53
5.2 The performance comparison in analyzing non-human organism dataset ... 58
5.3 The performance comparison between time cost and speedup on local cluster. 61 5.4 The performance comparison between time cost and speedup on grid system . 63 5.5 Microarray platform versus next generation sequence platform ... 64
5.6 Expression analysis ... 67
5.7 3’ UTR reporter analysis ... 68
5.8 Splicing evidence in Mutu I and Akata ... 69
vi
5.10 Genome-wide change-point analysis to identify potential miRNA targets... 74
5.11 iQuant algorithm to quantify transcriptomes at isoform-level ... 76
Chapter 6 Conclusion ... 78
6.1 Conclusion ... 78
Appendix A ... 81
Tables ... 81
Glossary ... 84
Appendix B ... 97
Important codes ... 97
References ... 103
vii
List of Figures
Figure 1.1 Combination of exon reads with junction reads to accurately calculate gene expression RPKM scores (a) A unique challenge for researchers working with RNA-seq data. The junction reads (red) fail to map back to the reference genome because exons are separated by introns. (b) A demonstration of the ideas of combing exon reads (black) and junction reads (red) to calculate gene expression RPKM scores [Xu et al., 2011]. ... 5 Figure 1.2 Endogenous sequence analyses. ... 11 Figure 2.1 Overview of RNA CoMPASS structure. ... 15 Figure 2.2 Overview of RNA CoMPASS deployed on a local cluster with JPPF structure.
... 16 Figure 2.3 Overview of RNA CoMPASS deployed on a grid system managed by PBS submission... 17 Figure 2.4 The layer structure of RNA CoMPASS: the Presentation Layer consists of
viii
Figure 4.5 The pie chart is another representation of the MEGAN output. The pie chart represents the portion of reads that was assigned to each category. ... 45 Figure 4.6 RNA CoMPASS uses ABySS to assemble reads that was assigned to each category into longer transcripts. ... 46 Figure 4.7 A unique challenge for researchers working with RNA-seq data. The junction reads (red) fail to map back to the reference genome because exons are separated by introns. ... 48 Figure 4.8 Combination of exon reads with junction reads to accurately calculate gene expression RPKM scores. A demonstration of the ideas of combing exon reads (black) and junction reads (red) to calculate gene expression RPKM scores. ... 48 Figure 4.9 Visualization of gene structure variation. Gene CXorf39 was called by the Change Point Analysis as a potential miRNA-155 target due to it's abrupt read dropout on the 3'-UTR end. ... 51 Figure 4.10 Visualization of gene structure variation. Gene LBA1 was called by the
Differential Expression Analysis as a potential miRNA-155 target due to the overall read coverage decrease in codon region. ... 52 Figure 4.11 The overview of alignment report. ... 52 Figure 5.1 The box plot of quality scores across all bases for the sample file SRR032238. The horizontal axis corresponds to the base position of sequence. The vertical axis corresponds to the quality score. ... 54 Figure 5.2 The overview of GC distribution over all sequences for the sample file SRR032238. The curve marked by red color is GC count per read and the curve marked by blue color is the theoretical distribution. The horizontal axis corresponds to mean GC content (%). The vertical axis corresponds to the number of GC count. ... 55 Figure 5.3 The box plot of quality scores across all bases for the sample file SRR032246. The horizontal axis corresponds to the base position of sequence. The vertical axis corresponds to the quality score. ... 56 Figure 5.4 The overview of GC distribution over all sequences for the sample file SRR032246. The curve marked by red color is GC count per read and the curve marked by blue color is the theoretical distribution. The horizontal axis corresponds to mean GC content (%). The vertical axis corresponds to the number of GC count. ... 57 Figure 5.5 Performance and speed up for sample SRR032238 running on a local cluster
ix
Figure 5.8 Performance and speed up for sample SRR006514 running on a grid system with 24 cores. The horizontal axis corresponds to the modules used in RNA CoMPASS. The left vertical axis shows the run time of each module and total time spent processing the sample. The right vertical axis shows the corresponding speedup of the parallelized version for each module. ... 61 Figure 5.9 Performance of a single machine versus a local cluster with three machines for sample SRR032238. The horizontal axis shows the modules used in RNA CoMPASS. The vertical axis shows the speedup of each module for this sample. .. 62 Figure 5.10 Performance of a single machine versus a local cluster with three machines for sample SRR032246. The horizontal axis shows the modules used in RNA CoMPASS. The vertical axis shows the speedup of each module for this sample. .. 63 Figure 5.11 Performance of a single machine versus a grid system with 6 and 24 cores allocated for sample SRR006514. The horizontal axis shows the modules used in RNA CoMPASS. The vertical shows the speedup of each module for this sample. 64 Figure 5.12 Cross-platform comparison of targetome prediction using bitmap. Downregulated genes were identified at a false discovery rate (FDR) = 0 for NGS and each microarray platform. Each gene was determined to be significantly down-regulated (at FDR =0) or not in each of the four platforms; down-down-regulated genes were assigned to one of the 24 = 16 possible clusters, represented by color/white patterns and corresponding to 16 rows in the bitmap. Numbers at the top refer to the total number of down-regulated genes for the indicated platform (summation of the number of genes represented by all colored patterns in column). Numbers to the right refer to the number of genes common to platforms with colored patterns in each respective row. ... 66 Figure 5.13 The total number of genes and the number of genes containing any MIR155 seed type that are expressed above and below the indicated RPKM cutoffs in control Mutu I cells were counted and graphed. ... 68 Figure 5.14 Comparison between 3’ UTR analysis and RNA-seq analysis. Distribution of 3’ UTR suppression by MIR155 in reporter assays. ... 69 Figure 5.15 Visualization of junction evidence for EBNA1 (A), BZLF1 (B), and
x
List of Tables
xi
Abstract
The main theme of this dissertation is to develop a distributed computational
pipeline for processing next-generation RNA sequencing (RNA-seq) data. RNA-seq
experiments generate hundreds of millions of short reads for each DNA/RNA sample.
There are many existing bioinformatics tools developed for the analysis and visualization
of this data, but very large studies present computational and organizational challenges
that are difficult to overcome manually. We designed a comprehensive pipeline for the
analysis of RNA sequencing which leverages many existing tools and parallel computing
technology to facilitate the analysis of extremely large studies. RNA CoMPASS provides
a web-based graphical user interface and distributed computational pipeline including
endogenous transcriptome quantification and additionally the investigation of exogenous
sequences.
Keywords
Parallel Computing
GUI User Interface
Transciptomic
Next-Generation Sequencing
RNA-seq Pipeline
1
Chapter 1 Background and Introduction
1.1
Microarray technology
Microarray technology is widely applied in the research of molecular biology by using a
multiplex lab-on-a-chip technology. It typically uses either a one-color or a two-color design to
measure mRNA abundance [Patterson et al., 2006]. As the name implies, one-color design refers
to that one sample is used and two-color design refers to that two independent samples are used
[Shalon et al., 1996]. A small solid glass slide or silicon thin-film cell attaches a large amount of
different nucleic acid probes to hybridize a cDNA or cRNA sample (called target) under
high-stringency conditions. The relative abundance of nucleic acid sequences in the target can be
usually determined by detection and quantification of the probe-target hybridization [Scholin et
al., 1997]. Microarray technology widely involves gene discovery, disease diagnosis, drug
discovery, toxicological research and so on [Liu 2007]. The platform of microarray typically
includes Affymetrix, GeneChip, Illumina and BeadArra. Microarray provides analogue measures
of sequence abundance by measuring the fluorescence intensity of arrayed probe sequences
because of the intrinsic design. The technology has several limitations, for example, limited to
known genome and transcriptomes, limited dynamic range and sensitivity [Russo et al., 2003].
Besides, when researchers deign microarray experiments they rely on the gene annotations which
may be incorrect or outdated. Therefore, microarray technology has a limited ability to detect
alternatively spliced transcripts [Roy et al., 2011]. Microarray was once as the experiment of
choice for transcriptome analysis. Although the use of microarray technology remains active in a
number of research areas, the promising Next Generation Sequencing (NGS) technology is
2
1.2
Next-generation sequencing technology
Next-generation sequencing (NGS) technology or High-throughput sequencing (HTS)
technology is rapidly becoming transformative in many areas of biology because NGS has
significantly improved throughput and dramatically reduced the cost compared with microarray
technology [Corrinne et., 2012]. NGS technology generates hundreds of millions of short
fragments from a library of nucleotide sequences in a single experiment with fewer biases.
Currently, NGS platforms support a range of genetic analyses, including whole genome
resequencing, gene expression analysis and small ribonucleic acid (RNA) analysis [Liu et al.,
2011]. For example, using the Illumina (http://www.illumina.com/) Genome Analyzer platform,
recent applications include sequencing mammalian transcriptomes [Mortazavi et al., 2008], ABI
Solid Sequencing to profile stem cell transcriptomes [Cloonan et al., 2008] or Life Science's 454
Sequencing to discover SNPs in maize [Barbazuk et al., 2007]. Even though technical
differences or applications exist in each platform, the information gathered from each platform
shares similar principle. Compared with microarray technology, NGS experiments also provide
much higher resolution measurements of expression at comparable costs [Marioni et al., 2008].
High-throughput sequencing technologies have overcome many limitations of microarray
technology [Russo et al., 2003]. For example, not limited to known genomes/transcriptomes,
potential for surveying entire genomes/transcriptomes, including novel un-annotated regions,
providing dynamic range and allowing detection of rare sequences, high sensitivity and low
background noise, particularly potential for determining gene structure and so on.
The main theme of this dissertation is to develop computational software tools for
RNA-sequencing technology, which utilizes high-throughput RNA-sequencing technologies to sequence
3
introduce a series of relevant methods and analysis of whole-transcriptome sequencing data
(RNA-seq).
1.3
RNA-seq technology
RNA-seq, also called "Whole Transcriptome Shotgun Sequencing" [Ryan et al., 2008]
("WTSS") and dubbed "a revolutionary tool for transcriptomics" [Wang et al., 2009], quickly
becomes an instrumental assay for transcriptomics research. For many years, the standard
method for determining the sequence of transcribed genes has been to capture and sequence
messenger RNA using expressed sequence tags (ESTs) [Adams et al., 1993] or full-length
complementary DNA (cDNA) sequences using conventional Sanger sequencing technology.
RNA-seq, as an emerging new high-throughput technology, generates far more data per
experiment than the conventional EST sequencing, and it generates data that can be used as a
direct measure of the level of gene expression [Trapnell et al., 2009]. RNA-seq uses
next-generation sequencing (NGS) technologies that can sample the mRNA with fewer biases and low
background noise. We take the example of Illumina platform, the initial step is known as
building a DNA library and then genomic DNA is randomly fragmented and ligated adapters to
both ends of the fragments. By attaching DNA fragments to surface of the flow cell channel in
the second step, the third step is bridge amplification in order to amplify each fragment into a
cluster by adding enzyme and unlabeled nucleotides. The purpose of amplification is to make the
strength of signal stronger so that it is easy to detect the signal from background noise. In the
following steps, it is to scan each base of the clusters from each chemical circle to generate the
sequences using laser. By using this way, RNA-seq can quickly generate hundreds of millions of
4
transcriptomics allowing researchers to characterize gene expression within an organism under a
variety of conditions [Costa et al., 2010].
1.4
Sequence alignment
The first step of any NGS platform consists of sequence alignment and assembly [Valerio
et al., 2010, Metzker 2010]. In an RNA-seq experiment, the computing power to track all the
possible alignments is nontrivial when aligning hundreds of millions of short reads to a reference
genome [Paşaniuc et al., 2010; Manske et al., 2009; Kircher et al., 2011]. In a typical RNA-seq
experiment, hundreds of millions of short reads are generated from a library of nucleotide
sequences. We need to map these short reads of mRNA to identify regions of similarity on the
reference genome. Due to the length of short read, aligning a huge volume of short reads to a
long reference genome poses a great challenge to analysis of RNA-seq data. There are several
tools MAQ [Li H et al., 2008], SOAP [Li R et al., 2008], RMAP [Smith et al., 2008], Bowtie
[Langmead et al., 2009] and Novoalign (http://www.novocraft.com) available for aligning
genomic reads to a reference genome. The Needleman–Wunsch algorithm [Needleman and
Wunsch 1970] and the Smith-Waterman algorithm [Smith and Waterman 1981] are mainly used
to perform sequence alignment. The Needleman–Wunsch algorithm performs a global alignment
on two sequences [Durbin et al., 1998]. It is an example of dynamic programming which was the
first application of dynamic programming to biological sequence comparison and it is suitable
when the two sequences are of similar length with a significant degree of similarity throughout.
The Smith-Waterman algorithm performs a local alignment on two sequences. It is also an
example of dynamic programming and used for dissimilar sequences that are suspected to
contain regions of similarity or similar sequence motifs within their larger sequence context
1.5
Junction mapping
Since short reads are generated from mRNA, which
introns removed. Aligning reads
also a hard nut to crack for researchers.
regions, there are still a few of short reads
aligned against to reference genome
originating from exon-exon junctions in cDNA (around 10%
researchers. However, millions of unmapped short reads originating from
denoted as Initially Unmapped Reads (IUM's), need
expression. To address the IUM problem
al., 2009] and rSeq [Jiang et al.,
IUM's originating from exon-exo
known and novel junctions while Tophat
et al., 2008].
Figure 1.1 Combination of exon
RPKM scores (a) A unique challenge for researchers working with RNA
reads (red) fail to map back to the reference genome because exons are separated by introns. (b) A demonstration of the ideas of combing exon reads (black
gene expression RPKM scores [Xu et al., 2011].
5
t reads are generated from mRNA, which consists exclusively of exons
ligning reads originating from exon-exon junctions to references genome is
to crack for researchers. Although most of the short reads can be
short reads originating from exon-exon junctions
to reference genome [Chepelev et al., 2009]. Thus, working with
junctions in cDNA (around 10%) is a unique challenge for
illions of unmapped short reads originating from exon
denoted as Initially Unmapped Reads (IUM's), need to be accounted for when
IUM problem, ERANGE [Mortazavi et al., 2008], Tophat [
et al., 2008] are among the recently developed approaches to map
exon junctions back to individual genes. ERANGE uses a union of
known and novel junctions while Tophat de novo assembles IUM's using a module in Maq [
xon reads with junction reads to accurately calculate
(a) A unique challenge for researchers working with RNA-seq data. The junction back to the reference genome because exons are separated by introns. (b) combing exon reads (black) and junction reads (red) to calculate [Xu et al., 2011].
consists exclusively of exons with all
exon junctions to references genome is
mapped on exon
exon junctions still cannot be
working with the short reads
unique challenge for
exon-exon junctions,
to be accounted for when measuring gene
], Tophat [Trapnell et
the recently developed approaches to map
genes. ERANGE uses a union of
module in Maq [Li H
6
1.6
Sequence searching
BLASTN, a nucleotide alignment tool, is a very important component of the BLAST+
suite. It can search any properly formatted database and there are several regularly updated
versions of common databases available online. It is compatible with multiple platforms such as
MacOS, Linux, and Windows systems. The time cost and memory requirements of BLAST are
greatly impacted by both the number of sequences being searched against the database and the
size of the database being searched. BLASTN is used to infer sequence function, taxonomy, and
phylogeny. Output in several formats is provided with varying degrees of information, for
example: pairwise (for human readability), BLASTTAB (for ease of parsing by scripts),
BLASTXML (for universal ability to be parsed) and Hit table format. The following table is an
example of hit table format.
Table 1.1 BLAST results in hit table format
Query id: Name of the sequence which was used for the search
Subject id: The name of the sequence found in the BLAST search
Identity: The number of identical residues in the query and hit sequence
Score: The bit score of the local alignment generated through the BLAST search
Hit start: The start position in the hit sequence
Hit end: The end position in the hit sequence
Query start: The start position in the query sequence
Query end: The end position in the query sequence
7
1.7
Taxonomical analysis
Taxonomical analysis is performed to categorize potential exogenous sequences results
generated by BLAST [Altschul et al., 1997]. The BLAST results in hit table format is imported
into MEGAN [Huson et al., 2007] which is a tool developed for metagenomic analysis. MEGAN
[Huson et al., 2007] automatically calculates a taxonomic classification of the reads or a
functional classification using either the SEED or KEGG classification, or both [Huson et al.,
2007]. The SEED classification outputs a tree and each node of the NCBI taxonomical tree is
labeled with a taxon. The size of a given node represents the number of short reads assigned to
that taxon. The results can be interactively viewed and inspected. For example, the researcher
can export all reads that were assigned to a specific taxon for assembling these reads into longer
transcripts using ABySS [Birol et al., 2009]. This provides the researcher with an overview of
reads found in their data of possible exogenous origin. The NCBI classification tree would be
helpful for the researcher to understand the prior biological knowledge of the experiment at hand,
or hypotheses that the researcher wants to test given the taxonomic classification displayed by
MEGAN. Additionally, one can select a set of taxa and then use MEGAN to generate different
types of charts for them.
1.8
De novo
assembly
Each pool of reads exported from a given tax can be subsequently assembled into longer
transcripts using some de novo assembly tools. For example, ABySS [Birol et al., 2009] is a de
novo parallel sequence assembler. In the final phase of RNA CoMPASS, the researcher can
extract reads from a taxon of interest to assemble them into longer transcripts [Birol et al., 2009],
8
view of the particular transcripts that were found within a given taxon. This process can be
repeated for each taxon of interest and the researcher can search the longer assembled transcripts
against the databases again to get more precise hits. This process is the only step of RNA
CoMPASS that is not automated and requires researcher intervention. The researcher can export
all extracted reads from MEGAN [Huson et al., 2007] in a file and then upload this file to the
pipeline to perform the de novo assembly. The researcher can also assemble the reads exported
from “not assigned” or “no hits” category to perform de novo assemble in case they were
portions of longer transcripts that simply were not found by MEGAN [Huson et al., 2007].
1.9
Introduction to transcriptome
The term of transcriptome in genetics is defined as the complete set of all RNA
molecules, including mRNA, rRNA, tRNA, and other non-coding RNA produced in one or a
population of cells, or it can be referred to as the total of transcripts (or called isoform) or the
specific subset of transcripts in a living cell [Pacheco et al., 2006]. Unlike the genome that nearly
does not change in a living cell except for mutation cases, transcriptome is highly diverse,
dynamic, complex and overlapping [Li et al., 2010]. The transcriptome dynamically varies under
different external environmental conditions at a particular time, such as specialized tissues or cell
lines. Most of the transcripts are processed by splicing to remove introns and generate a mature
transcript or messenger RNA (mRNA) that only contains exons. Importantly, the range of
transcriptome is enhanced by alternative splicing. Alternative splicing is a fundamental
molecular process of multiple transcripts from a single gene due to variations in the splicing
reaction of pre-mRNA [Garcia-Blanco et al., 2004]. An exon can be either included or excluded
9
Global transcriptome analysis is becoming important in understanding how altered
expression of genetic variants contributes to complex diseases such as cancer, diabetes, and other
genetic disease [Olden et al., 2011]. Analysis of the transcriptomes of human is used to
understand the molecular mechanisms and biological signaling pathways controlling early
embryonic development.
1.10
Analysis of exogenous sequence
Since the human body is a persistent host to a spectrum of not only bacterial organisms
but also viruses, any biological contamination of foreign organisms occupying the host will be
referred to as exogenous agents [Sekirov et al., 2010]. Harbor exogenous agents such as the
human tumor viruses and bacterial have been found in many commonly used cell lines for
biological studies. Therefore, contamination is an important factor that must be considered for
any biological experiment [Coco et al., 2011]. However, the conventional approaches often have
limitations in globally assessment of the presence of foreign organisms within cell model
systems. With high-throughput sequencing technology, some significant evidences have been
found in commonly used cell lines such as Epstein-Barr virus (EBV) virus transcription in type I
Burkitt’s lymphoma cells [Lin and Xu et al., 2010]. In a RNA-seq experiment, the researchers
often extract the mapped reads for further analysis, for example transcriptome characterization
and quantification [Xu et al., 2011]. And the reads that do not map well to the reference genome
are often simply discarded. However, important information could be lost by ignoring these
unmapped reads. Some of the reads that do not map to the host genome could be indicative of
bacterial or viral sequences in the RNA-Seq experiment [Coco et al., 2011]. Analysis of
exogenous sequence will be referred to as exogenous agent coding reads from analysis of the
10
sequences from the host organism. BLAST is used to search the possible exogenous sequence
reads against a very large and broad database [Benson et al., 2010] in our computational pipeline.
1.11
Analysis of endogenous sequence
Quantifying genomic feature abundance in cells via measurement of mRNA levels
arouses researchers’ interest all the time [Tuller et al., 2007]. For analysis of transcriptome
quantification, it includes estimation of gene abundance score at gene level and isoform
(transcript) level.
For measuring gene expression, we often have to align short reads to original positions
against a reference genome using alignment tools such as Bowtie, Novoalign and other sequence
aligner. Then we can count the number of short reads mapped on gene regions based on gene
annotation table to estimate the genomic feature abundance. In RNA-seq experiment, for
instance, ERANGE reports the number of mapped Reads Per Kilobase of exon per Million mapped reads (RPKM) for each gene, a measure of transcription activity [Trapnell et al., 2009].
For paired-end short reads, we measure the transcript-level relative abundance
in Fragments Per Kilobase of exon model per Million mapped fragments (FPKM).
RPKM/FPKM 10
C is the total number of mapped short reads or fragments, L is the length of exons and N
is the total number of short reads in one lane of one experiment. When scaled to range [0, 1000],
this value stands for the normalized depth of coverage for each gene. Using this way, we can
estimate the abundance of mRNA in the cells. Even though it has been shown that there is no
11
2003], measurement of mRNA levels is still very useful in determining how cells differ between
a healthy state and a diseased state and other research problems.
Transcript quantification using RNA-seq plays a critical role in a wide range of
transcriptomics research. Since the diverse alternative splicing mechanisms of transcripts, it can
pose a challenge for researchers in transcript quantification. Fortunately, there are several
existing bioinformatics tools and computational approaches have been developed to use high
throughput gene expression profiling data collected RNA-seq experiments such as, Cufflinks
[Trapnell et al., 2010], rQuant.web [Bohnert and Rätsch 2010], RAEM [Deng et al., 2011] and
iQuant [Nguyen et al., 2011]. In our pipeline, we implemented RAEM algorithm [Deng et al.,
2011] and iQuant algorithm [Nguyen et al., 2011].
12
1.12
Motivation
Technical limitations of microarray technology constrain its ability to comprehensive
human transcriptome quantification and the typical endogenous RNA-Sequencing analysis along
with the investigation of exogenous sequences. Fortunately, high-throughput multiplexed
next-generation sequencing provides a digital readout of absolute transcript levels and imparts a
higher level of accuracy and dynamic range than microarray platforms. High-throughput RNA
sequencing has become an instrumental assay for transcriptomics research. There are many
existing bioinformatics tools designed for analysis and visualization of this data, but very large
studies present computational and organizational challenges that are difficult to overcome
manually. A dramatic increase in the size of datasets often exceeds the computing capability of
these tools run on a single workstation. We have designed a comprehensive pipeline for analysis
of RNA sequencing which leverages many existing tools and parallel computing technology to
facilitate the analysis of extremely large studies. RNA CoMPASS provides a web-based
graphical user interface and distributed computational pipeline including endogenous
transcriptome quantification along with the investigation of exogenous sequences. RNA
CoMPASS is deployable on either a local cluster or a grid environment managed by Portable
Batch System (PBS) submission.
1.13
Overview
This thesis is organized into 6 chapters. In Chapter 1 we introduce background,
motivation and overview. We describe the next-generation technology and the related hot
biological problems that biologists are interested in, and then we also present out motivation that
13
investigation of exogenous sequences. In Chapter 2 we describe methods and tools. In this
chapter, we detailed introduce the methods and tools used in RNA CoMPASS, and we show the
limitations of the existing tools and provide our novel solution to solve these challenges. In
Chapter 3 we present design and implementation of RNA CoMPASS. In this chapter, we
describe two frameworks used in RNA CoMPASS, JPPF framework and PBS framework. With
these two frameworks, the pipeline can be deployed on either a local small cluster or a grid
system managed by PBS scheduling submission. The system greatly facilitates the analysis of
large RNA sequencing studies through automated dataflow management and acceleration of
processing via distributed computing over a cluster. Besides, we also adopt the layer structure
and Model-View-Controller (MVC) model to implement the pipeline. With this design model,
the pipeline shows the advantages of implementation over other tools, for example, extensibility,
reusability, scalability and functionality. In Chapter 4 we discuss the key features offered by the
pipeline including the analysis of endogenous sequence and the investigation of exogenous
sequence, and related useful applications. In Chapter 5, we list the important results of all key
features offered by the pipeline and compare the performance of the pipeline with the extra-large
dataset. In Chapter 6 we draw a conclusion of the thesis and present the contribution of the
pipeline for transcriptomics research.
The thesis is largely based on the following list of relevant publications and software. In
the category of discovery and visualization of exogenous sequences of non-host origin, the
submitted paper 1) mainly focus on the implementation and contributions of the pipeline RNA
CoMPASS which is designed and implemented by me; in the paper 2) I contributed part of
results from the tool PARSES, which has been integrated into the new pipeline; in the paper 3)
14
CoMPASS. In the category of the performing of extensive endogenous RNA-Seq analysis for
the host organism, I performed the sequence alignment, ranked the list of gene abundance and
provided the important results in the paper 4). In the paper 5), the results are generated from the
software SAMMate. The paper 6) is mainly focus on the implementation and contributions of
the software SAMMate which is designed and developed by me.
• Discovery and visualization of exogenous sequences of non-host origin
1) Xu Guorong, Strong M, Flemington EK and Taylor C: RNA CoMPASS: RNA comprehensive multi-processor analysis system for sequencing. (In submission)
2) Lin,Z, Puetter A, Coco J, Xu Guorong, Strong M, Wang X, Fewell C, Baddoo M, Taylor C and Flemington EK: Detection of Murine Leukemia Virus in the Epstein-Barr Virus-Positive Human B-Cell Line JY, Using a Computational RNA-Seq-Based Exogenous Agent Detection Pipeline, PARSES. J. Virology, 2012; doi: 10.1128/JVI.06717-11
3) #Strong M, #Xu Guorong, Coco J, Concha M, Baribault C, Baddoo M, Taylor C and Flemington EK: Detection and transcriptome analysis of Epstein Barr virus in RNA-seq data from clinical Gastric Carcinoma samples using a computational pipeline RNACoMPASS (RNA comprehensive multi-processor analysis system for sequencing) (In preparation).
• Performs extensive endogenous RNA-Seq analysis for the host organism
4) Xu Guorong, Fewell C, Taylor C, Deng N, Hedges D, Wang X, Zhang K, Lacey M, Zhang H, Yin Q, Cameron J, Zhen L, Zhu D and Flemington EK: Transcriptome and targetome analysis in mir155 expressing cells using rna-seq. RNA (New York, N.Y.), 2010; 16(8):1610-1622.
5) #Lin Z, #Xu Guorong, Deng N, Taylor C, Zhu D and Flemington EK: Analysis of EBV transcriptome using RNA-seq. J. Virology, 2010; doi:10.1128/JVI.01521-10.
6) Xu Guorong, Deng N, Zhao, Z, Flemington EK and Zhu D: SAMMate: A GUI tool for processing short read alignment information in SAM/BAM format. Source Code for Biology and Medicine, 2011; 6:2
• Software
RNA CoMPASS [available from, http://rnacompass.sourceforge.net]
15
Chapter 2 Architecture of RNA CoMPASS
2.1
Introduction
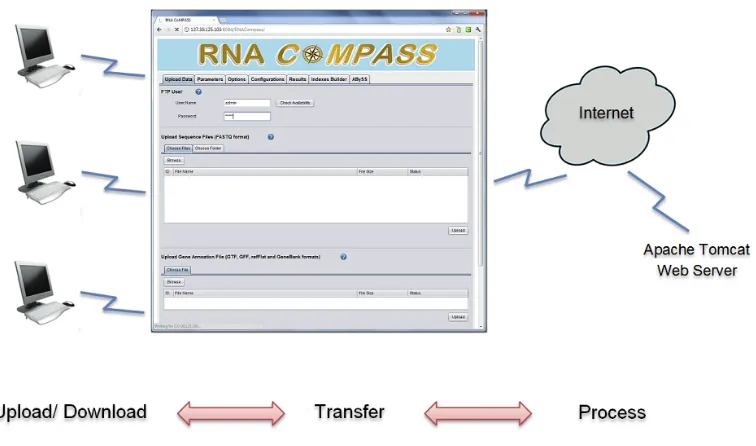
RNA CoMPASS uses a Client-Server (C/S) structure to simplify installation and
maintenance so that the researcher just needs to open a web browser to access RNA CoMPASS
via the internet. The researcher interacts with a Graphical User Interface (GUI) to upload their
data to the Tomcat web server portion of RNA CoMPASS and initiate the analysis. The Tomcat
web server connects to the computational cluster to perform processing of the analysis and
results are stored on the Tomcat web server. The researcher can now download analysis results
from the server for visualization and/or further downstream analysis. By using this architecture,
RNA CoMPASS provides cross-platform compatibility. The researcher doesn’t need to install or
upgrade any software; all installation and upgrade procedures are performed on the Tomcat
server by the administrator. RNA CoMPASS has a very user-friendly GUI and an embedded
FTP server providing secure and fast data transfer.
16
2.2
Java Parallel Processing Framework (JPPF)
Java Parallel Processing Framework (JPPF) is a distributed parallel processing
framework based on a Client and Server architecture. A JPPF grid consists of 3 kinds of
components that communicate with each other: client submits work to the cluster, and the server
receives work from the clients and distributes it to the computational nodes which execute the
work in parallel.
Figure 2.2 Overview of RNA CoMPASS deployed on a local cluster with JPPF structure.
The administrator can assign one machine in a lab as the JPPF server, and assign the
others as computational nodes. Setup a local cluster in this fashion is very simple. The
administrator downloads one package and unzips it on the JPPF server which RNA CoMPASS is
running on, then launches it by typing the command "ant". RNA CoMPASS can automatically
detect the JPPF server and send tasks to the JPPF server via the JPPF API. Then the JPPF server
assigns tasks to its attached node machines and collects results from each node machine after
processing.
2.3
Grid system managed by Portable Batch System (PBS) submission
A computer grid environment consists of a set of loosely connected computers that work
together so that they can be treated as a single system in many respects. Portable Batch System
17
allocating computational tasks such as batch jobs across the available computing resources of the
grid.
RNA CoMPASS is easy to deploy to a grid system managed by PBS submission. The
administrator copies the Novoalign and BLAST executable files, related Novoalign index and
NT database files, and some shell scripts to the grid data storage center. Then the administrator
enables the PBS feature by modifying a property in an RNA CoMPASS system file. A grid
system with more than one hundred machines can greatly accelerate the data processing.
Figure 2.3 Overview of RNA CoMPASS deployed on a grid system managed by PBS submission.
2.4
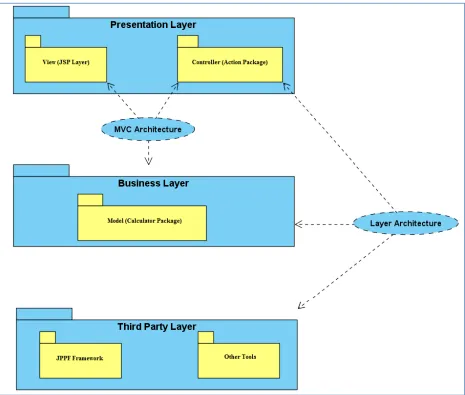
Layer structure of RNA CoMPASS
We now provide a description of the software architecture to enlighten users about key
RNA CoMPASS modules and their interconnections. The architecture of RNA CoMPASS
follows the standard Model-View-Controller (MVC), a common architectural pattern used in
software engineering. The MVC approach decomposes the problem into input data (model),
presentation of the data (view), and business logic (controller) (Figure 2.4). The basic software
architecture has three components: JSP pages package (Presentation of the data processing
18
processing module). The advantages of adopting the MVC approach are malleability, modularity,
reusability, flexibility and extensibility.
RNA CoMPASS’s reusability is very robust as developers can easily reuse existing
classes by using the new method to create an instance of a class. RNA CoMPASS is also very
extensible. If a user wishes to expand upon a component, the user may simply use the “extends”
key word to inherit the methods and properties of the desired class. Developers may also
conveniently add classes to implement new features. For example, developers may add a new
parser to process a gene annotation file in a new format by adding a class to the Alignment
package. Furthermore, a developer may add a new tab in the Applet interface of JSP page to
support new features. One other important feature of RNA CoMPASS is its configurability. For
example, RNA CoMPASS allows users to flexible switch RNA CoMPASS to deploy on a local
cluster (JPPF framework) to a grid system (PBS submission) in a configuration file. In summary,
the RNA CoMPASS software architecture implements a number of Applied Programming
19
20
Chapter 3 Methods and Tools
3.1
Introduction
High-throughput RNA sequencing has revolutionized the field of transcriptomics
allowing researchers to characterize gene expression within an organism under a variety of
conditions [Costa et al., 2010]. New sequencing technologies can rapidly and inexpensively
generate hundreds of millions of short reads from a single experiment. There are a plethora of
quality bioinformatics tools available for mapping these reads to a host genome and performing
additional downstream analyses. However, the management of large studies and heavy
computational burden can pose a challenge for researchers who may not be familiar with
command-line tools or notions of distributed computing. To address this growing problem, we
have developed a comprehensive system for RNA-seq analysis (RNA CoMPASS) that is
accessed via an easy to use web-based graphical user interface. This system is deployable to a
local cluster or a grid environment to address the growing need for computing power brought
about by larger studies. RNA CoMPASS leverages some of the most useful open source tools
and automates the distribution of the computational burden over the available computing
resources. In addition to performing the typical analyses of endogenous sequences, RNA
CoMPASS also incorporates a new method to discover exogenous agents [Coco et al., 2011].
3.2
Data flow through RNA CoMPASS
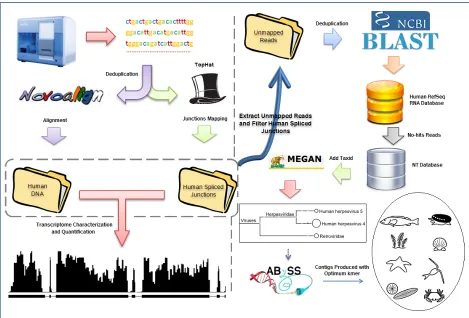
The data flow through RNA CoMPASS is shown in the Figure 3.1. At first, the new
machine generates hundreds of millions of short reads; then we use Novoalign or TopHat to
align short reads against the reference genome. The reads mapped on exon or junction regions
21
gene level or isoform level. Then, we extract unmapped reads and de-duplicate the short reads. In
the following steps, we use BLAST to search unmapped reads against human RNA database and
NT database. This step is extremely computationally intensive. Taxonomical analysis is
performed in the next step by importing the BLAST results into MEGAN to categorize
exogenous sequences. MEGAN generates a tree and each node of this tree is labeled by a taxon.
This provides the researcher with an overview of reads found in their data of possible exogenous
origin. In the last step, the researcher can export all reads that were assigned to a specific taxon
for further analysis. For instance, we can use ABySS to assemble the reads into longer transcripts
of specific species.
22
3.3
Initial Serial Pipeline
In the initial version, we serially run our pipeline and faced some technical challenges.
For example, huge sized data file and many existing bioinformatics tools involved. It is hard for
biomedical researchers to deal with many command-line tools. Some of tools need to run on a
very powerful workstation with a lot of memory and they are time consuming. Novoalign and
BLAST are bottle neck in the whole pipeline. We often spent more than one day to finish one
small sample with less than 1 GB file on a very powerful Mac machine with 64G memory and 24
CPU processors. For solving this problem, the solution is the parallel computing.
23
The key to parallelization is to split the data into many pieces and allocate these small
dataset to many machines, then gather and merge the results together and continue the next step.
For example, we split the large data file into N small files and send 1 small file to 1 of N
machines to run Novoalign. It is the same as BLAST. The parallelized pipeline has several
advantages over the previous version. Each machine can use memory more efficient and can
speed up N times theoretically. By adding one additional step that BLAST against RNA database,
we can improve the accuracy of hits. In particular, the new parallelized version can handle
extremely large data file from extensive sequencing projects. We only spend several hours to
finish one real sample data with more than 20 million of short reads data file on a local cluster
with 3 Mac machines.
3.4
Methods
RNA CoMPASS incorporates many existing sequence analysis tools for alignment of
short reads, mapping of splice junctions, estimation of transcriptome abundance at both gene and
isoform level, searching of sequence databases and assembly of reads into longer transcripts. The
system facilitates analysis of large RNA sequencing studies through automated dataflow
management, access through a convenient graphical user interface, and acceleration of
processing via distributed processing over a cluster.
3.4.1
Exons reads alignment using Novoalign
The first phase of RNA CoMPASS is to perform the alignment of millions of short reads
against the host genome using a very accurate aligner, Novoalign (http://www.novocraft.com/).
Novoalign categorizes reads into four classes: uniquely mapped reads, repeat mapped reads,
unmapped reads and quality controlled reads. Typical endogenous RNA sequencing analysis
24
reads. For the investigation of exogenous sequences, we extract unmapped reads from the
alignment results, which typically comprise 10% to 15% of total reads in human studies [Lin et
al., 2012]. This initial mapping phase is accelerated by deduplicating input reads and distributing
across many computing nodes to perform alignment in parallel.
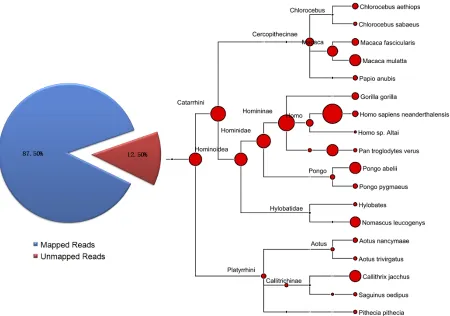
Figure 3.3 Investigation of exogenous sequences. On average 87.5% of our reads from RNA-seq experiments in human are identified as mapped reads. The remaining 12.5% of reads that are unmapped could potentially indicate bacterial or viral sequences from exogenous sources.
3.4.2
Junctions reads alignment using TopHat
The second phase utilizes TopHat [Trapnell et al., 2009] to identify splice junction reads
that span multiple exons. These splice junction reads are not detected by Novoalign and typically
comprise 5% to 6% of the original reads [Xu et al., 2011]. Up to half of the unmapped reads
from Novoalign are identified as splice junction reads using TopHat. RNA CoMPASS removes
25
from TopHat. These reads would not be mapped by Novoalign to the human reference genome
because of the presence of introns. Since this phase is independent of the Novoalign mapping, it
is started in parallel with the first phase and upon completion of these two mapping tasks, the
processing is bifurcated into analysis of endogenous sequences and investigation of exogenous
reads. The second phase is optional and it is only designed for reference genomes which have
transcripts that are alternatively spliced from individual genes.
3.4.3
Sequence searching using BLAST
Exogenous sequence analysis proceeds concurrently with the endogenous analysis. This
phase of RNA CoMPASS utilizes BLAST [Altschul et al., 1990] to search unidentified reads
from the initial mapping stages against the NCBI NT database for identification. This process is
extremely computationally intensive and is distributed across the computing cluster to minimize
processing time and memory requirements. The running time and memory requirements of
BLAST rely on the number of reads being searched and the size of the NCBI NT database. RNA
CoMPASS filters out reads originating from the human genome prior to search against the NCBI
NT database to help manage the computational requirements of this intensive BLAST analysis.
We have also discovered that many of the reads that were not mapped to the host genome in the
first two stages of analysis are, in fact, identified by BLAST as mapping to the host genome
since BLAST is a more permissive search. In order to further reduce the computational burden,
RNA CoMPASS offers an optional stage prior to the BLAST against NT where the user can
BLAST against a host transcript database to further filter these reads from consideration. This
stage takes advantage of the lower computational burden of BLASTing reads against a smaller
database (the host transcript database) before BLASTing the remaining reads against a larger
26
3.4.4
Taxonomical analysis using MEGAN
Taxonomical analysis is performed in the next phase by importing the BLAST results
into MEGAN [Huson et al., 2007] to categorize exogenous sequences. To allow MEGAN to
determine the taxon associated with matches, the NCBI taxon id number is appended to each
BLAST hit by looking up the GI accession number of the hit in the GI to TaxID file. MEGAN
then determines the taxon associated with matches based on the hit table using a lowest common
ancestor algorithm. MEGAN categorizes the exogenous sequences and outputs a NCBI
taxonomy tree. Each node of the output tree is labeled by a taxon and the size of a given node
represents the number of reads assigned to that taxon. This provides the researcher with an
overview of reads found in their data of possible exogenous origin. The NCBI classification tree
helps the researcher to evaluate exogenous sequence content armed with thier biological
knowledge of the experiment at hand. The researcher can also formulate hypotheses to test given
the taxonomic classification displayed by MEGAN (Huson et al., 2007). The researcher can
export all reads that were assigned to a specific taxon for further analysis including de novo
assembly of transcripts from a given taxon.
3.4.5
De novo
assembly using ABySS
In the final phase of RNA CoMPASS, the researcher can choose taxons of interest to
extract reads from and assemble them into longer transcripts [Birol et al., 2009] using a de novo
parallel sequence assembler. This process provides the researcher with a broader view of the
particular transcripts that were found within a given taxon. De novo assembly can be repeated
for each taxon of interest and the researcher can search the longer assembled transcripts against
27
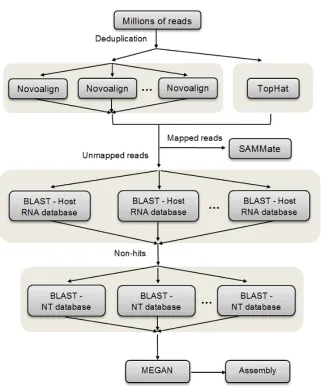
Figure 3.4 Overview of RNA CoMPASS workflow. After deduplication, raw sequence data in FASTQ format is aligned against the reference genome using Novoalign and TopHat. Reads which are mapped are used for endogenous analysis by SAMMate, and unmapped reads are used for exogenous analysis by searching against an optional RNA database and the NCBI NT database by BLAST. Taxonomical analysis is performed on the BLAST results using MEGAN and reads from a given taxon of interest can be extracted for assembly into longer transcripts by assembly tools.
3.4.6
Gene expression calculation
Genomic feature abundance score at gene level is performed via the SAMMate analysis
pipeline [Xu et al., 2011]. Gene expression is calculated using Reads/Fragments Per Kilobase of
exon model per million Mapped reads (RPKM/FPKM) [Trapnell et al., 2009].
RPKM/FPKM 10
28
C is the total number of mapped short reads or fragments, L is the length of exons and N
is the total number of short reads in one lane of one experiment. When scaled to range [0, 1000],
this value stands for the normalized depth of coverage for each gene.
For accurate calculation of the expression abundance score for annotated genes, we need
a gene annotation file for the host genome to calculate the total length of exons. Using the
uniquely mapped reads and repeat mapped reads from Novoalign along with splice junction
reads identified by TopHat to count the total number of mapped reads on the exons of annotated
genes. Then we are able to calculate the gene RPKM/FPKM value using the RPKM/FPKM
formula.
3.4.7
Transcript expression calculation
Transcript quantification is computed via RAEM algorithm [Deng et al., 2011] and
iQuant procedure [Nguyen et al., 2011] to accurately estimate the relative proportions and
transcript abundance scores.
For RAEM algorithm, we infer an unobserved fragment-originating matrix (Z and Z’)
from the observed fragment-compatible matrix (Y and Y’) for each gene. A row of the matrix
represents one fragment and a column of the matrix represents one transcript. Then we
implement the EM algorithm as the following [Deng et al., 2011],
E-step: , ,
∑ !, , "#, $
M-step: % ∑ &' ,, "$
( )
*+ ,
29
i = (1,2…,I) is row index of the mapped fragments, j= (1,2…,J) is the column index of
transcript index, 0is the length of jth isoform and P = (1, 12… 13, and ∑ 13' 1.
Then the expression abundance for each transcript is:
( 41
50 6
0 , $ 1,2 … , /
And 06is the sum of total exon length of a gene, and 0is the sum of total exon length of a
transcript in this gene.
We implemented the EM algorithm [Deng et al., 2011] using Java language in RNA
CoMPASS as the following,
/**
* The following method is to estimate the proportions using EM procedures * @param E
* @param gene * @return */
private Matrix calculate(Matrix E, double countedReadsNum, Gene gene) {
long isoNum = E.getColumnCount(); long readsNum = E.getRowCount();
Matrix newIsoProps = DenseMatrix.factory.ones(1,isoNum); newIsoProps = newIsoProps.divide(isoNum);
Matrix z = DenseMatrix.factory.ones(1,isoNum); Matrix n = DenseMatrix.factory.zeros(1,isoNum); Matrix isoProps = DenseMatrix.factory.ones(1,isoNum); try
{
while(isoProps.minus(newIsoProps).normF() > 0.0001) {
isoProps = newIsoProps.clone();
n = DenseMatrix.factory.zeros(1,isoNum); for (int i = 0; i < readsNum; i++)
{
double temp = 0;
for (int j = 0; j < isoNum; j++) {
z.setAsDouble(E.getAsDouble(i,j) * (isoProps.getAsDouble(0,j)), 0, j); temp += z.getAsDouble(0, j);
}
for (int j = 0; j < isoNum; j++) {
if (temp == 0)
30
z.setAsDouble(z.getAsDouble(0, j)/temp, 0, j); n.setAsDouble(n.getAsDouble(0,j) + z.getAsDouble(0,j), 0, j); }
}
for (int j = 0; j < isoNum; j++)
newIsoProps.setAsDouble(n.getAsDouble(0,j)/readsNum , 0, j); }
}catch (Exception e) {
System.out.println("The gene cannot be calculated: " + gene.m_geneID); System.err.println(e.getMessage());
return null; }
gene.m_predictedExpValue = 1000000000 *
(double)gene.m_copies/(double)(gene.getTotalExonLength() * countedReadsNum); gene.m_expressionValue = gene.m_predictedExpValue;
return newIsoProps; }
For iQuant algorithm, we construct a relationship matrix of transcripts and exons for each
gene from genomic annotations. In this matrix, each row represents one base of an exon and each
column represents one transcript. Then we observe the depth at each base by calculating the
coverage of mapped reads on genes. The mathematical framework is as the following [Nguyen et
al., 2011],
7 8 · : ; < =
1 0 … 1+
0 12 … 1+
… … … …
1 12 … 0
> =
? ?2 … ?@
? ?2 … ?@
… … … … ? ?2 … ?@
> ; <
In the matrix E, it has N samples and M rows, each row corresponds one base of exons.
Matrix W encodes the proportions between the isoforms and the output signals. Matrix R consists
of samples of L isoforms.
Then we formulated this mathematical framework into a constrained convex quadratic
problem:
min ||7 E 8:||2 F. H. I 1 1, 1 J 0, # 1,2, … , 0. +
31
It is known that the optimal solution to the above equality-only constrained estimation
exists. And we implemented the iQuant algorithm [Nguyen et al., 2011] using Java language in
RNA CoMPASS as the following,
/**
* The following method is to estimate the proportions using one step procedure with * known gene expression score.
* @param E * @param W * @param score * @param gene * @return proportions */
private Matrix oneStep(Matrix E, Matrix W, double score, Gene gene) {
long sampleNum = E.getColumnCount(); long lengthExons = E.getRowCount(); long isoNum = W.getColumnCount(); Matrix S = W.clone();
Matrix A = DenseMatrix.factory.ones(1,isoNum); int b = 1;
Matrix z = E.toRowVector(Ret.NEW);
Matrix isoProps = DenseMatrix.factory.ones(1,isoNum); try
{
Matrix H = DenseMatrix.factory.zeros(0,0);
for (int i = 0; i < sampleNum; i++)
H = H.appendVertically(S.times(score));
Matrix temp0 = (H.transpose().mtimes(H)); Matrix xHatLS = null;
if (!temp0.isSingular())
xHatLS = temp0.inv().mtimes(H.transpose()).mtimes(z); else
return null;
Matrix temp5 = (H.transpose().mtimes(H));
if (temp5.isSingular()) return null;
Matrix B = temp5.inv();
Matrix temp4 = (A.mtimes(B).mtimes(A.transpose()));
if (temp4.isSingular()) return null;
32 isoProps = xHatCLS.transpose();
W = DenseMatrix.factory.zeros(lengthExons,isoNum); gene.setPredictedExpValue(score);
} catch (Exception e) {
System.out.println("The gene cannot be calculated: " + gene.m_geneID); System.err.println(e.getMessage());
return null; }
Matrix E_mean = DenseMatrix.factory.ones(lengthExons,1).times(E.getMeanValue()); Matrix rs_v = DenseMatrix.factory.ones(isoNum,1).times(gene.m_predictedExpValue); Matrix dif1 = E.minus(W.mtimes(rs_v));
Matrix dif1_square = dif1.transpose().mtimes(dif1);
Matrix dif2 = E.minus(E_mean);
Matrix dif2_square = dif2.transpose().mtimes(dif2);
gene.m_Rsquare = 1 - dif1_square.doubleValue()/dif2_square.doubleValue();
return isoProps; }
3.4.8
Detection of differentially expressed genes and isoforms
In RNA CoMPASS, we allow users to detect differentially expressed genes and isoforms
with support for edgeR. For each gene or transcript, we can count the total number of mapped
reads and construct a matrix. In this matrix, each row represents one gene or one transcript, and
each column represents one sample. The total number of column should be greater than 6. The
entries of this matrix represent the total number of mapped reads for each gene or transcript.
After we construct this matrix, we can import it to edgeR to calculate differentially expressed
genes and isoforms.
S1 S2 S3 S4 S5 S6
KL%L 1 KL%L 2 KL%L 3 KL%L 4 KL%L 5 … KL%L P QR
R R R R
S%%2 %%222 %%2TT %%U2U %%2VV %%W2W
%T %T2 %TT %TU %TV %TW
%U %U2 %UT %UU %UV %UW
%V %V2 %VT %VU %VV %VW
… … … …
%X %X2 %XT %XU %XV %XWY
33
3.4.9
Generation of reads coverage file for visualization
RNA CoMPASS allows users to generate a reads coverage file in wiggle format for other
important visualization tools. For example, a wiggle file can be used for UCSC Genome Browser
visualization of gene structure variation and a signal map file at single base pair resolution can be
used for peak detection [Xu et al., 2011]. For each strand, RNA CoMPASS generates one array
to save the coverage depth at each base for one chromosome. For example, we have 24
chromosomes and each chromosome has two strands. All these reads coverage information will
be outputted into one text file following a standard wiggle format. The users can import the
wiggle file to UCSC Genome Browser to visualize the gene structure variation.
Figure 3.5 Overview of coverage file in wiggle format.
3.5
Existing bioinformatics tools used in RNA CoMPASS
As the RNA sequencing technology has become an instrumental assay for transcriptome
research. There is a plethora of quality bioinformatics tools available for mapping these reads to
a host genome and performing additional downstream analyses. However, the management of
many existing command-line tools can pose a challenge for researchers who may not be familiar
with command-line tools or notions of distributed computing. To address this growing problem,
34
accessed via an easy to use web-based graphical user interface. In this pipeline, we have
integrated many popular bioinformatics tools.
3.5.1
Novoalign
Novoalign is a highly accurate sequence alignment tool which is optimized for short
sequences. We need to build an index file based on the reference genome using Novoindex script,
and then we import the sequence data files by running Novoalign against the reference genome.
The alignment results are restored a text file in SAM format. If the sequence data is paired-end,
we need to input one pair of sequence files into Novoalign, and Novoalign will generate one
alignment resulting file in SAM format.
Using different parameters of k-mer length and step size, the index file generated by
Novoindex will have different size. For example, for searching the full human genome on a 16
GB RAM workstation, the recommended parameters are k-mer length = 14 and step size=2, the
theoretical index size is around 13.5GB.
The step is very computationally intensive and we have parallelized this module in RNA
CoMPASS to accelerate the processing. For the local cluster, we install Novoalign on each
machine with Novoalign index files. Then we copy the executable shell scripts on each machine
same as the Novoalign index files. The workhorse server allocates all tasks to each attached node
machines, then the server collects the results from each node machine after the node machine
finishes the task. After merging all results into one single file, the workhorse server will continue
to precede the next step. For the grid system managed by Portable Batch System (PBS), we just
need to copy the Novoalign executable file, related index files and some shell scripts to the grid