178
Copyright © 2011-15. Vandana Publications. All Rights Reserved.
Volume-5, Issue-3, June-2015
International Journal of Engineering and Management Research
Page Number: 178-183
A Review on Rainfall-Runoff Modelling using Mike 11 NAM Model, ANN
and SCS-CN Methods
K. Satish Kumar1, H.L.Tiwari2
1
M. Tech Student, Department of Civil Engineering, Maulana Azad National Institute of Technology, Bhopal, INDIA
2
Assistant Professor, Department of Civil Engineering, Maulana Azad National Institute of Technology, Bhopal, INDIA
ABSTRACT
Hydrological models are the simplified, conceptual and mathematical description of rainfall, runoff, oceans, rivers, groundwater, snow etc. Rainfall-runoff modeling in the broader sense a hydrological, mathematical model gives a detailed account of Rainfall-Runoff relationships of a catchment area or watershed. Conversion of rainfall into runoff takes place in the modelling. There are many methods developed for calculating the runoff. Among them the models or methods which are explained in the current study are MIKE 11 NAM Model, Soil Conservation Service Curve Number (SCS-CN) Method and Artificial Neural Network (ANN) Method. In NAM model, 9 parameters are used and adjusted for calculating the runoff. Temperature, rainfall, evapotranspiration are mainly needed. In SCS method soil information, rainfall, storm duration, soil texture, type & amount of vegetation cover and conservation practices are considered. In ANN method, a dimension is added to the modelling. The three models are explained and compared in the present study.
Keywords—Rainfall-Runoff modelling, MIKE 11 NAM Model, SCS-CN Method, ANN Method.
I.
INTRODUCTION
A Rainfall-runoff model is a mathematical representation relating the rainfall–runoff
relations of a catchment area or watershed.
Due to adverse ground conditions, financial conditions, user can’t obtain good results. At that time a method which gives good results without considering the basin conditions is required, which is ANN Method. The ANN is based on black-box model. It creates a nonlinear function between rainfall and discharge for the old data Rainfall-runoff
models are the prior tools to anticipate the responses of a basin with a given amount of rainfall. Therefore these models can be used for planning, design, flood forecast and one which achieves greatest naturalism with least parameters and model complications management of water resources systems. The best model is the one which
achieves great realism with least parameters. The analysis of runoff for a catchment is very important for flood studies, hydrological analysis and many other approaches. A hydrological model is a realistic, experimental and empirical tool for the estimation of runoff.
Many researchers have developed different techniques for rainfall-runoff modelling. Based on the problem statement and on the complexities involved, these models are categorized as empirical, black-box, conceptual or physically-based distributed models. Physically based models are very complex and need a lot of data and very tedious for the application purpose. Black-box models will form a relationship between input and the output functions without considering the complex physical law managing the natural process such as rainfall-runoff transformation.
MIKE11 NAM which is a rainfall-runoff model (RR). NAM is a conceptual rainfall-runoff model that represents the different phases of hydrological cycle. MIKE 11 is used for the simulation of flows transportation of sediments and quality analysis of rivers, channels and other water bodies. The NAM is a lumped, deterministic and conceptual rainfall-runoff model which splits conceptually into surface flow (overland flow), subsurface (inter flow) and base flow. Rainfall, Temperature and Evapotranspiration are the basic data required for this model.
179
Copyright © 2011-15. Vandana Publications. All Rights Reserved.
and predicts the future discharge using an optimumnetwork suited for the given problem statement.
II.
REVIEW OF LITERATURE
This part of the paper deals with the research work done on rainfall-runoff modelling and NAM model, SCS-CN Method, ANN Method. Research work principles, model development methodologies and conclusions have been discussed briefly.
Rainfall-Runoff modelling:
Horton (1933) [12] is the first person who proposed a model for runoff generation based on infiltration capacity, which is widely known as Horton overland flow. Another widely accepted runoff concept was given by Dunne (1970) in which importance of rising water table is considered for the generation of runoff. Ponce et al., 1978 [23]; Parlange et al., 1981 [21] explained about the development of simplified models using kinematic wave approximations.
Keith Beven (1982) [3] developed a simple theory for predicting the response times of saturated and unsaturated flows on hill slopes using kinematic wave equations.
Julien and Moglen (1990) [14] stated that there is an influence of spatial variability in surface slope, surface width, roughness and excess rainfall intensities on overflow runoff characteristics. Finite element overflow runoff simulations using the kinematic wave approximations of St-Venant equations combined with Manning’s resistance formula were used for the comparison of 1-D systems
Abdulla and Lettenmaier (1997) [1] In continuation of the above study, out of nine parameters they concluded seven of a large scale model for Red and White river basins in USA. From STATSGO soil data they estimated two of the model parameters. For other parameters they developed multiple regression equations using catchment variables related to soil and climate. They obtained good results in most cases and performance was good in humid and sub humid catchments compared to semi-arid to arid catchments.
Seibert and McDonnell (2002) [25] have used multi criteria soft data for rainfall runoff model development, calibration and validation. Soft data as well as hard data was used for calibration process. Soft data was made useful through fuzzy measures. A lumped conceptual model was developed and hard data was used for the model development to study and analyze the runoff variations.
Goswami et al. (2007) [8] for simulating streamflows in ungauged catchments a regeneralized multi model was developed. Seven different models were used for regionalization and three methods were tested for each model that includes discharge, transposition of discharge data of the nearest neighbor and regional pooling of data.
Their results concluded that soil moisture accounting and routing model (SMAR) was the best approach for simulating flows in ungauged catchments.
MIKE 11 NAM model:
Fleming (1975) [7]: the reliability of MIKE11 NAM model was evaluated by Root Mean Square error (RMSE) Method. For observed and simulated values the RMSE tends to zero. This method is considered as a measure of absolute error between observed and computed flows.
Hortness and Berenbrock, (2001) [11]: estimated the method for developing streamflow time series is the use of regional hydrologic equations that predict peak and monthly statistical flows. The US Geological Survey (USGS) has developed regional equations that provide peak annual and monthly average runoff for a stream in the Salmon River drainage.
Shamsudin and Hashim (2002) [24] for hydrological analysis rainfall runoff estimation from a watershed are very important. They studied Layang River using MIKE11 NAM model. Estimation was made for calibration and validation procedures. From 1988-2000 runoff discharges were simulated. Peak value of 20.94m3/s occurred in 1992 and 18.93 m3
Dawson and Wilby (1998) [6], Tokar and Markus (2000) [26], Zhang and Govindaraju (2003) [27] used the /s in 1995 approximately. Efficiency index and Root Mean Square error (RMSE) were used for reliability evaluation whose values are 0.75 and 0.08 respectively.
SCS-CN Method:
Mockus (1949) [20] using the soil data, rainfall and annual temperature estimation of surface runoff for unguaged stations is done.
Andrews (1982) [2] estimated the runoff from soil texture and vegetation cover and developed soil vegetation land use (SVL). Thus relationships of above two studies founded SCS-CN method.
Many research works are done by different persons like McCuen(1982) [16], Hjelmfelt(1991) [10], Hawkins(1993) [9], Bonta(1997) [5], Mishra and Singh (1999) [18] and Mishra et al.(2004) [19].
Patil et al. (2008) [22] used GIS based interface selected sites and developed SCS-CN method.
ANN Method:
Marvin Minsky is the first one to create ANN model.
Minsky and Papert (1969) [17] made a theoretical analysis on ANN and revealed limitations in the field of neural computing.
Kohonen (1987) [15] in the field of neurocomputing, lack of computational resources unsuccessful attempts to develop techniques are the main reasons for the diminishing of research.
180
Copyright © 2011-15. Vandana Publications. All Rights Reserved.
ANN model for developing rainfall runoff model andapplied in the hydrology for forcasting.
III.
METHODOLOGY
MIKE 11 NAM Model:
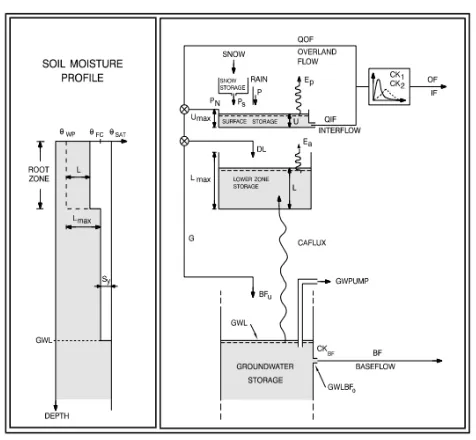
MIKE 11 NAM is a rainfall-runoff model developed by DHI, Denmark. MIKE 11 is used for the simulation of flows transportation of sediments and quality analysis of rivers, channels and other water bodies. NAM is a conceptual rainfall runoff model which explains the different processes of hydrological cycle. NAM is a lumped, deterministic and conceptual rainfall runoff model. Base flow, inter flow and overland flow are the three main levels in the NAM model. NAM is developed mainly by these three flows which is shown in figure. The ground water beneath the earth surface which interacts with the surface water system is taken as base flow component. Without constraining the model, the components of the flow are identified individually. Here unit hydrographs and flood studies are used to find the flow components in surface water/groundwater study. In baseflow components are related to ground water by Master Recession Curve analysis. For NAM the basis data required is meteorological data, discharge data. By this model is developed, calibrated and validated. Meteorological data is nothing but rainfall, temperature, potential evapotranspiration and time series. The simulation of rainfall-runoff process using MIKE11 NAM is done by four different and interrelated storages which are Snow storage, Surface storage, Root zone storage, Groundwater storage.
NAM is a module of MIKE 11 modelling suite. NAM is developed with 9 parameters representing the above four storages. These parameters are used for calibration and validation.
Nam Parameters 1. Umaximum
2. L
- Maximum water content in surface storage
maximum
3. C
- Maximum water content in root zone storage
QOF
4. C
- overland flow runoff coefficient
KIF
5. TOF - overland flow threshold value - time constant for interflow
6. TIF – inland flow threshold value
7. TG – root zone threshold value for groundwater 8. CK1, CK2 – time constants for overland flow and
interflow
9. CKBF – time constant for baseflow.
Figure 1:Representation of NAM Model
Model Calibration and Validation:
Model calibration is a process of systematic adjustment of model parameter values to obtain a new set of parameters which provides the best estimation of observed values. Mostly all the rainfall runoff models should be calibrated to produce consistent new stream flow estimates as there is a strong relationship between physical characteristics of catchment and rainfall runoff model parameters (Beven, 1989) [4]. By calibration accuracy is developed, which internally depends on the flow data. It can be done manually also. In MIKE 11 NAM there is an option called auto calibration where it automatically adjusts the parameters according to the requirement and calibration is done. Auto calibration is much faster, accurate and easy when compared to manual calibration.
Model validation is a process of simulating the runoff over an independent period outside the calibration period using the present calibrated model parameters. If sufficient data is available, model validation can be done for any period. If there is not enough data then shorter periods within the records are taken for validation. After the validation, the output of the model is checked to compare the simulated and observed runoff for better results as well as to know the capability of calibrated model to simulate runoff.
ANN Method:
181
Copyright © 2011-15. Vandana Publications. All Rights Reserved.
So this model is widely used in various aspects of scienceand technology.
The ANN is mainly based on the theory of interconnection and parallel processing architecture of biological neural system. For various computational tasks, the main theme of ANN research focuses on modelling of brain as a computational device. In ANNs there will be a number of processing elements which usually operate parallel and arrange them in regular architecture. The ANN will demonstrate how to learn, recall and generalize the data like a human brain.
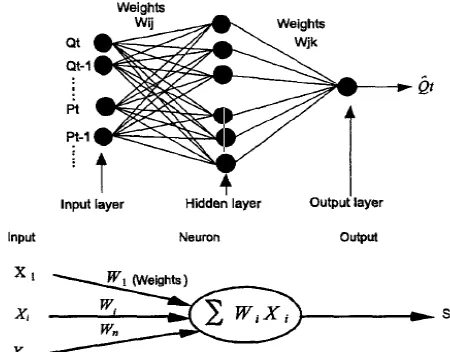
To predict the drainage basin runoff numbers of algorithm methods are available. In the present study, Multilayer Perception (MLP) neural network is used. In this, runoff can be predicted using front and back propagations. MLP has an input layer consisting of nodes representing various input parameters or variables. Then the hidden nodes will be there in hidden layer, whereas output layer consists of output variables. First the input nodes will pass the input signal to the nodes in the hidden layers. But here the signal passed is unprocessed. Depending on the weights of connections the values are distributed to all the nodes in the hidden layer. The connection weights are Wij and Wjk
which are in between the input node and the hidden node. These weights are the links between the neurons in successive layers. With an appropriate and adjustable weight, each neuron in a layer is connected to every single neuron in the next layer by links.
The architecture of neural network and schematic representation of model are shown in figure 2. From node i signal are send to node j in the previous layer. The incoming signal Xi is associated with the weight Wij. The
effective incoming signal Sj
From the incoming signal, signal is passed through nonlinear activation function to obtain an output for a node. Logistic sigmoid fuction is the common thing used for these purposes. The transfer fuction is expressed as
to node j is the weighted sum of all incoming signals.
Figure 2:Architecture of the neural network model. There are two optimal network models which are Statistical and Graphical. In this method both the models are used. Statistical criteria consists of
i. Average square error
ii. Coefficient of determination (R2 iii. Mean absolute relative error.
)
The optimum value for ASE and MARE are equal to 0.0 and for coefficient of determination is 1.0.
For the input and output variables normalization should be done because all the variables won’t be in the same units. By standardizing the variables they can be brought under same units.
SCS Method:
SCS-CN method is mainly used to estimate surface runoff in volume basis from the rainfall depths. The main input data associated with this method are land use, soil cover, moisture conditions for predicting the yield from the basin.
The rainfall runoff relationship to calculate the retention for a simpler storm is expressed by
Where,
F = Actual retention S = Potential maximum Q = Runoff
P = Precipitation
Every parameter is in millimeters. Here S≥F and P≥Q. The volume of runoff mainly depends on the precipitation and storage volumes. Potential retention is constant and maximum for a particular storm because it is the potential value at all best existing conditions.
= + )
182
Copyright © 2011-15. Vandana Publications. All Rights Reserved.
In the above equation the initial abstraction is also takeninto account. Initial abstraction includes infiltration, surface storage and interception. Some experiments are conducted and relationship between Ia and S is developed,
which is given as Ia
Where CN = Curve Number. Standard values are there for the curve number which can be used directly from the SCS Hand Book.
IV.
CONCLUSION
MIKE 11 NAM model extends flow series and generates series of groundwater recharge, so we have realistic estimates of the surface and groundwater availability and its variation in time and space, preferably over many decades. We should make sure that the distribution of water in runoff peaks, interflow, base flow, and corresponding recharge is as accurate as possible. Depending on data availability, we usually calibrate the model over a relatively short period of time, and consequently run it for many decades to generate long series.
In MIKE 11 NAM model data required to efficiently generate the runoff by this model are rainfall, discharge and evaporation and it could be the important tool in water resources management and planning. The model simulates runoff in terms of timing, volume, rate and shape of hydrograph. The developed model can be checked for its capability of predicting runoff for extended time periods. Through NAM model we can obtain consistent, predictive model parameters and this model can be applied for different purposes such as flood forecast, water resources planning and management.
The artificial neural network (ANN) models show good potential to develop hydrological process. Complex problems can be solved using this powerful tool compared to others models. This model requires only rainfall and runoff data to develop a model. Normalization is very important. Better results will be obtained if two or more inputs layers are used than a single input layer. This is a very useful and accurate tool and can be used to solve problems in water resource planning and management.
= 0.3 S
Where S = potential maximum retention. This formula is applied for Indian conditions only.
SCS-CN method requires too many field data. They need topography data, Soil type, Moisture condition, rainfall etc. In most of the cases availability of that much data won’t be there. At that time a lot of assumptions should be made in this model. This model considers the
infiltration losses and soil properties, which makes this a sound model compared to ANN.
As ANN model uses very less data compared to SCS method, ANN can be used for predicting discharge at places where establishing a station is economical. For the learning curve SCS-CN gives better results as it uses only rainfall and CN compared to ANN which uses both rainfall and runoff of previous year’s data. If the user have enough handful data then SCS-CN method is very good to opt. otherwise ANN is good.
REFERENCES
[1] Abdulla, F. A., and D. P. Lettenmaier, “Development of regional parameterestimation equations for a land surface hydrologic model”, J. Hydrol.,197: 230–257, 1997. [2] Andrews, R.G., “The use of relative infiltration indices in computing run off, in Rainfall-Runoff Relationship”, Edited by V.P. Singh, Water Resource Pub., Littleton, Colo.80161, 1982.
[3] Beven, K.J., “On kinematic subsurface stormflow: Predictions with simple kinematic theory for saturated and unsaturated flows”, Water Resour. Res., 18:6, pp. 1627-1633, 1982.
[4] Beven, K.J., “Changing ideas in hydrology: the case of physically based models”. J. Hydrol., 105, 157-172, 1989. [5] Bonta, J. V. “Determination of watershed Curve Number using derived distribution”, J. Irrig. Drain. Eng. ASCE, 123, 28–36, 1997.
[6] Dawson C W and Wilby R, “An artificial neural network approach to rainfall–runoff modelling”, J. Hydrol. Sci. 43 47–66, 1998.
[7] Fleming, G. “Computer simulation techniques in hydrology”, New York: Elsevier. p. 18-53, 1975.
[8] Goswami, M., O’Connor, K.M., Bhattarai, K.P., “Development of regionalization procedures using a multi-model approach for flow simulation in an ungauged catchment”, J. Hydrol. 333, pp. 517-531, 2007.
[9] Hawkins, R. H.: “Asymptotic determination of runoff curve numbers from data”, J. Irrig. Drain. Eng. ASCE, 119, 334–345, 1993.
[10] Hjelmfelt Jr., A. T.: Investigation of curve number procedure, J.Hydraul. Eng. ASCE, 117, 725–737, 1991. [11] Hortness, J.E., and Berenbrock, Charles, “Estimating monthly and annual streamflow statistics at ungauged sites in Idaho”. U.S. Geological Survey Water-Resources Investigations report 0-4093, 36p, 2001.
[12] Horton R.E. “The role of infiltration in the hydrologic cycle. Trans”. Am. Geophys. Union, 14: pp. 446- 460, 1993.
[13] Hsu KL, Gupta HV, Sorooshian S. “Artificial neural network modeling of the rainfall-rainoff process”. Water Resources Research 31(10):2517–2530, 1995.
[14] Julien PY, Moglen GE. “Similarity and length scale for spatially varied overland flow.Water Resources Research”, 26: pp. 1819 – 1832, 1990
183
Copyright © 2011-15. Vandana Publications. All Rights Reserved.
[15] Kohonen.T. “Content-Addressable Memories, secondedition, Springer-Verlag”, New York, NY, 1987.
[16] McCuen.R.H. “A guide of hydrologic analysis using SCS methods”, Prentice-Hall Inc., Eaglewood Cliffs, New Jersey, 1982.
[17] Minsky, M. and S. Papert, Perceptrons, MIT Press, Cambridge, MA, 1969.
[18] Mishra S., Singh V. “Behaviour of SCS method in Ia C- Ia-λ spectrum” pp.112 , 1999.
[19] Mishra, S. K. and Singh, V. P.: Long-term hydrological simulation based on the soil conservation service curve number, Hydrol. Process., 18, 1291–1313, 2004.
[20] Mockus, V. “Estimation of total (and peak rates of) surface runoff for individual storms”. Exhibit A in Appendix B, Interim Survey Report, Grand (Neosho) River Watershed, USDA, Washington DC, 1949.
[21] Parlange J.Y., Rose C.W., Sander G. “Kinematic flow approximation of runoff on a plane: an exact analytical solution”. J. Hydro. pp. 52:171, 1981.
[22] Patil, J. P., Sarangi, A., Singh, O. P., Singh, A. K. and Ahmad, T., “Development of a GIS Interface for Estimation of Runoff from Watersheds, Water Resources Management”,Vol. 22, No. 9, pp 12211239, 2008.
[23] Ponce, V.M., Li, R.-M., Simons, D.B., “Applicability of kinematic and diffusion models. Journal of the Hydraulics Division”, American Society of Civil Engineers 104 (HY3), pp. 353–360, 1978.
[24] Shamsudin S. and Hashim N., “Rainfall-Runoff simulation using MIKE 11 NAM”, Journal of Civil Engineering, vol. 15, No. 2, 1-13, 2002.
[25] Seibert, J. and McDonnell, J., “Multicriteria calibration of conceptual runoff models – the quest for an improved dialog between modeler and experimentalist. Submitted to AGU Book "Advances in Calibration of Watershed Models", in review, 2002.
[26] Tokar A S and Markus M. “Precipitation-runoff modelling using artificial neural networks and conceptual Models”; J. Hydrol. Eng. 5 156–161, 2000.