M E T H O D O L O G Y
Open Access
CopyRighter: a rapid tool for improving the
accuracy of microbial community profiles through
lineage-specific gene copy number correction
Florent E Angly
1*, Paul G Dennis
1,2, Adam Skarshewski
1, Inka Vanwonterghem
1,3, Philip Hugenholtz
1and Gene W Tyson
1,3Abstract
Background:Culture-independent molecular surveys targeting conserved marker genes, most notably 16S rRNA, to assess microbial diversity remain semi-quantitative due to variations in the number of gene copies between species.
Results:Based on 2,900 sequenced reference genomes, we show that 16S rRNA gene copy number (GCN) is strongly linked to microbial phylogenetic taxonomy, potentially under-representing Archaea in amplicon microbial profiles. Using this relationship, we inferred the GCN of all bacterial and archaeal lineages in the Greengenes database within a phylogenetic framework. We created CopyRighter, new software which uses these estimates to correct 16S rRNA amplicon microbial profiles and associated quantitative (q)PCR total abundance. CopyRighter parses microbial profiles and, because GCN estimates are pre-computed for all taxa in the reference taxonomy, rapidly corrects GCN bias. Software validation within silicoandin vitromock communities indicated that GCN correction results in more accurate estimates of microbial relative abundance and improves the agreement between metagenomic and amplicon profiles. Analyses of human-associated and anaerobic digester microbiomes illustrate that correction makes tangible changes to estimates of qPCR total abundance,αandβdiversity, and can significantly change
biological interpretation. For example, human gut microbiomes from twins were reclassified into three rather than two enterotypes after GCN correction.
Conclusions:The CopyRighter bioinformatic tools permits rapid correction of GCN in microbial surveys, resulting in improved estimates of microbial abundance,αandβdiversity.
Background
The advent of high-throughput sequencing has acceler-ated the study of natural microbial communities. Many microbial surveys rely on the sequencing of the small sub-unit rRNA (16S or 18S rRNA) gene. However, the analysis of microbial community structure using this molecular technique is considered semi-quantitative because meth-odological and biological biases can skew estimation of species relative abundance in a community. For example, the choice of DNA extraction method and PCR primers significantly affects operational taxonomic unit (OTU) representation in amplicon community profiles [1-3]. The
most well known biological bias in such profiles is vari-ation in gene copy number (GCN) between species [4]. Note that GCN refers here specifically to the copy number of the 16S rRNA gene, unless otherwise indicated.
GCN variation spans over an order of magnitude, from 1 to 15 in Bacteria, but only up to 5 in Archaea [5]. This order of magnitude range biases both amplicon micro-bial profiles and estimates of total micromicro-bial abundance based on amplicon quantitative PCR (qPCR) data [6]. It could be corrected by weighting read counts for a given species by the inverse of its GCN [2,4,7,8], but informa-tion about GCN is lacking for most microbial species. Since related species have similar GCN [8,9], it is often possible to accurately estimate GCN of an uncultured organism if a closely related sequenced relative exists [9,10], though this means dramatically reducing the
* Correspondence:[email protected] 1
Australian Centre for Ecogenomics/School of Chemistry and Molecular Biosciences/The University of Queensland, St Lucia, Brisbane, QLD 4072, Australia Full list of author information is available at the end of the article
search space to the subset of species with documented GCN. Another possibility is to place reads on a phylo-genetic tree and calculate GCN based on that of se-quenced relatives using phylogenetically independent contrasts (PIC) [9,11,12]. This method has the advantage of not restricting search space, but its implementation is computationally intensive [9]. Ultimately, correcting for GCN bias is still an open problem that no readily avail-able software adequately addresses.
GCN bias limits our ability to produce accurate micro-bial profiles and compromises efforts that rely on rela-tive or absolute abundance, such as the comparison of microbiomes [13], or the development of predictive models [14]. The effect of biases such as GCN may read-ily be apparent through the discrepancies noted in hu-man microbiome studies using different interrogation techniques [15-17], despite the deployment of standard operating procedures [18,19]. Here we introduce Copy-Righter, a new method and easy-to-use software to correct GCN bias in amplicon and qPCR studies. We test this software using mock read datasets and illustrate the effects of correction on human gut and bioreactor-associated microbial communities.
Methods
Variation in gene copy number within species
As a pre-requisite for curating the GCN in the Integrated Microbial Genomes (IMG) system, we investigated the natural variation in GCN between strains of the same spe-cies. We used the curated GCN entries in the Ribosomal RNA Database (rrnDB) [20], which included 153 bacterial and archaeal species containing 2 to 40 strains. The differ-ence (d) between the mean (x) and extremum (maximum or minimum) GCN for these species was calculated and plotted. Except for a single species (Bifidobacterium animalis), this difference generally had the upper bound:
d≤0.105x+ 0.720 (Additional file 1: Figure S1).
Calculation of gene copy number in sequenced genomes
The CGN was inferred from 4,512 sequenced microbial genomes downloaded from IMG version 4.0, released in October 2012. Though GCN is reported by IMG, errors in the GCN records required us to perform manual cur-ation. RNAmmer 1.2 [21] and INFERNAL 1.1rc1 [22] were run independently to estimate the GCN of these genomes. The GCN of a particular genome was consid-ered suspicious if: 1) it was smaller than 1 or larger than 15; 2) the average contig length was smaller than 200 kbp; 3) it was not identical to that predicted by INFERNAL or RNAmmer; or 4) it differed significantly from IMG's or rrnDB's average for this species (>1.2 f(x); Additional file 1: Figure S1). A resolution of suspicious GCN was attempted by ignoring the IMG record and: 1) using the GCN determined by INFERNAL or RNAmmer if it was
consistent with rrnDB; 2) using the value from INFER-NAL or RNAmmer if this genome was not represented in rrnDB but its scaffold length was longer than 200 kbp; and 3) using IMG's 5S or 23S rRNA GCN if it agreed with rrnDB's GCN (when IMG's 16S rRNA GCN was zero). This correction was repeated as neces-sary after removing potentially truncated 16S rRNA genes (<1,220 bp). Suspicious GCNs that could not be corrected were removed from subsequent analyses. This procedure detected 278 suspicious values, 259 of which could be corrected, resulting in GCN values for 2,982 genomes. This analysis can be reproduced using the CopyRighter preprocessing scripts available at http://github.com/fangly/AmpliCopyrighter/releases.
Reconstruction of the gene copy number of microbial taxa
We estimated the GCN of archaeal and bacterial taxa in Greengenes from October 2012 [23]. First, text searches were performed to match each IMG genome name to a Greengenes species name and ID. These IDs were then replaced by the ID of their representative sequence from the Greengenes file of OTUs clustered at 99% identity. This allowed us to place each genome and its GCN on the Greengenes phylogenetic tree (with OTUs clustered at 99% identity) and prune the tree. For genomes match-ing to the same Greengenes OTU, an average of their GCN was calculated. Estimates of GCN for each ances-tral node in the tree were calculated using the PIC method [11], which essentially combines the GCN of se-quenced daughter species on the tree linearly based on their phylogenetic distance. However, several nodes in a tree can belong to the same taxon. To accommodate for this, the GCN of a taxon was calculated as the weighted average of the GCN for the corresponding nodes, with the weight being proportional to the number of nodes making up the GCN estimate. The results were GCN es-timates plotted from species to phylum level on the Greengenes taxonomy. This method was implemented using the Bio::Phylo Perl modules [24] and Newick Util-ities [25], and can be run using the scripts available from http://github.com/fangly/AmpliCopyrighter/releases.
Phylogenetic and taxonomic signal of microbial gene copy number
from a likelihood ratio test against the null hypothesis thatλis 0. This statistic was calculated using the Green-genes taxonomic tree constructed above and repeated using the Greengenes phylogenetic tree.
Estimation of microbial gene copy number for unsequenced species
The PIC method was combined with rerooting [12] to estimate the GCN of unsequenced species (Figure 1A).
These estimates were then mapped on the Greengenes taxonomy. Specifically, when several tree nodes mapped to a single taxon, estimated GCNs were removed if em-pirical values were present, and the mean of the remaining values was calculated. This intensive compu-tation was performed for all 177,814 Greengenes records on the tree on 48 to 64 core high-performance com-puters, resulting in a table of pre-computed GCNs for all Greengenes OTUs and taxa. The scripts written for
this step used the Newick Utilities [25] for quick process-ing of the Newick-formatted tree and can be downloaded from http://github.com/fangly/AmpliCopyrighter/releases.
Correction algorithm
We implemented a Perl program called CopyRighter, that uses modules from Bio-Community (http://search.cpan. org/dist/Bio-Community/) [30] and systematically corrects 16S rRNA gene amplicon datasets by taking into ac-count the varying GCN in microbial species (Figure 1C). CopyRighter is available under the GNU General Public Licence v3.0 at http://github.com/fangly/AmpliCopyrigh-ter/releases. CopyRighter reads OTU tables (in tabular, biom, QIIME, GAAS or UniFrac format) that contain Greengenes taxonomic assignments. For each OTU, CopyRighter looks up its estimated GCN from the pre-computed table described above and weights the number of 16S rRNA gene amplicon reads of this OTU by the inverse of its estimated GCN to obtain its relative abundance (as a percentage): ri¼cgi
i 100
XS
j
cj
gj
, where riis
the relative abundance of OTUi,ciits count,giits GCN
and S is the community richness. OTUs without any taxonomic assignment are assigned a GCN equal to the average value in the community to prevent them from affecting the relative abundance of other OTUs. The re-sults are saved in a new account file in the same format as the input file and the average GCN for each community is returned. Provided qPCR results in a tab-delimited text format, CopyRighter corrects qPCR numbers by dividing them by the GCN averages in the corresponding communities.
Validation usingin silicomock communities
To assess the accuracy of CopyRighter, we simulated 90 microbial communities, divided into low, medium and high richness groups (10,100 and 1,000 species, respect-ively) using Grinder [31]. All communities were de-signed with a power law rank-abundance structure [32], the most abundant species representing 20% of the com-munity (Additional file 2: Figure S2). For each of the 30 replicates per group, Grinder took IMG genomes and assigned them a random abundance rank. These artificial communities were sequenced in silico by Grinder using the Roche-454 GS-FLX Ti technology routinely used in microbial surveys. Each community was sequenced in silico twice, once using the 16S rRNA gene amplicon ap-proach (universal primers pyroLSSU926F AAACTYAA AKGAATTGRCGG and pyrolSSU1392R ACGGGCGGT GTGTRC, targeting gene hypervariable regions V6-V8), and once using a shotgun metagenomic approach.
Validation usingin vitromock datasets
To further validate CopyRighter, we used published cell-based and DNA-cell-basedin vitromock datasets. The mock 16S rRNA gene amplicon dataset from Yuan and col-leagues [2] was produced by pooling an equal number of cells from 11 microbial species commonly found in the human body, prior to DNA extraction and amplicon se-quencing with universal primers specific to the V1-V2 hypervariable regions (cell-based mock). We also used a V3-V5 16S rRNA gene amplicon dataset from the Hu-man Microbiome Project (accession SRR074387) [18,33], which was generated by extracting the DNA from 22 mi-crobial species separately, and pooling their genomic DNA in the ratio needed to obtain an equal number of 16S rRNA gene copies for each species (DNA-based mock). The cell-based and DNA-based in vitro mock datasets were sequenced using a Roche-454 GS-FLX Ti sequencer [2,33]. We processed these data bioinformati-cally using the 16S rRNA gene amplicon protocol de-scribed below.
Processing of 16S rRNA gene amplicon read datasets
An OTU clustering and sequence-similarity taxonomic annotation approach was used to process 16S rRNA gene amplicon datasets. Reads from distinct samples were first separated according to their multiplex identi-fier using QIIME [34] and their 454 sequencing errors were corrected using Acacia [35]. Sequences were trimmed to recover the mode of the length distribution (that is, 300 bp generally). CD-HIT-OTU [36] was used to remove chimeras and cluster reads into 97% identity OTUs, which were then given a taxonomic affiliation by performing a BLASTN search [37] against the Green-genes database. The resulting OTU table was rarefied to 1,000 reads (when possible) using at least 100 repetitions, and summarized at the genus level using Bio-Community scripts.
Post-processing of mock datasets
data were Hellinger-transformed [39] normalized to 100% and the euclidean distance between the resulting sample community composition and the expected species relative abundance was calculated for each sample. A unilateral exact Mann–Whitney test was performed (wilcox.test function in R) to estimate if the distances between cor-rected and expected community profiles were significantly lower than the distances between non-corrected and ex-pected profiles.
Re-analysis of twin gut cohort microbiomes
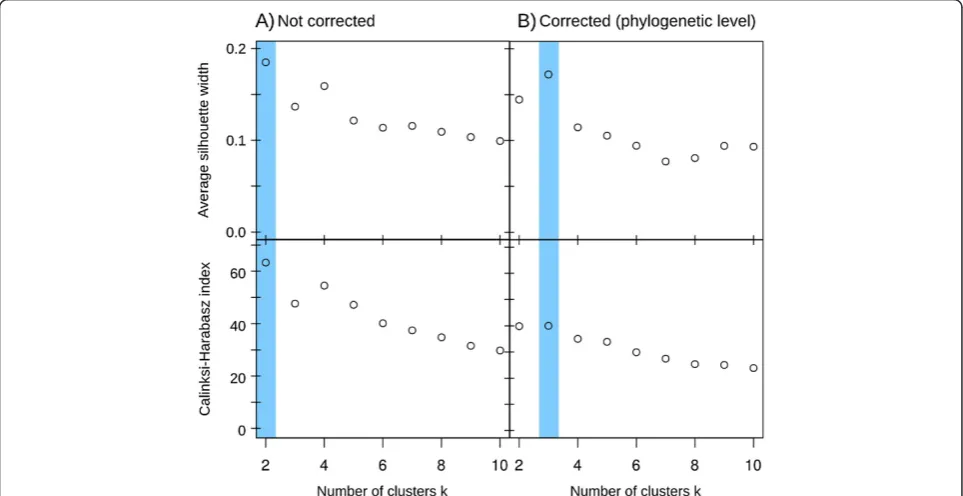
A cohort of twins and their mother has been previously followed using V1-V2 16S rRNA gene amplicon pyrose-quencing to investigate the composition of their gut microbiota [40,41]. We re-analyzed the 280 microbiomes with at least 1,000 reads through the pipeline described above, using a trimming threshold of 200 bp, and cor-rected for GCN using CopyRighter at the phylogenetic level. A first analysis consisted of summarizing the mi-crobial data at the phylum level and calculating the Berger-Parker αdiversity index in each sample. Starting with the samples with the most similar Berger-Parker index, a bilateral Mann–Whitney test was run with an increasing number of samples to determine the fraction of non-significantly different samples before and after correction. A second analysis was performed to analyze the effect of correction on sampleβdiversity. We classi-fied the data into enterotypes in R, as described previously [15]. The Bray-Curtis distance was calculated using the Vegan library [42], partition around medoids clustering was performed using the FPC library and the average sil-houette width and Calinski-Harabasz index were re-corded. In addition, the indicator value of each genus was calculated to identify potential indicator genera using the R Indicspecies library [43].
Analysis of microbial abundance in anaerobic digesters
Replicate bioreactors were operated for 362 days to ob-tain information about the total microbial abundance (16S rRNA qPCR) and composition of microbial com-munities (16S rRNA gene amplicon pyrosequencing reads) (primers pyroLSSU926F and pyrolSSU1392R, tar-geting region V6-V8) involved in the anaerobic digestion process (Additional file 3: Supplementary Protocol). The 16S rRNA gene amplicon reads (deposited under acces-sion number SRR1145444) were processed using the bio-informatic pipeline described above, using 800 reads for the rarefaction step, and corrected for GCN with Copy-Righter at the phylogenetic level to obtain estimates of relative abundance. qPCR results were also corrected by CopyRighter to compare the microbial abundance (num-ber of genomes/ml of extracted reactor fluid) between sampling dates. The results were summarized at the order level and plotted. Unilateral paired t-tests were
performed (t.test function in R) to determine if the total abundance estimates from day 362 were lower than those for day 27.
Results
Gene copy number taxonomic signal
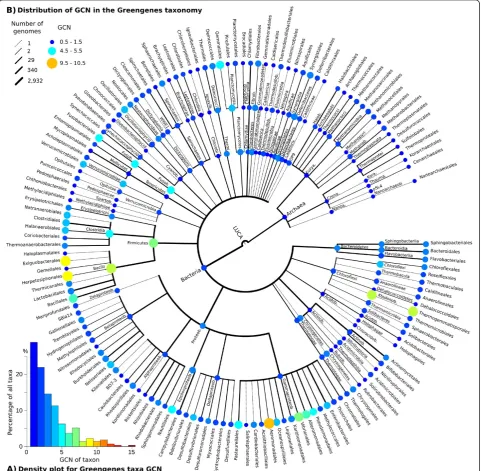
Greengenes provides a phylogenetic tree based on bac-terial and archaeal rRNA sequences, and a taxonomic system derived from this tree [23]. We calculated the GCN from over 2,900 sequenced microbial genomes from the IMG database [44] using RNAmmer and IN-FERNAL, and averaged these values for each of the 274 Greengenes taxa represented by multiple genomes. GCN ranged from 1 for most Greengenes taxa (28.8%) to 15 copies for a single species, Photobacterium profundum
(Figure 2A).
Using the PIC method for reconstruction of ancestral traits [11], we estimated the GCN for all Greengenes taxa (Figure 2B). Variations between taxa were present at different taxonomic levels. For example, the estimated GCN for the Firmicutes (6.81) and Fusobacteria (4.81) were well above that of other phyla. Similarly, at the domain level, Bacteria (2.40) had a higher GCN than Archaea (1.46).
We calculated the λ statistic of phylogenetic signal [29] for empirical GCN using the Greengenes phylogen-etic tree and found that GCN is correlated with phyl-ogeny (λ= 0.844, P= 2.13e-176). This association was also apparent when using the Greengenes taxonomy which is a simplified and less resolved representation of the phylogeny (λ= 0.546, P= 2.03e-38). This suggests that GCN can be reliably inferred from microbial phyl-ogeny and tree-based taxonomy.
CopyRighter
We have implemented a program called CopyRighter that takes GCN into account when estimating OTU relative abundance. CopyRighter is freely available under the GNU General Public License v3.0 from http://github.com/fangly/ AmpliCopyrighter/releases. Exploiting the strong phylogen-etic and taxonomic signal in GCN, we used PIC with rerooting [12] to compute estimates of GCN for the 1.08 million records in Greengenes based on publicly available GCN information from 2,900 reference genomes (Figure 1A) (data available at http://github.com/fangly/ AmpliCopyrighter/releases). CopyRighter corrects the GCN bias for each OTU in a microbial dataset using these esti-mates (Figure 1C). Additionally, given qPCR assay data, CopyRighter divides the number of 16S rRNA gene tem-plates [45] by the calculated average GCN in the commu-nity to estimate total microbial abundance in a sample.
counts, in tabular, biom, QIIME, GAAS or UniFrac format) containing Greengenes taxonomic assignments (Figure 1B). When correcting, CopyRighter can use two methods to find the GCN of an OTU: 1) based on the location of its assigned taxon on the Greengenes phylogenetic tree (iden-tified by its taxon ID) (phylogenetic-level correction); or 2) based on the Greengenes taxonomic string of this taxon (taxonomic-level correction). The output of CopyRighter is a corrected file expressing OTU relative abundance (as a percentage), GCN averages for each community and op-tional corrected qPCR results. For ease-of-use, we created a Galaxy front-end [46], available at http://toolshed.g2.bx. psu.edu/view/fangly/copyrighter.
Software validation
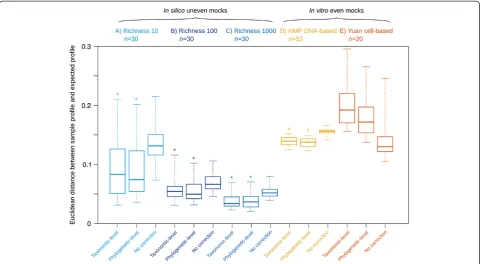
To assess the accuracy of CopyRighter, we generated 90 microbial communitiesin silico and simulated their 16S rRNA gene amplicon and metagenomic shotgun sequen-cing using Grinder [31]. The distances between observed and expected amplicon microbial profiles were signifi-cantly smaller for GCN-corrected than for uncorrected samples (Figure 3A-C). Phylogenetic-level correction was generally slightly more accurate than taxonomic-level correction. On average, distance decreased with the richness of the mock communities tested, from 10 to 1,000 species (Figure 3A-C). However, CopyRighter cor-rection was beneficial across this entire richness range, Figure 2Estimated gene copy number (GCN) of 274 Greengenes taxa represented by over 2,900 genomes. (A)Density plot of GCN.(B)
with a smaller distance for corrected than uncorrected profiles (Figure 3A-C).
To complement the results fromin silicomock commu-nities, more realistic but low richnessin vitromock com-munities were corrected in the same manner (Figure 3D, E). Again, CopyRighter correction resulted in smaller dis-tances between observed and expected profiles for the DNA-based mock (Figure 3D), except in the case of the cell-based mock community (Figure 3E).
Assuming that GCN correction is effective, we would expect microbial profiles obtained from different methods (for example, amplicon and metagenomic sequencing) to be more similar after CopyRighter correction. When com-paring the profile of 16S rRNA in silico mocks to the whole genome-based profile of the corresponding metage-nomic mock, we noted that GCN-corrected profiles had a significantly smaller distance than non-corrected profiles (Additional file 4: Figure S3).
Correction of human gut microbial profiles
To evaluate the impact of CopyRighter on the interpret-ation of empirical datasets, we corrected GCN in human gut microbiome profiles from lean and obese twins and their mothers (153 individuals) [40,41]. The correction led to phylum-level changes in relative abundance, with an overall decrease of Bacteroidetes from a median of 31.1 to 21.7% and an increase of Firmicutes from a
median of 67.1 to 76.0% (Figure 4A and B). Microbiome
α diversity was measured using the Berger-Parker index (that is, the relative abundance of the most abundant phylum). The difference in Berger-Parker index between corrected and non-corrected samples ranged from 0 to 23.3% (Figure 4C). Up to 53.6% of the samples did not have a statistically different Berger-Parker index (bilateral Mann–Whitney test,P< 0.05; Additional file 5: Figure S4). We calculated the Bray-Curtis distances between all gut microbiomes and clustered them using partition around medoid to determine enterotypes, as previously described [15]. The microbiomes initially clustered into two entero-types (Figure 5A), but correcting for GCN bias indicates that the data were better partitioned into three entero-types (Figure 5B; Additional file 6: Figure S5B). As a con-sequence, 23.9% of the samples would have been misclassified without GCN correction (Additional file 6: Figure S5A,B). In terms of β diversity (Additional file 6: Figure S5C), sample separation was driven mainly by the family Bacteroidaceae (genus Bacteroides) for enterotype A', the families Lachnospiraceae (genera Ruminococcus,
Roseburia,BlautiaandCoprococcus) and Coprobacillaceae for enterotype B', and the families Prevotellaceae (genus
Prevotella) and Ruminococcaceae (genera Ruminococcus,
Correction of absolute microbial abundance
To assess the effects of GCN correction on the estimated absolute abundance of microorganisms, we analyzed sam-ples from two replicate anaerobic digester bioreactors. For each time point, total abundance was inferred from the
number of 16S rRNA gene templates determined by qPCR and microbial profiles were generated based on 16S rRNA gene amplicon reads. Copyrighter reported an average GCN of 2.69 for the samples collected on day 27, and 1.61 for the day 362 samples. This was primarily due to a
A)
B)
C)
Figure 4Phylum-level effects of gene copy number bias correction in 280 human gut microbiomes. (A)Uncorrected,(B)after
phylogenetic-level correction, and(C)difference in Berger-Parkerαdiversity index between the corrected and non-corrected samples. Samples in all panels were sorted by increasing Berger-Parker difference.
change in the ratio of Bacteria (mostly represented by Clostridiales) to Archaea (mostly Methanosarcinales) over the two time points; 2.75 to 1.11 in uncorrected data, and from 2.33 to 0.460 in corrected data. Uncorrected qPCR results (Figure 6A) indicated a significant biomass de-crease from 13.3 to 7.72 × 10⁹genomes/ml extracted re-actor fluid during the operation of the rere-actors (paired t-test,P= 0.0288), while corrected numbers (Figure 6B) were not different (paired t-test, P= 0.413), averaging 4.86 × 10⁹genomes/ml over the two time points.
Discussion
Gene copy number is linked to tree-based taxonomy
We determined the 16S rRNA GCN of over 2,900 se-quenced genomes and assigned these values to 274 unique taxonomic locations in the Greengenes phylo-genetic framework (Figure 2A). We found that one-third of these taxa have a GCN of 1 (that is, a single 16S rRNA gene), in apparent contrast with previous reports of a modal GCN of two gene copies per genome [5,10]. This difference between GCN per taxon (that is, phylo-genetically normalized) and per genome reflects that a limited number of high-GCN taxa of medical or biotech-nological interest have been the subject of extensive re-search and sequenced many times. For example, IMG contains 116, 78 and 47 genomes of Escherichia coli,
Staphylococcus aureusand Bacillus aureus, respectively, species that all have a GCN higher than 5.
We identified large differences in GCN between taxa at different taxonomic levels (Figure 2B). For example, bacterial taxa appear to have an additional 16S rRNA gene on average compared to archaeal taxa. Hence the relative abundance of Archaea is possibly systematically
underestimated in amplicon surveys, compared to that of Bacteria, a problem that may be confounded by some primer sets [47].
Based on theλstatistic of phylogenetic signal, we deter-mined that the distribution of GCN in microbial genomes is not random. The value ofλtypically varies from 0 for a lack of signal, to 1 for a strong signal. GCN was strongly correlated with the microbial phylogeny represented by the Greengenes phylogenetic tree (λ= 0.844), consistent with previous evidence for a phylogenetic signal in GCN [9]. GCN was also correlated with the Greengenes tax-onomy (λ= 0.546), because this taxonomy is derived from the Greengenes phylogeny. However, the signal was weaker in the taxonomy than in the phylogeny because each Greengenes taxon may encompass multiple nodes of the phylogenetic tree and is thus less precise. Neverthe-less, the presence of GCN signal in microbial phylogeny and taxonomy makes it possible to infer GCN for organ-isms lacking a genome sequence.
Copyrighter is a new tool for gene copy number bias correction
GCN varies by over an order of magnitude between microbial species and, thus, a one-to-one relationship between a 16S rRNA gene amplicon read and a micro-bial cell cannot be assumed. Not accounting for GCN differences between species can lead to misinterpretation of 16S rRNA gene amplicon profiles [48]. We have introduced CopyRighter (Figure 1), a software tool that aims at making amplicon surveys more quantitative by account-ing for GCN bias. Our software is accurate because it uses phylogenetically-informed GCN, and is fast because we pre-compute these estimates for the entire microbial
tree using the PIC framework [12]. The approach and pre-computation removes the need for pre-computationally inten-sive processes such as inserting sequences in a tree [9] and, as a result, is extremely fast. For example, an OTU table containing 1,000 OTUs distributed across 10 com-munities only takes 14 seconds to process on a personal computer (with an Intel U7300 processor running at 1.30 GHz).
CopyRighter improves estimates of relative abundance
CopyRighter was validated with 90in silicomock ampli-con datasets and produced microbial profiles closer to the expected profiles than without correction (Figure 3), and also more congruent with simulated metagenomes (Additional file 4: Figure S3). These observations held true regardless of community richness, even though ac-curacy was seemingly decreased at lower richness levels, reflecting the fact that any potential error when estimat-ing the relative abundance of a species has a larger effect on microbial profiles that include only few species, com-pared to richer communities. Correction performed at the phylogenetic level appeared slightly more accurate than at the taxonomic level, presumably a result of the higher GCN signal in the phylogeny compared to the taxonomy. GCN correction also appeared beneficial when validating CopyRighter with published DNA-based
in vitro mock communities, but not with the cell-based
in vitromock community. Since correction was effective on thein silico and DNA-based in vitromocks, this re-sult does not invalidate the performance of CopyRighter. Instead, this shows that experimental procedures such as DNA extraction may produce a pool of genomic DNA that bears little resemblance to the original community [1,2]. In some cases, these experimental biases may be of higher magnitude than that introduced by GCN bias, such that GCN correction may exacerbate observed differ-ences between observed and expected community profiles and appear ineffective (Additional file 7: Figure S6).
Gene copy number correction influencesαandβ diversity
To evaluate the effects of CopyRighter on empirical datasets, we re-analyzed human gut microbiomes from a cohort of twins. Firmicutes and Bacteroidetes were numerically dominant, both in corrected and uncor-rected profiles (Figure 4A and B), as confirmed in previ-ous microarray and metagenomic studies [13,49]. GCN correction did, however, create large phylum-level shifts in favor of the Firmicutes in many of these datasets, resulting in significantly different Berger-Parkerα diver-sity estimates for about half the samples (Additional file 5: Figure S4). These shifts appear counter-intuitive given the higher average GCN of the Firmicutes relative to the
Bacteroidetes (6.81 versus 2.62) but can be explained by the GCN values of individual high abundance phylo-types in the samples, which are atypical for their phyla (Additional file 8: Figure S7). Considering that the ratio of bacterial phyla in the gut is linked with disorders such as obesity [50], diabetes [51] andClostridium diffi-cile infections [52], it is important to correct for GCN to fully understand the implications of the microbiota in health and disease.
We also noted that GCN correction did not have a uni-form effect on related gut microbiome samples, with the Berger-Parker index changing anywhere from 0 to 23.3% between uncorrected and corrected samples (Figure 4C). In other words, even though all samples came from the same type of habitat, GCN correction made no difference for some samples and large phylum-level differences for others. Therefore it should not be assumed that the effects of GCN correction can be inferred based on habitat type; rather samples should be individually corrected to allow more robust biological interpretation.
Gut microbiomes have been classified into enterotypes based on their prevalent microbial species [13]. Our enter-otype classification results were generally consistent with existing studies of the distal gut, defining two main Bac-teroides and Prevotella-dominated enterotypes [15,53]. Considering that the ordination of human microbiomes can result in smooth gradients [54], the exact number of enterotypes is contested [13,15]. Though our analysis was limited to a single cohort, the microbial profiles corrected by CopyRighter support the existence of a third entero-type based around Ruminococcus, in accordance with a previous metagenomic study [13]. Thus, not accounting for GCN has important implications and may lead to in-correct enterotype classification.
Gene copy number correction affects absolute microbial abundance estimates
To improve absolute microbial abundance estimates, CopyRighter can be used to correct amplicon qPCR re-sults that have a corresponding community profile. In uncorrected 16S rRNA qPCR results from anaerobic di-gesters, the biomass seemed to be halved over 355 days (Figure 6A). However, corrected numbers indicate that total biomass was not significantly different between the two time points and the ratio of major functional groups was also misrepresented (Figure 6B). This may have important implications for interpreting community dynamics and function.
Advantages and limitations of CopyRighter
CopyRighter approach, we have pre-computed GCN esti-mates for over a million Greengenes records, an advance made possible by leveraging publicly available genomes, phylogenetic trees and taxonomic systems within the con-text of the PIC framework. However, there are still many phyla without genome representation, especially candidate phyla [55], for which GCN estimates are likely not as ac-curate as those from well-represented phyla. Further, not all GCN values reported by IMG are correct, phylogenetic trees are affected by lack of representation and uncertainty [56], and the Greengenes taxonomy does not always in-clude species information in its taxonomic strings. These drawbacks limit the precision of our pre-computed GCN estimates, but with further database growth and expert curation in time, updates to CopyRighter data files will make these problems less significant.
CopyRighter correction represents the last step of many experimental and bioinformatic steps to estimate micro-bial community composition. Community profiles can be seriously compromised by experimental procedures such as DNA extraction [1,2] (Figure 3E; Additional file 7: Figure S6), whole genome multiple displacement amplifi-cation [57,58], PCR [3,47] and sequencing [35,59]. In some instances, these upstream issues may be more problematic than GCN bias. Despite these potential limitations, our val-idation using mock datasets demonstrate that Copyrighter-based GCN correction is effective in improving the fidelity of community profiles.
While Copyrighter brings us a step closer towards esti-mating accurate OTU relative abundance in environmen-tal surveys, it does not address genome copy number bias. Genome copy number varies during the natural bacterial life cycle, doubling during replication, and some endo-symbiotic and thermophilic bacteria exhibit extreme polyploidy or large genome copy variations [60-62]. The magnitude and effects of genome copy number bias on biological interpretations are largely unknown and will be challenging to address in a systematic fashion.
Conclusions
CopyRighter is a user-friendly open source software tool that enables rapid correction of GCN bias thereby im-proving the accuracy of amplicon-based community profiling and microbial biomass estimations. In addition, the average community GCN calculated by CopyRighter may provide insights into environmental conditions since GCN reflects the ecological strategies of microbial species, with higher average GCN in faster growing communities, in locations where resources are not limiting [63,64].
As illustrated throughout the present study, correcting for GCN is important since it can significantly alter esti-mated total microbial abundance,αandβdiversity and, ultimately, biological interpretation. One should expect
the effects of CopyRighter correction to be more pro-nounced when many species in a community differ strongly in GCN; for example, when a microbial profile contains many Archaea (GCN of 1.46 on average) and Firmicutes (GCN of 6.81). However, communities often contain tens to thousands of species, making prediction of the effects of correction non-trivial. In practice, the consequences of correction are different for every sam-ple, even for samples originating from the same habitat, as seen in the survey of the twin cohort microbiota. For-tunately, CopyRighter is fast and compatible with popu-lar taxonomy-based analysis workflows. We recommend running Copyrighter systematically on every microbial sample, if possible using phylogenetic-level rather than taxonomic-level correction, to obtain the highest accur-acy possible.
We have produced freely available data files of the phylogenetically-based estimates of GCN for all OTUs and taxa in the Greengenes database. We anticipate that the CopyRighter methodology and software described here will be extended to cover GCN in other taxonomies (for example, Silva [65]), or other variable copy number genes or intergenic marker regions, or different genome characteristics altogether. For example, given appropri-ate pre-computed estimappropri-ates (Figure 1A), CopyRighter could correct the GC percent bias introduced by se-quencing microbial samples [66,67], genome length bias in metagenome profiles [68], or improve fungal surveys, in which the internal transcribed spacer sequenced can vary by two orders of magnitude [69].
Additional files
Additional file 1: Figure S1.Variation in gene copy number between strains of the same species in the Ribosomal RNA Database. The size of the bubbles indicates the number of species represented, from 1 to 23.
Additional file 2: Figure S2.Rank-abundance plot of the low, medium and high richnessin silicomock communities generated with Grinder.
Additional file 3:Supplementary protocol: operating and sampling anaerobic digesters.
Additional file 4: Figure S3.Boxplot of the agreement betweenin silico16S rRNA gene amplicon and metagenomic mock datasets with and without Copyrighter correction. The boxes represent the minimum, maximum, median and interquartile range; the lower the distance, the better the agreement. Corrected profiles with a significantly lower distance than the corresponding uncorrected profiles (unilateral exact Mann–Whitney test,P< 0.05) are marked with a star.
Additional file 5: Figure S4.Pvalues from bilateral Mann–Whitney tests performed on the Berger-Parker index from corrected and non-corrected twin microbiomes in function of the number of samples used. The samples were sorted by increasing Berger-Parker difference.
Additional file 6: Figure S5.Enterotype classification of human gut microbiomes of a twin cohort at the genus level.(A)Before correction,
(B)after phylogenetic-level correction, and(C)taxa driving the variance between samples.
Additional file 7: Figure S6.Ordination plots illustrating how a large bias can make the correction of another bias appear ineffective.(A)
extraction, and the smaller one gene copy number variation between species.
Additional file 8: Figure S7.Genus-level heatmap of the human gut microbiomes before and after gene copy number (GCN) correction. Non-corrected and corrected profiles represent the average of the 280 samples. Numbers indicate the GCN of the various taxa identified in the samples and bolded text emphasizes abundant taxa (over 5% in the non-corrected data).
Abbreviations
bp:base pair; GCN: gene copy number; IMG: Integrated Microbial Genomes; OTU: operational taxonomic unit; PCR: polymerase chain reaction; PIC: phylogenetically independent contrasts; qPCR: quantitative polymerase chain reaction; rrnDB: Ribosomal RNA Database; rRNA: ribosomal RNA.
Competing interests
The authors declare that they have no conflict of interest.
Authors’contributions
FEA wrote the software, designed the study, performed data analysis and redacted the manuscript. PGD designed the study and performed data analysis. AS wrote the software. IV operated bioreactors and processed bioreactor samples. PH and GWT designed the study and redacted the manuscript. All authors read and approved the final manuscript.
Acknowledgements
This study was supported by the Australian Research Council's Discovery Early Career Research Award to FEA (DE120101213), Discovery Outstanding Researcher Award to PH (DP120103498), and Queen Elizabeth II fellowship to GWT (DP1093175). IV acknowledges support by the University of Queensland International Scholarship.
The authors would like to thank Nancy Lachner and Serene Low from the Australian Centre for Ecogenomics for their help with the RT-PCR, and Fiona May for the 16S rRNA gene amplicon pyrosequencing. We are also grateful to Dr Dana Willner for useful discussions, Alejandro Reyes for facilitating access to the gut microbiomes of the twin cohort, and the following colleagues for testing CopyRighter: Mary Ellen Costello (Diamantina Institute, The University of Queensland), Dr Rosalind Gilbert (Department of
Agriculture, Fisheries and Forestry, The University of Queensland) and Yun Kit Yeoh (Australian Centre for Ecogenomics, The University of Queensland).
Author details
1Australian Centre for Ecogenomics/School of Chemistry and Molecular
Biosciences/The University of Queensland, St Lucia, Brisbane, QLD 4072, Australia.2Current affiliation: School of Agriculture and Food Sciences, Level 3, Hartley Teakle Building (83), The University of Queensland, St Lucia, Brisbane, QLD 4072, Australia.3Advanced Water Management Center, Level 4, Gehrmann Laboratories Building (60), The University of Queensland, St Lucia, Brisbane, QLD 4072, Australia.
Received: 22 November 2013 Accepted: 17 February 2014 Published: 7 April 2014
References
1. Morgan JL, Darling AE, Eisen JA:Metagenomic sequencing of an in vitro-simulated microbial community.PLoS ONE2010,5:e10209.
2. Yuan S, Cohen DB, Ravel J, Abdo Z, Forney LJ:Evaluation of methods for the extraction and purification of DNA from the human microbiome.
PLoS One2012,7:e33865.
3. Pinto AJ, Raskin L:PCR biases distort bacterial and archaeal community structure in pyrosequencing datasets.PLoS One2012,7:e43093. 4. Farrelly V, Rainey FA, Stackebrandt E:Effect of genome size and rrn gene
copy number on PCR amplification of 16S rRNA genes from a mixture of bacterial species.Appl Environ Microbiol1995,61:2798–2801.
5. Acinas SG, Marcelino LA, Klepac-Ceraj V, Polz MF:Divergence and redundancy of 16S rRNA sequences in genomes with multiple rrn operons.J Bacteriol2004,186:2629–2635.
6. Ludwig W, Schleifer K-H:How quantitative is quantitative PCR with respect to cell counts?Syst Appl Microbiol2000,23:556–562.
7. Fogel GB, Collins CR, Li J, Brunk CF:Prokaryotic genome size and SSU rDNA copy number: estimation of microbial relative abundance from a mixed population.Microb Ecol1999,38:93–113.
8. Rastogi R, Wu M, DasGupta I, Fox G:Visualization of ribosomal RNA operon copy number distribution.BMC Microbiol2009,9:208. 9. Kembel SW, Wu M, Eisen JA, Green JL:Incorporating 16S gene copy
number information improves estimates of microbial diversity and abundance.PLoS Comput Biol2012,8:e1002743.
10. Větrovský T, Baldrian P:The variability of the 16S rRNA gene in bacterial genomes and its consequences for bacterial community analyses.PLoS One2013,8:e57923.
11. Felsenstein J:Phylogenies and the comparative method.Am Nat1985,125:1–15. 12. Garland T, Ives AR:Using the past to predict the present: confidence
intervals for regression equations in phylogenetic comparative methods.
Am Nat2000,155:346–364.
13. Arumugam M, Raes J, Pelletier E, Le Paslier D, Yamada T, Mende DR, Fernandes GR, Tap J, Bruls T, Batto J-M, Bertalan M, Borruel N, Casellas F, Fernandez L, Gautier L, Hansen T, Hattori M, Hayashi T, Kleerebezem M, Kurokawa K, Leclerc M, Levenez F, Manichanh C, Nielsen HB, Nielsen T, Pons N, Poulain J, Qin J, Sicheritz-Ponten T, Tims S,et al:Enterotypes of the human gut microbiome.Nature2011,473:174–180.
14. Larsen PE, Field D, Gilbert JA:Predicting bacterial community assemblages using an artificial neural network approach.Nat Methods 2012,9:621–625.
15. Koren O, Knights D, Gonzalez A, Waldron L, Segata N, Knight R, Huttenhower C, Ley RE:A guide to enterotypes across the human body: meta-analysis of microbial community structures in human microbiome datasets.PLoS Comput Biol2013,9:e1002863.
16. Rigsbee L, Agans R, Foy B, Paliy O:Optimizing the analysis of human intestinal microbiota with phylogenetic microarrays.FEMS Microbiol Ecol 2011,75:332–342.
17. Shah N, Tang H, Doak TG, Ye Y:Comparing bacterial communities inferred from 16S rRNA gene sequencing and shotgun metagenomics.Pac Symp Biocomput2011:165–176.
18. Peterson J, Garges S, Giovanni M, McInnes P, Wang L, Schloss JA, Bonazzi V, McEwen JE, Wetterstrand KA, Deal C, Baker CC, Francesco VD, Howcroft TK, Karp RW, Lunsford RD, Wellington CR, Belachew T, Wright M, Giblin C, David H, Mills M, Salomon R, Mullins C, Akolkar B, Begg L, Davis C, Grandison L, Humble M, Khalsa J, Little AR,et al:The NIH human microbiome project.
Genome Res2009,19:2317–2323.
19. Hamady M, Knight R:Microbial community profiling for human microbiome projects: tools, techniques, and challenges.Genome Res 2009,19:1141–1152.
20. Lee ZM-P, Bussema C, Schmidt TM:rrnDB: documenting the number of rRNA and tRNA genes in bacteria and archaea.Nucleic Acids Res2009,
37(Database):D489–D493.
21. Lagesen K, Hallin P, Rødland EA, Stærfeldt H-H, Rognes T, Ussery DW:
RNAmmer: consistent and rapid annotation of ribosomal RNA genes.
Nucleic Acids Res2007,35:3100–3108.
22. Nawrocki EP, Kolbe DL, Eddy SR:Infernal 1.0: inference of RNA alignments.
Bioinformatics2009,25:1335–1337.
23. McDonald D, Price MN, Goodrich J, Nawrocki EP, DeSantis TZ, Probst A, Andersen GL, Knight R, Hugenholtz P:An improved Greengenes taxonomy with explicit ranks for ecological and evolutionary analyses of bacteria and archaea.ISME J2012,6:610–618.
24. Vos RA, Caravas J, Hartmann K, Jensen MA, Miller C:Bio::Phylo-phyloinformatic analysis using perl.BMC Bioinformatics2011,12:63.
25. Junier T, Zdobnov EM:The Newick utilities: high-throughput phylogenetic tree processing in the Unix shell.Bioinformatics2010,
26:1669–1670.
26. Paradis E, Claude J, Strimmer K:APE: Analyses of phylogenetics and evolution in R language.Bioinformatics2004,20:289–290.
27. Kembel SW, Cowan PD, Helmus MR, Cornwell WK, Morlon H, Ackerly DD, Blomberg SP, Webb CO:Picante: R tools for integrating phylogenies and ecology.Bioinformatics2010,26:1463–1464.
28. Revell LJ:phytools: an R package for phylogenetic comparative biology (and other things).Methods Ecol Evol2012,3:217–223.
29. Pagel M:Inferring the historical patterns of biological evolution.Nature 1999,401:877–884.
31. Angly FE, Willner D, Rohwer F, Hugenholtz P, Tyson GW:Grinder: a versatile amplicon and shotgun sequence simulator.Nucleic Acids Res 2012,40:e94–e94.
32. Barabási AL, Albert R:Emergence of scaling in random networks.Science 1999,286:509–512.
33. Haas BJ, Gevers D, Earl AM, Feldgarden M, Ward DV, Giannoukos G, Ciulla D, Tabbaa D, Highlander SK, Sodergren E, Methe B, DeSantis TZ, Petrosino JF, Knight R, Birren BW:Chimeric 16S rRNA sequence formation and detection in Sanger and 454-pyrosequenced PCR amplicons.Genome Res 2011,21:494–504.
34. Caporaso JG, Kuczynski J, Stombaugh J, Bittinger K, Bushman FD, Costello EK, Fierer N, Pena AG, Goodrich JK, Gordon JI, Huttley GA, Kelley ST, Knights D, Koenig JE, Ley RE, Lozupone CA, McDonald D, Muegge BD, Pirrung M, Reeder J, Sevinsky JR, Turnbaugh PJ, Walters WA, Widmann J, Yatsunenko T, Zaneveld J, Knight R:QIIME allows analysis of high-throughput community sequencing data.Nat Methods2010,7:335–336. 35. Bragg L, Stone G, Imelfort M, Hugenholtz P, Tyson GW:Fast, accurate
error-correction of amplicon pyrosequences using Acacia.Nat Methods 2012,9:425–426.
36. Li W, Fu L, Niu B, Wu S, Wooley J:Ultrafast clustering algorithms for metagenomic sequence analysis.Brief Bioinform2012,13:656–668. 37. Altschul SF, Gish W, Miller W, Myers EW, Lipman DJ:Basic local alignment
search tool.J Mol Biol1990,215:403–410.
38. Sadedin SP, Pope B, Oshlack A:Bpipe: a tool for running and managing bioinformatics pipelines.Bioinformatics2012,28:1525–1526.
39. Legendre P, Gallagher ED:Ecologically meaningful transformations for ordination of species data.Oecologia2001,129:271–280.
40. Turnbaugh PJ, Hamady M, Yatsunenko T, Cantarel BL, Duncan A, Ley RE, Sogin ML, Jones WJ, Roe BA, Affourtit JP, Egholm M, Henrissat B, Heath AC, Knight R, Gordon JI:A core gut microbiome in obese and lean twins.
Nature2009,457:480–484.
41. Reyes A, Haynes M, Hanson N, Angly FE, Heath AC, Rohwer F, Gordon JI:
Viruses in the faecal microbiota of monozygotic twins and their mothers.Nature2010,466:334–338.
42. Dixon P:VEGAN, a package of R functions for community ecology.J Veg Sci2003,14:927–930.
43. Cáceres MD, Legendre P:Associations between species and groups of sites: indices and statistical inference.Ecology2009,90:3566–3574. 44. Markowitz VM, Chen I-MA, Palaniappan K, Chu K, Szeto E, Grechkin Y, Ratner
A, Jacob B, Huang J, Williams P, Huntemann M, Anderson I, Mavromatis K, Ivanova NN, Kyrpides NC:IMG: the integrated microbial genomes database and comparative analysis system.Nucleic Acids Res2011,
40:D115–D122.
45. Nadkarni MA, Martin FE, Jacques NA, Hunter N:Determination of bacterial load by real-time PCR using a broad-range (universal) probe and primers set.Microbiology2002,148:257–266.
46. Giardine B, Riemer C, Hardison RC, Burhans R, Elnitski L, Shah P, Zhang Y, Blankenberg D, Albert I, Taylor J, Miller W, Kent WJ, Nekrutenko A:Galaxy: a platform for interactive large-scale genome analysis.Genome Res2005,
15:1451–1455.
47. Probst AJ, Auerbach AK, Moissl-Eichinger C:Archaea on human skin.PLoS One2013,8:e65388.
48. Crosby LD, Criddle CS:Understanding bias in microbial community analysis techniques due to rrn operon copy number heterogeneity.
BioTechniques2003,34:790–794. 796, 798 passim.
49. Rajilić-StojanovićM, Heilig HGHJ, Molenaar D, Kajander K, Surakka A, Smidt H, De Vos WM:Development and application of the human intestinal tract chip, a phylogenetic microarray: analysis of universally conserved phylotypes in the abundant microbiota of young and elderly adults.Environ Microbiol2009,11:1736–1751.
50. Ley RE, Turnbaugh PJ, Klein S, Gordon JI:Microbial ecology: human gut microbes associated with obesity.Nature2006,444:1022–1023. 51. Larsen N, Vogensen FK, van den Berg FWJ, Nielsen DS, Andreasen AS,
Pedersen BK, Al-Soud WA, Sørensen SJ, Hansen LH, Jakobsen M:Gut microbiota in human adults with type 2 diabetes differs from non-diabetic adults.PLoS One2010,5:e9085.
52. Bishara J, Farah R, Mograbi J, Khalaila W, Abu-Elheja O, Mahamid M, Nseir W:
Obesity as a risk factor for Clostridium difficile infection.Clin Infect Dis 2013,57:489–493.
53. Wu GD, Chen J, Hoffmann C, Bittinger K, Chen Y-Y, Keilbaugh SA, Bewtra M, Knights D, Walters WA, Knight R, Sinha R, Gilroy E, Gupta K, Baldassano R,
Nessel L, Li H, Bushman FD, Lewis JD:Linking long-term dietary patterns with gut microbial enterotypes.Science2011,334:105–108.
54. Jeffery IB, Claesson MJ, O’Toole PW, Shanahan F:Categorization of the gut microbiota: enterotypes or gradients?Nat Rev Micro2012,10:591–592. 55. Hugenholtz P, Kyrpides NC:A changing of the guard.Environ Microbiol
2009,11:551–553.
56. Pace NR:Mapping the tree of life: progress and prospects.Microbiol Mol Biol Rev2009,73:565–576.
57. Pinard R, de Winter A, Sarkis G, Gerstein M, Tartaro K, Plant R, Egholm M, Rothberg J, Leamon J:Assessment of whole genome amplification-induced bias through high-throughput, massively parallel whole genome sequencing.BMC Genomics2006,7:216.
58. Yilmaz S, Allgaier M, Hugenholtz P:Multiple displacement amplification compromises quantitative analysis of metagenomes.Nat Methods2010,
7:943–944.
59. Niu B, Fu L, Sun S, Li W:Artificial and natural duplicates in pyrosequencing reads of metagenomic data.BMC Bioinformatics2010,11:187.
60. Mendell JE, Clements KD, Choat JH, Angert ER:Extreme polyploidy in a large bacterium.Proc Nat Acad Sci U S A2008,105:6730–6734. 61. Komaki K, Ishikawa H:Genomic copy number of intracellular bacterial
symbionts of aphids varies in response to developmental stage and morph of their host.Insect Biochem Molec2000,30:253–258. 62. Ohtani N, Tomita M, Itaya M:An extreme thermophile, Thermus
thermophilus, is a polyploid bacterium.J Bacteriol2010,192:5499–5505. 63. Klappenbach JA, Dunbar JM, Schmidt TM:rRNA operon copy number
reflects ecological strategies of Bacteria.Appl Environ Microbiol2000,
66:1328–1333.
64. Lauro FM, McDougald D, Thomas T, Williams TJ, Egan S, Rice S, DeMaere MZ, Ting L, Ertan H, Johnson J, Ferriera S, Lapidus A, Anderson I, Kyrpides N, Munk AC, Detter C, Han CS, Brown MV, Robb FT, Kjelleberg S, Cavicchioli R:
The genomic basis of trophic strategy in marine bacteria.Proc Nat Acad Sci U S A2009,106:15527–15533.
65. Pruesse E, Quast C, Knittel K, Fuchs BM, Ludwig W, Peplies J, Glöckner FO:
SILVA: a comprehensive online resource for quality checked and aligned ribosomal RNA sequence data compatible with ARB.Nucleic Acids Res 2007,35:7188–7196.
66. Benjamini Y, Speed TP:Summarizing and correcting the GC content bias in high-throughput sequencing.Nucleic Acids Res2012,40:e72–e72. 67. Chen Y-C, Liu T, Yu C-H, Chiang T-Y, Hwang C-C:Effects of GC bias in
next-generation-sequencing data on de novo genome assembly.PLoS One2013,8:e62856.
68. Angly FE, Willner D, Prieto-Davó A, Edwards RA, Schmieder R, Vega-Thurber R, Antonopoulos DA, Barott K, Cottrell MT, Desnues C, Dinsdale EA, Furlan M, Haynes M, Henn MR, Hu Y, Kirchman DL, McDole T, McPherson JD, Meyer F, Miller RM, Mundt E, Naviaux RK, Rodriguez-Mueller B, Stevens R, Wegley L, Zhang L, Zhu B, Rohwer F:The GAAS metagenomic tool and its estimations of viral and microbial average genome size in four major biomes.
PLoS Comput Biol2009,5:e1000593.
69. Bellemain E, Carlsen T, Brochmann C, Coissac E, Taberlet P, Kauserud H:ITS as an environmental DNA barcode for fungi: an in silico approach reveals potential PCR biases.BMC Microbiol2010,10:189.
doi:10.1186/2049-2618-2-11
Cite this article as:Anglyet al.:CopyRighter: a rapid tool for improving the accuracy of microbial community profiles through lineage-specific