Received: April 12, 2016; Revised: May 19, 2016; Accepted: May 30, 2016
© The Author 2016. Published by Oxford University Press. All rights reserved. For Permissions, please email: [email protected].
doi:10.1093/carcin/bgw067
Advance Access publication June 7, 2016 Original Manuscript
870
original manuscript
An exome-wide analysis of low frequency and rare
variants in relation to risk of breast cancer in African
American Women: the AMBER Consortium
Stephen A.Haddad
*
, Edward A.Ruiz-Narváez, Christopher A.Haiman
1,
Lara E.Sucheston-Campbell
2, Jeannette T.Bensen
3, Qianqian Zhu
4,
Song Liu
4, Song Yao
2, Elisa V.Bandera
5, Lynn Rosenberg, Andrew F.Olshan
3,
Christine B.Ambrosone
2, Julie R.Palmer and Kathryn L.Lunetta
6Slone Epidemiology Center at Boston University, Boston, MA 02215, USA,
1Department of Preventive Medicine, Keck
School of Medicine, University of Southern California/Norris Comprehensive Cancer Center, Los Angeles, CA 90033, USA,
2
Department of Cancer Prevention and Control, Roswell Park Cancer Institute, Buffalo, NY 14263, USA,
3Department of
Epidemiology, Gillings School of Global Public Health, University of North Carolina at Chapel Hill, Chapel Hill, NC 27599,
USA,
4Department of Biostatistics and Bioinformatics, Roswell Park Cancer Institute, Buffalo, NY 14263, USA,
5Cancer
Prevention and Control, Rutgers Cancer Institute of New Jersey, New Brunswick, NJ 08903, USA and
6Department of
Biostatistics, Boston University School of Public Health, Boston, MA 02118, USA
*To whom correspondence should be addressed. Tel: +1 617 206 6177; Fax: +1 617 738 5119; Email: [email protected]
Abstract
A large percentage of breast cancer heritability remains unaccounted for, and most of the known susceptibility loci have
been established in European and Asian populations. Rare variants may contribute to the unexplained heritability of this
disease, including in women of African ancestry (AA). We conducted an exome-wide analysis of rare variants in relation to
risk of overall and subtype-specific breast cancer in the African American Breast Cancer Epidemiology and Risk (AMBER)
Consortium, which includes data from four large studies of AA women. Genotyping on the Illumina Human Exome
Beadchip yielded data for 170 812 SNPs and 8287 subjects: 3629 cases (1093 estrogen receptor negative (ER−), 1968 ER+, 568
ER unknown) and 4658 controls, the largest exome chip study to date for AA breast cancer. Pooled gene-based association
analyses were performed using the unified optimal sequence kernel association test (SKAT-O) for variants with minor
allele frequency (MAF) ≤ 5%. In addition, each variant with MAF >0.5% was tested for association using logistic regression.
There were no significant associations with overall breast cancer. However, a novel gene, FBXL22 (P = 8.2 × 10
–6), and a
gene previously identified in GWAS of European ancestry populations, PDE4D (P = 1.2 × 10
–6), were significantly associated
with ER− breast cancer after correction for multiple testing. Cases with the associated rare variants were also negative
for progesterone and human epidermal growth factor receptors—thus, triple-negative cancer. Replication is required to
confirm these gene-level associations, which are based on very small counts at extremely rare SNPs.
Introduction
Genome-wide association studies (GWAS) have identified more
than 90 genetic loci associated with breast cancer (
1
,
2
).
Per-allele odds ratios have been modest (most <1.2), as is typical
for GWAS findings. These low-penetrance loci, together with
doi:10.1093/carcin/bgw067
Advance Access publication June 7, 2016 Original Manuscript
these associations have failed to reach statistical significance in
studies of African ancestry (AA) women (
5–15
). While larger AA
sample sizes and an accounting for differences in linkage
dis-equilibrium across ethnicities would likely result in more
suc-cessful replications, the European-discovered risk variants may
also explain less of the genetic contribution to breast cancer in
AA women.
While some of the unexplained breast cancer heritability in
AA women is surely due to unidentified common
susceptibil-ity SNPs in this population, another portion may be explained
by less common (1–5%) and rare variants (< 1%). These lower
frequency variants represent a large proportion of all human
genetic variation but are poorly captured by most GWAS arrays
(
16
). There are a growing number of examples of rare variants
associated with complex disease, with findings for autism,
schizophrenia, inflammatory bowel disease and diabetes (
17
). In
addition to the already established high- and
moderate-pene-trance genes for breast cancer (
3
,
4
,
18
), novel low frequency risk
variants for cancers including prostate (
19
) and ovarian (
20
,
21
)
have also been reported. Still, it remains unclear how much rare
variants contribute to the heritability of breast cancer and other
complex diseases.
In recent years, the development of exome-wide arrays has
allowed for the relatively inexpensive assessment of known
rare exonic variants. Current exome arrays include >200 000
coding variants and were developed on the basis of whole
exome sequencing data from ~12 000 individuals. Most of those
sequenced were of European ancestry, but a small number of
AAs and other ethnicities were included as well (
16
,
22
).
A case-control study nested in the Multiethnic Cohort (MEC)
used the Illumina exome chip to investigate the role of rare
exonic variation in the etiology of breast cancer (
16
). Single
SNP analyses were conducted, as well as gene-based testing of
the burden of rare alleles. Only one significant association was
found, for splice-site SNP rs145889899 in the LDLRAD1 gene. This
variant was only seen in AAs (with a frequency of 0.65% in AA
controls) and had an odds ratio of 3.74. While no additional
find-ings were significant, there was low power to detect genotype
relative risks ≤ 2 in the AA participants due to the modest
num-ber of available AA cases (N = 591).
The present study combined the MEC exome chip data with
exome chip data from three additional studies of breast
can-cer in AA women, forming the African American Breast Cancan-cer
Epidemiology and Risk (AMBER) Consortium, the largest exome
wide analysis sample to date for AA breast cancer (3629 cases
and 4658 controls). We primarily used gene-based methods for
association analysis, given the relatively low power and high
multiple testing burden for single SNP analyses of rare variants
(
22
,
23
). Gene-based testing has the potential to increase power
when multiple SNPs in a given gene are associated (
22
).
Materials and methods
Study population
This investigation was conducted using data from the AMBER Consortium, a collaboration of four of the largest studies of breast cancer in AA women. The AMBER Consortium has been described previously (24), and prior reports have detailed the individual studies: the Carolina Breast Cancer
Study (CBCS) (25), the Women’s Circle of Health Study (WCHS) (26,27), the Black Women’s Health Study (BWHS) (28), and the Multiethnic Cohort (MEC) (29). Institutional Review Board approval was obtained for each study, and all participants provided written informed consent.
Briefly, the CBCS is a North Carolina population-based case-control study of women aged 20–74 years that began in 1993. The North Carolina Central Cancer Registry’s rapid case ascertainment system was used for case identification, and controls were selected through 2001 using Division of Motor Vehicles lists (age < 65 years) and Health Care Financing Administration lists (age ≥ 65). Interviewers collected questionnaire data and samples for DNA analysis in home visits.
The WCHS is a multi-site case-control study in New York City (NYC) (2002–2008) and New Jersey (NJ) (2006-present). Hospital-based ascer-tainment of cases aged 20–75 years was used in NYC, and controls were selected through random digit dialing. Cases in NJ are identified by the NJ State Cancer Registry using rapid case ascertainment, and controls are identified through random digit dialing and community-based efforts (27). Risk factor data and samples for DNA analysis are obtained during in-person interviews.
The BWHS is a prospective cohort study of 59 000 AA women from across the United States who enrolled by completing a postal health ques-tionnaire in 1995. The age range at baseline was 21–69 years. Biennial follow-up questionnaires identify new cases of breast cancer, and these cases are confirmed by medical records or from state cancer registry data and the National Death Index. Nearly 27 000 BWHS participants provided saliva samples for DNA analysis.
The MEC is a prospective cohort study that began in 1993 with the enrollment of men and women aged 45–75 years from a range of ethnic groups in Hawaii and California. Data are collected by mailed question-naire at 5-year intervals, and breast cancer cases are confirmed through the Hawaii and California state cancer registries and the National Death Index. Blood samples were collected from study participants for DNA analysis.
Eligible cases for the present analyses were AA women with incident invasive breast cancer or ductal carcinoma in situ (DCIS). For BWHS and MEC, controls were chosen from among women without breast cancer, and were frequency matched to cases on geographical region, sex, race and 5-year age group. ER status for cases was determined using pathology data from hospital records or cancer registry records.
Genotyping and QC
Genotyping of DNA from participants in the BWHS, CBCS and WCHS was performed by the Center for Inherited Disease Research (CIDR) using the Illumina Human Exome Beadchip v1.1. This array includes >200 000 coding variants, as well as tag SNPs for GWAS hits, a grid of common variants, and ancestry informative markers (AIMs). A description of the exome chip design is available from http://genome.sph.umich.edu/wiki/ Exome_Chip_Design. CIDR used the GenTrain Version 1.0 calling algorithm in GenomeStudio version 2011.1, Genotyping Module 1.9.4. Manual review was conducted for all Y, XY pseudoautosomal and mitochondrial SNPs. Autosomal and X chromosome SNPs were also manually reviewed if a rare heterozygous cluster may have been missed by the GenCall algorithm and if the zCall algorithm (30) identified four or more possible new heterozy-gous points.
A total of 246 519 SNPs were genotyped, and 231 705 SNPs remained after excluding variants that failed technical filters imposed by CIDR, or QC filters recommended by the University of Washington. Briefly, genotypes with a GenCall (GC) score <0.15 were classified as missing, and SNPs were removed if they had poor cluster properties (ex. cluster separation <0.2 or <0.3 depending on allele frequency), call rates <0.98, Hardy–Weinberg Equilibrium P < 1 × 10⁻⁴, >1 Mendelian error in trios from HapMap (31) or >2
discordant calls in duplicate samples. Mitochondrial and Y chromosome SNPs were also removed. Genotypes were attempted for 6936 participants from the BWHS, CBCS and WCHS, and were completed with call rate >98% for 6828 participants, which included 3130 cases (963 estrogen receptor negative (ER−), 1674 ER+, 493 ER unknown) and 3698 controls.
Genetic data from 499 cases (130 ER−, 294 ER+, 75 ER unknown) and 960 controls in the MEC were available from genotyping on a previous version of the exome chip (16) which contained >99% of the high quality variants from v1.1. Genotypes from MEC were combined with the data from the
Abbreviations
AA
African ancestry
other AMBER studies into a data set containing 245 571 SNPs. Greater than 66 000 SNPs were monomorphic in the combined set and were omitted from analyses, as were SNPs with high quality data from only one of the two exome chips and SNPs with any discordant genotypes across the two chips for 30 MEC participants who were included on both. The final data set for analysis included 170 812 SNPs and 8287 participants: 3629 cases (1093 ER−, 1968 ER+, 568 ER unknown) and 4658 controls.
We used the CHARGE (Cohorts for Heart and Aging Research in Genomic Epidemiology) Consortium’s annotation of exome chip variants (version 6, 11/7/14) downloaded from http://www.chargeconsortium.com/ main/exomechip (32). This annotation was performed with dbNSFP ver-sion 2.6 (33,34).
We used the smartpca program in the EIGENSOFT package (35) to conduct a principal components analysis (PCA) based on ~42 000 com-mon SNPs, most of which were custom content additions to the exome chip for use in other AMBER projects. In a separate analysis, PLINK version 1.07 (36) was used to estimate identity by descent in participant pairs, and identified 130 sets of relatives across and within the individual studies, consisting of 270 individuals. These 270 individuals were flagged, as were 35 outlying individuals from the PCA, so that sensitivity analyses could be performed. Genotype principal components were tested for associa-tion with case status after controlling for the study covariates: study, DNA source (blood, saliva[Oragene], saliva[mouthwash]), and the matching variables. While no principal components were strongly associated in the multivariable model, we included terms for principal components with P < 0.1 in our analyses.
Association analysis
Gene-based association analyses for overall, ER+, and ER− breast cancer were conducted using the unified optimal sequence kernel association test (SKAT-O) (37), as implemented in the R package seqMeta (38). As a linear combination of the burden and SKAT (39) tests, SKAT-O achieves robust power whether a given gene has a high proportion of causal vari-ants exerting effects in the same direction, or instead has many noncausal variants or variants exerting effects in opposite directions (22). We used the default SKAT-O option in the seqMeta package that considers rho = 1 (burden) and rho = 0 (SKAT) tests and selects the optimal of the two tests. Depending on which test is chosen, SKAT-O models the phenotype versus a weighted aggregation of either the variants (burden test) or the variant score test statistics (SKAT) to produce a gene-level P value that indicates the degree of enrichment of rare variant associations in that gene (37). We included variants with minor allele frequency (MAF) ≤ 5%, and used the beta distribution weights proposed by Wu et al. (39), which upweight rarer variants, for both tests. We used a Bonferroni correction based on the number of genes evaluated to assess the significance of the gene-based test results.
We performed separate gene-based analyses for three successively less stringent sets of exonic variants: (1) ‘NS_strict’ variants (based on Purcell et al. (40)): stopgain, stoploss, frameshift or predicted damaging by all five of the following algorithms: SIFT (41), mutationTaster category [A or D] (42), LRT (43), PolyPhen_HDIV (44) and PolyPhen_HVAR (44), (2) ‘NS_ broad’ variants (Purcell et al. (40)): ‘NS_strict’ variants plus those variants that are predicted damaging by at least one of the five algorithms and (3) All nonsynonymous variants (‘NS_all’): ‘NS_broad’ variants plus all other missense and splice variants. Testing of these three sets of variants gave us more flexibility to find the best set of SNPs for gene-based analysis (ideally a set including most or all truly associated SNPs, but few, if any, unassociated SNPs).
Single SNP association analyses were conducted using logistic regres-sion as implemented in PLINK verregres-sion 1.07. These analyses were restricted to variants with MAF > 0.5% in order to avoid performing a large number of underpowered tests. We used a Bonferroni adjustment for the effective number of independent tests, applying the method of Gao et al. (45), to assess the significance of the single SNP results.
Both gene-based and single SNP analyses were adjusted for study, age, geographic region, DNA source and genotype principal components 5, 6 and 8 in a pooled analysis that combined individual level data across the four studies in AMBER. This approach was preferred over meta-analysis given prior evidence that pooled analysis is more powerful for gene-based testing of rare variants under conditions where pooling is appropriate (46).
Results
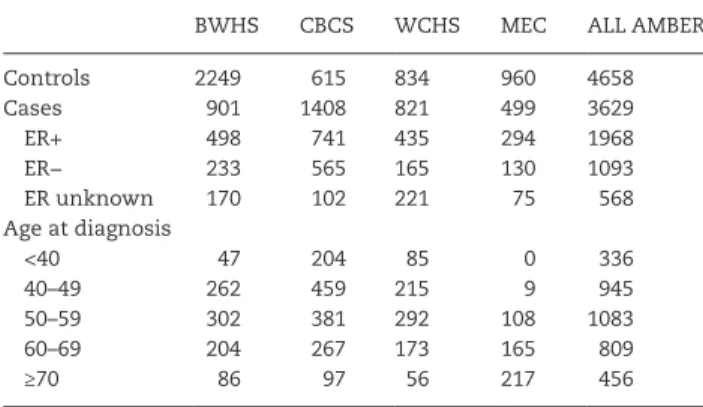
The present analyses included 3629 breast cancer cases (1093
ER−, 1968 ER+, 568 ER unknown) and 4658 controls.
Table 1
shows the distribution of ER subtypes and age at diagnosis for
the cases by study site.
There were 184 100 annotation records for the 170 812 SNPs
that passed QC filters: some SNPs mapped to more than one
gene, and these multiple mappings were maintained for the
gene-based analyses we performed. More than 80% of the SNP
records were annotated as nonsynonymous, including
mis-sense, stopgain, stoploss, frameshift and splicing variants (see
Supplementary Table 1
, available at Carcinogenesis Online, for
the full distribution of roles for the final SNP set). Over 80% of
the SNPs had MAF <5% in AMBER, over 70% had MAF <1%, and
nearly half of the SNPs had MAF <0.1%. QQ plots for the
gene-based and single SNP association analyses we performed are
shown in
Supplementary Figure 1
, available at Carcinogenesis
Online. As is common for SKAT analyses of binary traits, there
was inflation in the gene-based tests (
47
,
48
).
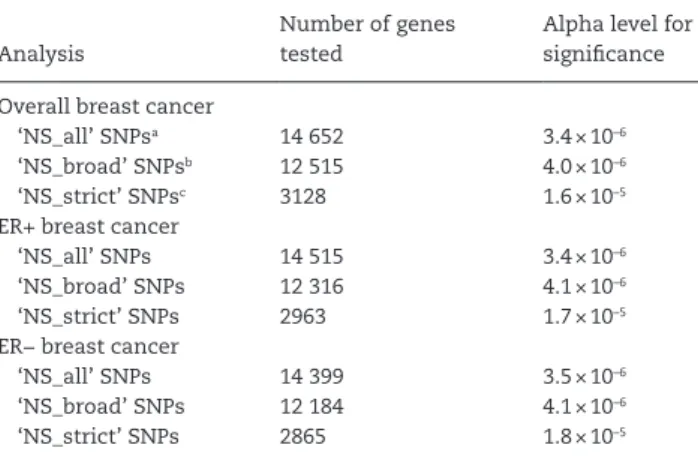
The number of gene-based tests conducted and the
result-ing alpha levels for significance are listed in
Table 2
by outcome
and SNP group. As the SNP functional group became more strict,
fewer tests were conducted because fewer genes contained at
least two SNPs in the given group. Fewer gene-based tests were
conducted for the ER+ and ER− analyses compared to overall
breast cancer because these subtype analyses had smaller
sam-ple sizes, which resulted in more monomorphic SNPs that were
excluded.
Table 3
shows the five most significant genes for each SKAT-O
run (see
Supplementary Table 2
, available at Carcinogenesis
Online, for the top 50 genes for each set of variants). For
over-all and ER+ breast cancer, RTN4RL1 was the most significant
gene for both the ‘NS_all’ and ‘NS_broad’ SNP sets, with
nomi-nal
P values ranging from 1.8 × 10
–5to 1.9 × 10
–4. These results
were based on 6–10 SNPs that were used in burden tests (the
SKAT-O method selected rho = 1 as optimal in these instances).
For the ‘NS_strict’ variants, the most significant genes for
over-all and ER+ breast cancer were IQCA1 (P = 4.6 × 10
–4) and FSCN3
(P = 2.3 × 10
–4), respectively. None of the top results for overall or
ER+ breast cancer survived a multiple testing correction based
on the number of genes evaluated.
The most significant genes for ER− breast cancer were PDE4D
(P = 1.2 × 10
–6using either the ‘NS_all’ or ‘NS_broad’ SNP sets) and
FBXL22 (P = 8.2 × 10
–6using the ‘NS_strict’ SNP set), and these
Table 1. Characteristics of participants in the AMBER Consortium by study site
BWHS CBCS WCHS MEC ALL AMBER
Controls 2249 615 834 960 4658
Cases 901 1408 821 499 3629
ER+ 498 741 435 294 1968
ER− 233 565 165 130 1093
ER unknown 170 102 221 75 568
Age at diagnosis
<40 47 204 85 0 336
40–49 262 459 215 9 945
50–59 302 381 292 108 1083
60–69 204 267 173 165 809
≥70 86 97 56 217 456
survived a correction for multiple testing. The PDE4D and FBXL22
results were each based on burden testing (rho = 1) of two SNPs
with a cumulative MAF ~0.02%. Details of the four SNPs
con-tributing to these significant test results are shown in
Table 4
.
All of the contributing SNPs are nonsynonymous coding SNPs
for multiple isoforms of PDE4D or FBXL22. These SNPs had good
genotyping cluster properties (
Supplementary Figure 2
,
avail-able at Carcinogenesis Online) and 100% genotyping pass rates in
the present study. Each SNP had an MAF ~0.01% in the AMBER
analysis of ER− cases and controls, due to the presence of one
rare allele in one invasive ER− case. The rare allele carriers were
four independent participants (one for each SNP) with varying
ages at diagnosis and percentages of AA (
Table 4
). All four of
these women had triple-negative breast cancer (tumors
nega-tive for estrogen receptors, progesterone receptors and human
epidermal growth factor receptor 2). Among all 1093 ER− cases,
599 had been classified as triple negative based on available data
on all three molecular markers. The four SNPs of interest are
monomorphic in AAs from the 1000 Genomes Project (
49
) Phase
3 and the NHLBI ESP (National Heart, Lung, and Blood Institute
Exome Sequencing Project) (
50
). These same projects report very
low allele frequencies (≤0.2%) for these SNPs in European
ances-try populations (
Table 4
).
Sensitivity analyses were run for the PDE4D and FBXL22
genes versus ER− breast cancer, excluding first-degree and
sec-ond-degree relatives identified via the genotypes, as well as PCA
outliers who clustered with HapMap 3 Europeans, Mexicans, or
Asians. Results became more significant with these exclusions
(PDE4D P = 9.9 × 10
–7; FBXL22 P = 7.4 × 10
–6).
Single SNP association analyses were performed for the 58
776 SNPs with MAF >0.5%. The correlation among these SNPs
yielded the equivalent of 50 245 independent tests (
45
);
there-fore, the threshold for significance was set at 9.95 × 10
–7. SNP
rs8100241, a previously reported risk marker at the ER−/
triple-negative GWAS locus on chromosome 19p13.11 (
12
,
52–56
), met
this study-wide threshold for ER− disease (P = 1.7 × 10
–7). The
A allele at rs8100241 had a frequency of 40% in the present study
and was associated with a decreased risk of ER− breast cancer
(OR 0.75, 95% CI 0.68, 0.84). No other individual SNPs reached
statistical significance (
Supplementary Table 3
, available at
Carcinogenesis Online), including the LDLRAD1 SNP rs145889899
(P = 0.17), for which an association had been reported in the MEC
exome chip study (
16
).
Discussion
In these analyses, we observed significant associations between
the PDE4D and FBXL22 genes and ER− breast cancer in a
rela-tively large sample of AA women, using gene-based testing of
rare exonic variants. Two nonsynonymous coding SNPs in each
of these genes were responsible for their significant associations.
The minor allele at each of these four SNPs was present in one
invasive ER− case each (a different case subject for each of the
four SNPs). These four cases were all triple-negative breast
can-cers. The four SNPs of interest from these two genes were absent
in the AMBER controls. This is consistent with their reported
monomorphism in AA samples from the 1000 Genomes Project
and the NHLBI ESP.
Although the association we report for the PDE4D gene is
with ER− (and triple-negative) breast cancer, one of the two rare
SNPs contributing to this association (rs201360779) was also
seen in one invasive ER+ case. Thus, this gene may affect the
risk of both ER subtypes. The two contributing PDE4D SNPs in
our study were predicted to be damaging by mutationTaster
(
42
), although SIFT (
41
) predicted that these mutations would be
tolerated. The PolyPhen HDIV and HVAR models (
44
) predicted
damaging results from rs200725508, but these algorithms
pre-dicted benign results for rs201360779 (with the exception of
the HDIV prediction of ‘possibly damaging’ for this SNP for one
PDE4D isoform).
The 2013 GWAS meta-analysis by Michailidou and colleagues
(
1
) reported a breast cancer association with SNP rs1353747,
which is located in an intron of PDE4D. In that study, the G allele
at this common SNP showed weak protective associations for
both ER+ and ER− disease. In this study, rs1353747 was not
asso-ciated with either disease subtype.
PDE4D is located on chromosome 5q11.2–12.1 and encodes
phosphodiesterase subtype 4D, a member of the PDE4 family of
phosphodiesterases, which multiple tumor cell types express
as major regulators of cAMP degradation (
57
). PDE4D may
func-tion as a tumor-promoting factor by causing lower cAMP
con-centrations, which have been linked to increased survival and
proliferation of cancer cells. This oncogenic role is supported by
experiments showing that inhibition of PDE4D causes apoptosis
and growth retardation in multiple types of cancer cells,
includ-ing breast, but not in nonmalignant epithelial cells (
57
).
Lin et al. (
57
) reported PDE4D homozygous deletions in 198
of 5569 (3.6%) primary tumors from The Cancer Genome Atlas
(TCGA) projects and TumorScape (
58
), with most being internal
microdeletions. They also found microdeletions in established
cancer cell lines including breast. These microdeletions were
associated with increased expression of the protein, and they
affected upstream conserved regions 1 (UCR1) and 2 (UCR2) of
the gene. UCR1 and UCR2 inhibit PDE4D activity, likely by
form-ing complexes with the PDE4D catalytic domain before cAMP
enters the site. Lin et al. showed that a short isoform of PDE4D
with no functional UCR1 or UCR2 promoted cancer cell growth,
while a long isoform that contained both UCR1 and UCR2 did
not. In the present study, the two rare missense mutations
contributing to the PDE4D gene-level association were located
upstream of UCR1 and UCR2 and were risk variants (not
protec-tive). It could be hypothesized that these variants act by
induc-ing a change in protein structure that disrupts the interaction of
the UCRs with the catalytic domain of PDE4D, thereby increasing
protein activity.
Table 2. Number of gene-based tests conducted and corresponding significance criteria
Analysis
Number of genes tested
Alpha level for significance
Overall breast cancer
‘NS_all’ SNPsa 14 652 3.4 × 10⁻⁶
‘NS_broad’ SNPsb 12 515 4.0 × 10⁻⁶
‘NS_strict’ SNPsc 3128 1.6 × 10⁻⁵
ER+ breast cancer
‘NS_all’ SNPs 14 515 3.4 × 10⁻⁶
‘NS_broad’ SNPs 12 316 4.1 × 10⁻⁶
‘NS_strict’ SNPs 2963 1.7 × 10⁻⁵
ER− breast cancer
‘NS_all’ SNPs 14 399 3.5 × 10⁻⁶
‘NS_broad’ SNPs 12 184 4.1 × 10⁻⁶
‘NS_strict’ SNPs 2865 1.8 × 10⁻⁵
a‘NS_all’ SNPs: stopgain, stoploss, frameshift, missense or splicing. b‘NS_broad’ SNPs: stopgain, stoploss, frameshift, or predicted damaging by at
least one of the following algorithms: SIFT, mutationTaster category [A or D], LRT, PolyPhen_HDIV or PolyPhen_HVAR.
c‘NS_strict’ SNPs: stopgain, stoploss, frameshift or predicted damaging by all
FBXL22 has not previously been associated with breast
can-cer. This gene is located on chromosome 15q22.31 and encodes
F-box and leucine-rich repeat protein 22. This F-box protein, a
ubiquitin ligase component, has been shown to promote the
degradation of sarcomeric proteins, and is critical for
main-taining cardiac contractility in vivo (
59
). It is unclear what
biological mechanism might link FBXL22 to breast cancer
devel-opment. Nevertheless, the two rare SNPs contributing to the
Table 3. The most significant gene-based test results for each analysis
Gene Nominal P value Corrected P valuea rhob Cumulative MAF (%)
Number of SNPs included in the test
Overall breast cancer, ‘NS_all’ SNPs
RTN4RL1 1.3 × 10⁻⁴ 1 1 4.31 10
TPCN1 2.0 × 10⁻⁴ 1 0 0.32 9
RARA 2.3 × 10⁻⁴ 1 1 2.42 2
KIF3C 3.0 × 10⁻⁴ 1 1 2.62 6
OBSCN 4.4 × 10⁻⁴ 1 0 75.88 146
Overall breast cancer, ‘NS_broad’ SNPs
RTN4RL1 1.9 × 10⁻⁴ 1 1 1.96 6
RARA 2.3 × 10⁻⁴ 1 1 2.42 2
GPRASP1 3.0 × 10⁻⁴ 1 0 5.35 5
NCAPG2 3.3 × 10⁻⁴ 1 0 2.91 9
TMEM130 3.6 × 10⁻⁴ 1 0 0.11 2
Overall breast cancer, ‘NS_strict’ SNPs
IQCA1 4.6 × 10⁻⁴ 1 0 3.09 3
PDE4A 1.2 × 10⁻³ 1 1 0.53 2
ECT2L 2.0 × 10⁻³ 1 0 1.33 2
GCKR 2.5 × 10⁻³ 1 1 0.21 4
ACSF3 2.6 × 10⁻³ 1 1 0.17 3
ER+ breast cancer, ‘NS_all’ SNPs
RTN4RL1 1.8 × 10⁻⁵ 0.25 1 4.37 10
OR2W5 7.3 × 10⁻⁵ 1 1 16.16 11
CYSRT1 1.0 × 10⁻⁴ 1 1 0.23 2
RNF130 1.3 × 10⁻⁴ 1 0 0.69 3
GABPA 1.3 × 10⁻⁴ 1 1 0.02 2
ER+ breast cancer, ‘NS_broad’ SNPs
RTN4RL1 3.2 × 10⁻⁵ 0.39 1 2.00 6
RNF130 1.3 × 10⁻⁴ 1 0 0.69 3
GABPA 1.3 × 10⁻⁴ 1 1 0.02 2
OR5H15 3.5 × 10⁻⁴ 1 1 0.05 2
TCHP 3.9 × 10⁻⁴ 1 1 4.35 11
ER+ breast cancer, ‘NS_strict’ SNPs
FSCN3 2.3 × 10⁻⁴ 0.67 1 0.06 3
GUF1 7.0 × 10⁻⁴ 1 0 0.22 3
ZIM3 7.8 × 10⁻⁴ 1 1 0.87 2
TSC2 8.0 × 10⁻⁴ 1 0 0.61 5
TBPL2 9.1 × 10⁻⁴ 1 0 0.09 2
ER− breast cancer, ‘NS_all’ SNPs
PDE4D 1.2 × 10⁻⁶ 0.017 1 0.02 2
PLEKHG5 2.2 × 10⁻⁵ 0.31 1 9.36 18
CCNDBP1 4.4 × 10⁻⁵ 0.64 0 0.06 3
DIMT1 5.8 × 10⁻⁵ 0.84 0 0.03 2
TEX12 1.6 × 10⁻⁴ 1 0 0.20 2
ER− breast cancer, ‘NS_broad’ SNPs
PDE4D 1.2 × 10⁻⁶ 0.015 1 0.02 2
LRRC8D 1.8 × 10⁻⁵ 0.22 0 0.26 3
CCNDBP1 4.4 × 10⁻⁵ 0.54 0 0.06 3
MRPS31 9.8 × 10⁻⁵ 1 1 1.12 2
NCR1 1.1 × 10⁻⁴ 1 0 0.50 2
ER− breast cancer, ‘NS_strict’ SNPs
FBXL22 8.2 × 10⁻⁶ 0.023 1 0.02 2
CCNDBP1 3.8 × 10⁻⁵ 0.11 0 0.05 2
SCARB1 9.6 × 10⁻⁵ 0.28 1 0.02 2
QRSL1 9.8 × 10⁻⁵ 0.28 0 0.07 2
MFGE8 1.1 × 10⁻⁴ 0.31 0 0.05 3
MAF, minor allele frequency.aBonferroni correction for the number of genes tested.
FBXL22/ER− association in this study met strict criteria for
vari-ant functionality: these nonsynonymous SNPs were predicted to
be damaging by five different algorithms (
41–44
).
Single SNP analyses confirmed an ER− association for the
GWAS locus on chromosome 19p13.11 (
12
,
52–56
). The
asso-ciated SNP in the present study was the common missense
variant rs8100241 in the ANKLE1 gene. This SNP has shown
significant associations with overall (
52
), ER− (
55
) and
triple-negative (
53
) breast cancer in prior studies of mostly European
ancestry subjects. These studies reported odds ratios
rang-ing from 0.84 to 0.88 for the A allele at this SNP, as compared
with the odds ratio of 0.75 reported in the present analysis for
ER− breast cancer. It should be noted, however, that the large
GAME-ON meta-analysis (
http://gameon.dfci.harvard.edu
)
reported weaker effect estimates for rs8100241: the odds ratio
reported for overall breast cancer was 0.95 (95% CI 0.92, 0.99;
P = 0.017), and the odds ratio for ER− breast cancer was 0.94
(95% CI 0.83, 1.07; P = 0.36).
Although the present study sample is the largest exome
wide analysis sample to date for AA breast cancer, this analysis
was underpowered to detect per-allele odds ratios <1.5, except
when cumulative risk allele frequencies per gene approached
or exceeded 5%. Further power limitations existed for analyses
by ER status.
The significant gene-level findings reported here are based
on four SNP variants that appear only once each in the AMBER
sample of ER− cases and controls. Given these very small counts
and the inflation seen in the gene-based test statistics, our
results should be interpreted with caution. A simple Fisher’s
exact test for the presence of a rare allele in PDE4D versus ER−
case/control status yields a P-value of 0.036, as does the same
test for FBXL22. Fisher’s exact test is conservative and does not
upweight rarer variants or account for covariates; however, the
modest P value from this test emphasizes the need for
replica-tion to verify associareplica-tions between these genes and ER− breast
cancer.
This is not to say that the rare variant calls for the four SNPs
of interest are questionable. There is good reason to believe that
these calls were accurate in our study. These SNPs are known
rare variants that the exome chip was designed to capture.
Each SNP was seen in two or more studies that contributed
sequence data for development of the exome chip: the minor
allele at rs201360779 was seen 29 times across the ~12 000
sequenced individuals, the minor allele at rs149590841 was seen
seven times, and the minor alleles for the other two SNPs were
each seen three times (ftp://share.sph.umich.edu/exomeChip/
ProposedContent/codingContent/). In AMBER, all four SNPs
showed high quality genotype clusters and clear separation of
the heterozygous calls from the remainder of the genotypes. In
addition, SNP rs201360779 was not a true singleton in AMBER,
having also been seen in one ER+ case.
The exome chip used here has inherent limitations. First and
most obvious, this array-based method includes only selected
rare variants and is therefore not as exhaustive as exome
sequencing in capturing rare exonic variants. Second, this chip
does not attempt to assay rare variation in noncoding regions.
Third, the chip was designed using exome sequencing data
from mostly European samples. Therefore, rare variants in
non-Europeans are not as well captured, and our data set may have
lacked information on some important rare SNPs in AA
popula-tions (
22
).
Another potential limitation of our study is a current
limi-tation of the field: the use of traditional methods such as PCA
(or linear mixed models) to adjust for population stratification
Ta
ble 4.
SNPs contributing to significant g
ene-based tests for ER− br
east cancer SNP rsID Function Fail r ate a MAF: anal ysis sample (%) b
MAFs: 1000G Phase 3
MAFs: NHLBI ESP
The 1
AMBER subject with one r
ar e allele Disease status Stud y Ag e at dia gnosis
% African ancestr
y c Gene PDE4D exm456537 rs201360779 Missense 0 0.01 Monomorphic e xce
pt in FIN (1%)
Monomorphic in
AAs; 0.05% in EAs
In vasi ve , ER−, PR−, HER2− BWHS 45 68.6 exm456565 rs200725508 Missense 0 0.01 No data Monomorphic in
AAs; 0.03% in EAs
In vasi ve , ER−, PR−, HER2− WCHS 61 99.6 Gene FBXL22 exm1168070 rs201654150 Missense 0 0.01 No data Monomorphic in
AAs; 0.02% in EAs
In vasi ve , ER−, PR−, HER2− BWHS 48 82.6 exm1168081 rs149590841 Missense 0 0.01 Monomorphic e xce
pt in ITU (0.5%)
Monomorphic in
AAs; 0.10% in EAs
In vasi ve , ER−, PR−, HER2− BWHS 35 61.8 AAs, African Americans; EAs, Eur opean Americans; ER−, estr og en r ece ptor ne gati ve; 1000G
, 1000 Genomes; HER2−,
human e
pidermal gr
owth factor r
ece
ptor 2 ne
gati
ve; FIN
, F
innish; ITU
, Indian
Telugu in the UK; NHLBI ESP
,
Na-tional Heart,
Lung,
and Blood Institute Exome Sequencing Pr
oject; PR−, pr og ester one r ece ptor ne gati ve .
aGenotyping fail r
ate in this stud
y.
bMinor allele fr
equenc
y in the
AMBER anal
ytic sample of ER− cases and contr
ols.
All four SNPs ha
ve an MAF ~0.01%,
whic
h corr
esponds to the pr
esence of one r
ar
e allele in one subject.
cPer
cent
African v
ersus Eur
opean ancestr
y as estimated b
y
ADMIXMAP (
51
) using 2624
AIMs (ancestr
y informati
in rare variant association studies. These methods may not
adequately control for population structure in some rare
vari-ant analysis settings; thus, the development of new methods for
this purpose is an area of active research (
23
).
We should also acknowledge that while our multiple
test-ing correction adjusted for the number of genes analyzed, there
were additional levels of testing that were not included in this
correction. Multiple outcomes (overall, ER+, ER− breast cancer)
and SNP functional groups (NS_all, NS_broad, NS_strict) were
also analyzed. We did not correct for the multiple breast cancer
outcomes because there was considerable overlap among the
groups of patients analyzed for overall, ER+ and ER− breast
can-cer, and we considered these to be tests of related hypotheses.
There was also a high amount of interdependence among the
three SNP functional groups, which would render a Bonferroni
correction overly conservative. Nevertheless, implementing an
adjustment for all of the ER− gene-based tests conducted across
the three SNP functional groups results in a corrected P value
of 0.035 for PDE4D, although the corrected P value for FBXL22
becomes non-significant (0.240).
In summary, an exome-wide gene-based analysis of rare
variants found significant associations between the PDE4D and
FBXL22 genes and ER− breast cancer in a collaborative study
of AA women. The previous GWAS finding of a breast
can-cer risk marker in the PDE4D gene supports the idea that rare
variants in this region in particular might affect breast cancer
risk. Replication is needed to confirm the gene-level
associa-tions reported here, which are based on very small counts at
extremely rare variants.
Supplementary material
Supplementary Tables 1–3
and
Figures 1
and
2
can be found at
http://carcin.oxfordjournals.org/.
Funding
This work was supported by the National Institutes of Health
(P01 CA151135 to C.B.A., J.R.P., and A.F.O., R01 CA058420 to L.R.,
UM1 CA164974 to L.R. and J.R.P., R01 CA098663 to J.R.P., R01
CA100598 to C.B.A., UM1 CA164973 to L.L.M., L.K.M., and C.A.H.,
R01 CA54281 to L.N.K., R01 CA063464 to B.H., P50 CA58223
to M.A.T. and A.F.O., U01 CA179715 to M.A.T. and A.F.O.); the
Department of Defense Breast Cancer Research Program, Era of
Hope Scholar Award Program (W81XWH-08-1-0383 to C.A.H.);
the Susan G. Komen for the Cure Foundation (to M.A.T. and
A.F.O.); the Breast Cancer Research Foundation (to C.B.A.); and
the University Cancer Research Fund of North Carolina (to
M.A.T. and A.F.O.).
Acknowledgements
Pathology data were obtained from numerous state cancer
reg-istries (Arizona, California, Colorado, Connecticut, Delaware,
District of Columbia, Florida, Georgia, Hawaii, Illinois, Indiana,
Kentucky, Louisiana, Maryland, Massachusetts, Michigan, New
Jersey, New York, North Carolina, Oklahoma, Pennsylvania,
South Carolina, Tennessee, Texas, Virginia). The results
reported do not necessarily represent their views or the views
of the NIH.
Conflict of Interest Statement: None declared.
References
1. Michailidou, K. et al. (2013) Large-scale genotyping identifies 41 new loci associated with breast cancer risk. Nat. Genet., 45, 353–361.
2. Michailidou, K. et al. (2015) Genome-wide association analysis of more than 120,000 individuals identifies 15 new susceptibility loci for breast cancer. Nat. Genet., 47, 373–380.
3. Lalloo, F. et al. (2012) Familial breast cancer. Clin. Genet., 82, 105–114. 4. Njiaju, U.O. et al. (2012) Genetic determinants of breast cancer risk: a
review of current literature and issues pertaining to clinical applica-tion: genetic determinants of breast cancer risk. Breast J., 18, 436–442. 5. Zheng, W. et al. (2009) Evaluation of 11 breast cancer susceptibility loci
in African-American women. Cancer Epidemiol. Biomarkers Prev., 18, 2761–2764.
6. Ruiz-Narváez, E.A. et al. (2010) Polymorphisms in the TOX3/LOC643714 locus and risk of breast cancer in African-American women. Cancer Epidemiol. Biomarkers Prev., 19, 1320–1327.
7. Barnholtz-Sloan, J.S. et al. (2010) FGFR2 and other loci identified in genome-wide association studies are associated with breast cancer in African-American and younger women. Carcinogenesis, 31, 1417–1423. 8. Hutter, C.M. et al. (2011) Replication of breast cancer GWAS suscepti-bility loci in the Women’s Health Initiative African American SHARe Study. Cancer Epidemiol. Biomarkers Prev., 20, 1950–1959.
9. Chen, F. et al. (2011) Fine-mapping of breast cancer susceptibility loci characterizes genetic risk in African Americans. Hum. Mol. Genet., 20, 4491–4503.
10. Zheng, Y. et al. (2012) Lack of association between common single nucleotide polymorphisms in the TERT-CLPTM1L locus and breast cancer in women of African ancestry. Breast Cancer Res. Treat., 132, 341–345.
11. Huo, D. et al. (2012) Evaluation of 19 susceptibility loci of breast cancer in women of African ancestry. Carcinogenesis, 33, 835–840.
12. Palmer, J.R. et al. (2013) Genetic susceptibility loci for subtypes of breast cancer in an African American population. Cancer Epidemiol. Biomarkers Prev., 22, 127–134.
13. Zheng, Y. et al. (2013) Fine mapping of breast cancer genome-wide association studies loci in women of African ancestry identifies novel susceptibility markers. Carcinogenesis, 34, 1520–1528.
14. Long, J. et al. (2013) Evaluating genome-wide association study-identi-fied breast cancer risk variants in African-American women. PLoS One, 8, e58350.
15. O’Brien, K.M. et al. (2014) Replication of breast cancer susceptibility loci in whites and African Americans using a Bayesian approach. Am. J. Epidemiol., 179, 382–394.
16. Haiman, C.A. et al. (2013) Genome-wide testing of putative functional exonic variants in relationship with breast and prostate cancer risk in a multiethnic population. PLoS Genet., 9, e1003419.
17. Panoutsopoulou, K. et al. (2013) In search of low-frequency and rare variants affecting complex traits. Hum. Mol. Genet., 22, R16–R21. 18. Apostolou, P. et al. (2013) Hereditary Breast Cancer: The Era of New
Sus-ceptibility Genes. BioMed Res. Int., 2013, 1–11.
19. Gudmundsson, J. et al. (2012) A study based on whole-genome sequenc-ing yields a rare variant at 8q24 associated with prostate cancer. Nat. Genet., 44, 1326–1329.
20. Loveday, C. et al. (2011) Germline mutations in RAD51D confer suscep-tibility to ovarian cancer. Nat. Genet., 43, 879–882.
21. Rafnar, T. et al. (2011) Mutations in BRIP1 confer high risk of ovarian cancer. Nat. Genet., 43, 1104–1107.
22. Lee, S. et al. (2014) Rare-variant association analysis: study designs and statistical tests. Am. J. Hum. Genet., 95, 5–23.
23. Auer, P.L. et al. (2015) Rare variant association studies: considerations, challenges and opportunities. Genome Med., 7, 16.
24. Palmer, J.R. et al. (2014) A collaborative study of the etiology of breast cancer subtypes in African American women: the AMBER consortium. Cancer Causes Control, 25, 309–319.
25. Newman, B. et al. (1995) The Carolina Breast Cancer Study: integrating population-based epidemiology and molecular biology. Breast Cancer Res. Treat., 35, 51–60.
26. Ambrosone, C.B. et al. (2009) Conducting molecular epidemiologi-cal research in the age of HIPAA: a multi-institutional case-control study of breast cancer in African-American and European-American Women. J. Oncol., 2009, 871250.
28. Rosenberg, L. et al. (1995) The Black Women’s Health Study: a follow-up study for causes and preventions of illness. J. Am. Med. Womens. Assoc., 50, 56–58.
29. Kolonel, L.N. et al. (2000) A multiethnic cohort in Hawaii and Los Ange-les: baseline characteristics. Am. J. Epidemiol., 151, 346–357.
30. Goldstein, J.I. et al. (2012) zCall: a rare variant caller for array-based genotyping: Genetics and population analysis. Bioinformatics, 28, 2543–2545.
31. The International HapMap Consortium (2005) A haplotype map of the human genome. Nature, 437, 1299–1320.
32. Grove, M.L. et al. (2013) Best practices and joint calling of the HumanEx-ome BeadChip: the CHARGE Consortium. PLoS One, 8, e68095. 33. Liu, X. et al. (2011) dbNSFP: a lightweight database of human
nonsynon-ymous SNPs and their functional predictions. Hum. Mutat., 32, 894–899. 34. Liu, X. et al. (2013) dbNSFP v2.0: a database of human non-synonymous SNVs and their functional predictions and annotations. Hum. Mutat., 34, E2393–E2402.
35. Patterson, N. et al. (2006) Population structure and eigencanalysis. PLoS Genet., 2, e190.
36. Purcell, S. et al. (2007) PLINK: a tool set for whole-genome associa-tion and populaassocia-tion-based linkage analyses. Am. J. Hum. Genet., 81, 559–575.
37. Lee, S. et al. (2012) Optimal unified approach for rare-variant asso-ciation testing with application to small-sample case-control whole-exome sequencing studies. Am. J. Hum. Genet., 91, 224–237.
38. Voorman, A. et al. (2012) seqMeta: an R package for meta-analyzing region-based tests of rare DNA variants. https://cran.r-project.org/web/ packages/seqMeta/index.html
39. Wu, M.C. et al. (2011) Rare-variant association testing for sequencing data with the sequence kernel association test. Am. J. Hum. Genet., 89, 82–93.
40. Purcell, S.M. et al. (2014) A polygenic burden of rare disruptive muta-tions in schizophrenia. Nature, 506, 185–190.
41. Kumar, P. et al. (2009) Predicting the effects of coding non-synonymous variants on protein function using the SIFT algorithm. Nat. Protoc., 4, 1073–1081.
42. Schwarz, J.M. et al. (2010) MutationTaster evaluates disease-causing potential of sequence alterations. Nat. Methods, 7, 575–576.
43. Chun, S. et al. (2009) Identification of deleterious mutations within three human genomes. Genome Res., 19, 1553–1561.
44. Adzhubei, I.A. et al. (2010) A method and server for predicting damag-ing missense mutations. Nat. Methods, 7, 248–249.
45. Gao, X. et al. (2008) A multiple testing correction method for genetic association studies using correlated single nucleotide polymorphisms. Genet. Epidemiol., 32, 361–369.
46. Liu, L. et al. (2013) Analysis of rare, exonic variation amongst subjects with autism spectrum disorders and population controls. PLoS Genet., 9, e1003443.
47. Ma, C. et al. (2013) Recommended joint and meta-analysis strate-gies for case-control association testing of single low-count variants: joint and meta-analysis of low-count variants. Genet. Epidemiol., 37, 539–550.
48. Lee, S. et al. (2015) An efficient resampling method for calibrating sin-gle and gene-based rare variant association analysis in case–control studies. Biostatistics. doi:10.1093/biostatistics/kxv033.
49. McVean, G.A. et al. (2012) An integrated map of genetic variation from 1,092 human genomes. Nature, 491, 56–65.
50. Exome Variant Server. NHLBI GO Exome Sequencing Project (ESP). 51. McKeigue, P.M. et al. (2000) Estimation of admixture and detection of
linkage in admixed populations by a Bayesian approach: application to African-American populations. Ann. Hum. Genet., 64, 171–186. 52. Antoniou, A.C. et al. (2010) A locus on 19p13 modifies risk of breast
cancer in BRCA1 mutation carriers and is associated with hormone receptor–negative breast cancer in the general population. Nat. Genet., 42, 885–892.
53. Stevens, K.N. et al. (2011) Common breast cancer susceptibility loci are associated with triple-negative breast cancer. Cancer Res., 71, 6240–6249. 54. Stevens, K.N. et al. (2012) 19p13.1 Is a triple-negative-specific breast
cancer susceptibility locus. Cancer Res., 72, 1795–1803.
55. Siddiq, A. et al. (2012) A meta-analysis of genome-wide association studies of breast cancer identifies two novel susceptibility loci at 6q14 and 20q11. Hum. Mol. Genet., 21, 5373–5384.
56. Garcia-Closas, M. et al. (2013) Genome-wide association studies iden-tify four ER negative–specific breast cancer risk loci. Nat. Genet., 45, 392–398.
57. Lin, D.C. et al. (2013) Genomic and functional characterizations of phosphodiesterase subtype 4D in human cancers. Proc. Natl. Acad. Sci. USA, 110, 6109–6114.
58. Beroukhim, R. et al. (2010) The landscape of somatic copy-number alteration across human cancers. Nature, 463, 899–905.