METAHEURISTIC BASED RELEVANCE FEEDBACK OPTIMIZATION WITH SUPPORT VECTOR MACHINE IN CONTENT BASED IMAGE RETRIEVAL
MUHAMMAD IMRAN
A thesis submitted in fulfilment of the requirements for the award of the degree of Doctor Of Philosophy in Information Technology
Faculty of Computer Science and Information Technology Universiti Tun Hussein Onn Malaysia
viii
ABSTRACT
ix
CONTENTS
DECLARATION ii
DEDICATION iii
ACKNOWLEDGEMENT iv
PUBLICATIONS v
ABSTRACT viii
CONTENTS ix
LIST OF TABLES xiii
LIST OF FIGURES xv
LIST OF SYMBOLS AND ABBREVIATIONS xix
LIST OF APPENDICES xx
CHAPTER 1 INTRODUCTION 1
1.1 Background of Study 1
1.2 Motivation 3
1.3 Objectives 5
1.4 Scope 5
1.5 Thesis Outline 6
CHAPTER 2 CONTENT BASED IMAGE RETRIEVAL 8
2.1 Introduction 8
2.2 An Overview of CBIR 8
2.3 Feature Extraction 10
2.3.1 Texture Features 10
2.3.2 Color Features 12
2.3.3 Shape Features 17
x
2.4.1 Mahalanobis Distance 19
2.4.2 Euclidean Distance 19
2.4.3 Manhattan Distance 20
2.4.4 Hausdorff Distance 20
2.4.5 Earth Movers Distance 21
2.5 Evaluation Methods 21
2.6 Related Work 22
2.6.1 Segmentation Based CBIR Techniques 22
2.6.2 Relevance Feedback 24
2.6.3 SVM Based Relevance Feedback 26
2.6.4 Graph Based RF 29
2.6.5 RF Through Evolutionary Approaches 30
2.7 Particle Swarm Optimization 31
2.7.1 PSO Variants 32
2.8 Support Vector Machine 33
2.9 Genetic Algorithm 34
2.10 Discussion and Research Gap 35
2.11 Summary 35
CHAPTER 3 METHODOLOGY 38
3.1 Introduction 38
3.2 Research Framework 38
3.2.1 Phase 1: Image Database 38
3.2.2 Phase 2: Feature Extraction (CLD-cw) 39 3.2.2.1 Color Feature Extraction 40 3.2.2.2 Texture Feature Extraction 41
3.2.3 Phase 3: Experimental Design 42
3.2.3.1 Similarity Measure and
Rele-vance Feedback 42
3.2.3.2 PSO-SVM-RF Approach 43
3.2.3.3 PSOGA-SVM-RF Approach 46 3.2.4 Phase 4: Evaluation and Validation 47
3.2.4.1 Precision 48
3.2.4.2 Recall 48
3.2.4.3 F-Score 49
3.3 Summary 49
CHAPTER 4 EXPERIMENTAL WORK FOR RELEVANCE
xi
4.1 Introduction 50
4.2 PSO-SVM-RF Approach 50
4.2.1 Color Feature Extraction 51
4.2.2 Texture Feature Extraction 53
4.2.3 Calculating Distance and User Feedback 54 4.2.4 Swarm Initialization and Fitness
Evalua-tion 54
4.2.5 Modification in PSO 56
4.2.6 Swarms Evolution and Termination
Crite-ria 57
4.3 PSOGA-SVM-RF 59
4.3.1 Construction of the Chromosomes 59
4.3.2 Population Evolution 60
4.4 Experimental Setup 60
4.4.1 Experimental Procedure 61
4.5 Summary 62
CHAPTER 5 RESULTS AND DISCUSSIONS 63
5.1 Introduction 63
5.2 Result of CLD-cw 63
5.2.1 Comparison of CLD-cw with previous
techniques 64
5.3 Result of PSO-SVM-RF 64
5.3.1 Precision 65
5.3.2 Recall and Standard Deviation 67 5.3.3 Performance Comparison of
PSO-SVM-RF 68
5.4 Result of PSOGA-SVM-RF 76
5.4.1 Precision 76
5.4.2 Recall and Standard Deviation 77 5.4.3 Performance Comparison of
PSOGA-SVM-RF 79
5.4.4 Performance Comparison Based on
F-Score 86
5.5 Performance Comparison of PSO-SVM-RF and
PSOGA-SVM-RF 87
5.6 Iteration Wise Comparison of PSO-SVM-RF and
PSOGA-SVM-RF with previous Techniques 94
xii
5.8 Summary 100
CHAPTER 6 CONCLUSION AND FUTURE WORK 101
6.1 Introduction 101
6.2 Feature Extraction Technique 101
6.3 Metaheuristic Algorithm based CBIR Scheme 101
6.4 Laplace Mutated PSO 102
6.5 Validation of the Proposed Techniques 103
6.6 Future Work 103
REFERENCES 104
Vita 123
Appendix A 117
xiii
LIST OF TABLES
5.1 Average Precision achieved by CLD-cw 64
5.2 Comparison of CLD-cw with previous techniques 64
5.3 Average Precision achieved by PSO-SVM-RF 65
5.4 Average Recall achieved by PSO-SVM-RF 67
5.5 Average Standard Deviation calculated for precision
achieved by PSO-SVM-RF 68
5.6 Average Precision achieved by PSOGA-SVM-RF 76
5.7 Average Recall achieved by PSOGA-SVM-RF 77
5.8 Average Standard Deviation calculated using Precision
achieved by by PSOGA-SVM-RF 78
5.9 Performance comparison based on F-Score 87
A.1 Average Precision of Each Method in top 10 Retrieval
Results 117
A.2 Average Precision of Each Method in top 20 Retrievals 117 A.3 Average Precision of Each Method in top 30 Retrievals 118 A.4 Average Precision of Each Method in top 40 Retrievals 118 A.5 Average Precision of Each Method in top 50 Retrievals 118 A.6 Average Precision of Each Method in top 60 Retrievals 118 A.7 Average Precision of Each Method in top 70 Retrievals 119 A.8 Average Precision of Each Method in top 80 Retrievals 119 A.9 Average Precision of Each Method in top 90 Retrievals 119 A.10 Average Precision of Each Method in top 100 Retrievals 119 B.1 Average Precision of Each Method in top 10 Retrieval
Results 120
B.2 Average Precision of Each Method in top 20 Retrieval
Results 120
B.3 Average Precision of Each Method in top 30 Retrieval
Results 121
B.4 Average Precision of Each Method in top 40 Retrieval
Results 121
B.5 Average Precision of Each Method in top 50 Retrieval
xiv
B.6 Average Precision of Each Method in top 60 Retrieval
Results 121
B.7 Average Precision of Each Method in top 70 Retrieval
Results 122
B.8 Average Precision of Each Method in top 80 Retrieval
Results 122
B.9 Average Precision of Each Method in top 90 Retrieval
Results 122
B.10 Average Precision of Each Method in top 100 Retrieval
xv
LIST OF FIGURES
1.1 CBIR - Flow Chart of General Retrieval Procedure [1] 3 1.2 Two images having similar textures and color statistics but
different in semantic meaning 4
2.1 The RGB Color Cube [2] 13
2.2 Hue, Saturation, and Value [2] 14
2.3 Architecture of ensemble SVM technique [3] 27
2.4 CBIR - Concept Map 36
3.1 Proposed Research Framework of the study 39
3.2 Sample Images from the Image Database 40
3.3 Color Feature Extraction Process 41
3.4 Wavelet Packets Decomposition at Level 3 42
3.5 Relevance Feedback Based Image Retrieval Procedure 43
3.6 PSO-SVM-RF Image Retrieval Approach 44
3.7 Modified PSO using Laplace Mutation 45
3.8 PSOGA-SVM-RF Image Retrieval Approach 46
3.9 Flow Chart of GA procedure used in this study 47
3.10 Correct and Incorrect labeling of an Image 48
4.1 Architecture of the proposed CBIR system 51
4.2 Input and output of each stage 52
4.3 Image Partitioning 52
4.4 Zigzag Scanning 52
4.5 Relevance Feedback Based Image Retrieval 55
4.6 Laplace probability density function 57
4.7 Architecture of the proposed PSOGA-SVM-RF Approach 59 5.1 Average Precision achieved by PSO-SVM-RF from top 10
to top 100 Retrievals 66
5.2 Average Precision achieved by PSO-SVM-RF for nTop
Retrievals 67
5.3 Performance Comparison of PSO-SVM-RF in top 10
Retrievals 69
5.4 Performance Comparison of PSO-SVM-RF in top 20
xvi
5.5 Performance Comparison of PSO-SVM-RF in top 30
Retrievals 70
5.6 Rerformance Comparison of PSO-SVM-RF in top 40
Retrievals 70
5.7 Performance Comparison of PSO-SVM-RF in top 50
Retrievals 71
5.8 Performance Comparison of PSO-SVM-RF in top 60
Retrievals 71
5.9 Performance Comparison of PSO-SVM-RF in top 70
Retrievals 72
5.10 Performance Comparison of PSO-SVM-RF in top 80
Retrievals 72
5.11 Performance Comparison of PSO-SVM-RF in top 90
Retrievals 73
5.12 Performance Comparison of PSO-SVM-RF in top 100
Retrievals 73
5.13 Average Precision achieved by PSOGA-SVM-RF for n Top
Retrievals 77
5.14 Recall and Standard Deviation from top 10 to top 100
Retrievals 78
5.15 Performance Comparison of PSOGA-SVM-RF in top 10
Retrievals 79
5.16 Performance Comparison of PSOGA-SVM-RF in top 20
Retrievals 79
5.17 Performance Comparison of PSOGA-SVM-RF in top 30
Retrievals 80
5.18 Performance Comparison of PSOGA-SVM-RF in top 40
Retrievals 80
5.19 Performance Comparison of PSOGA-SVM-RF in top 50
Retrievals 81
5.20 Performance Comparison of PSOGA-SVM-RF in top 60
Retrievals 81
5.21 Performance Comparison of PSOGA-SVM-RF in top 70
Retrievals 82
5.22 Performance Comparison of PSOGA-SVM-RF in top 80
Retrievals 82
5.23 Performance Comparison of PSOGA-SVM-RF in top 90
xvii
5.24 Performance Comparison of PSOGA-SVM-RF in top 100
Retrievals 83
5.25 Performance Comparison of PSOGA-SVM-RF in top 10
Retrievals 87
5.26 Performance Comparison of PSOGA-SVM-RF in top 20
Retrievals 88
5.27 Performance Comparison of PSOGA-SVM-RF in top 30
Retrievals 88
5.28 Performance Comparison of PSOGA-SVM-RF and
PSO-SVM-RF in top 40 Retrievals 89
5.29 Performance Comparison of PSOGA-SVM-RF and
PSO-SVM-RF in top 50 Retrievals 89
5.30 Performance Comparison of PSOGA-SVM-RF and
PSO-SVM-RF in top 60 Retrievals 90
5.31 Performance Comparison of PSOGA-SVM-RF and
PSO-SVM-RF in top 70 Retrievals 90
5.32 Performance Comparison of PSOGA-SVM-RF and
PSO-SVM-RF in top 80 Retrievals 91
5.33 Performance Comparison of PSOGA-SVM-RF and
PSO-SVM-RF in top 90 Retrievals 91
5.34 Performance Comparison of PSOGA-SVM-RF and
PSO-SVM-RF in top 100 Retrievals 92
5.35 Average Precision at different number of top retrievals in
First Iteration 94
5.36 Average Precision at different number of top retrievals in
Second Iteration 95
5.37 Average Precision at different number of top retrievals in
Third Iteration 95
5.38 Average Precision at different number of top retrievals in
Fourth Iteration 96
5.39 Average Precision at different number of top retrievals in
Fifth Iteration 96
5.40 Average Precision at different number of top retrievals in
Sixth Iteration 97
5.41 Average Precision at different number of top retrievals in
Seventh Iteration 97
5.42 Average Precision at different number of top retrievals in
xviii
5.43 Average Precision at different number of top retrievals in
xix
LIST OF SYMBOLS AND ABBREVIATIONS
CBIR – Content Based Image Retrieval PSO – Particle Swarm Optimization
SVM – Support Vector Machine
RF – Relevance Feedback
GA – Genetic Algorithm
EA – Evolutionary Approaches
AP – Average Precision
LLF – Low Level Features
HLS – High Level Semantics
QBE – Query by Example
ROI – Regions of Interest
xx
LIST OF APPENDICES
A Tabular Comparison of PSO-SVM-RF 117
CHAPTER 1
INTRODUCTION
1.1 Background of Study
In this era of information technology, personal as well as commercial image databases are increasing exponentially. Different areas such as entertainment, fashion design, art galleries, education, medicine and others are generating the large number of digital contents. These contents are stored in the form of images which is referred as image database. Currently, image database facility is frequently being used by several departments such as hospitals, surveillance, journalism, crime prevention and historical research for efficient service. For example, the department of forensic science preserves the criminals images, stolen items and crime scenes for the purpose of suspects identification and safety. Besides this, X-rays and Medical Resonance images (MRI) are kept for the purpose of medical diagnosis, research and monitoring in medical profession. Journalists generate the image database for different events and activities such as personalities, sports, buildings, products advertisements and many national & international events. Historical research also has image archives in different areas, for example, sociology, medicine and arts etc. For efficient services, it is very important that the process of storing and retrieving the images should be performed proficiently. Searching and retrieving the similar images from small image database is an easy task, but in case of large image database user faces the image retrieval problem. Hence, a well-organized and precise approach is required to solve the image retrieval problem. For this purpose currently two approaches are used which are text-based and content-based techniques. In text based approach, each image is indexed by a keyword, description or classification code, which is used to search the image throughout the retrieval process.
2
the user (the person searching for image from the database) may differ which can affect the retrieval accuracy. For example, if an image contains picture of car and building but annotated as “car”, when someone search based on keyword “car”, the image will be displayed although it might not be desired.
To solve this problem, Content Based Image Retrieval (CBIR) is used for improving the accuracy of image retrieval process and attaining the satisfaction of the user. CBIR searches the desired images using image contents based on the similarity rank. The prime objective of CBIR is to build significant descriptions of physical characteristic from images to assist efficient and effective retrieval [4]. Since last 2 decades, CBIR has become an emerging research area in the field of multimedia. In CBIR process, user inputs a query image to the system and system searches the similar images against query image from the image database and displays to the user. The tasks performed in CBIR process include extracting the image features using image pixels and similarity comparison between the query image & the database images. The similarity between images is measured based on the extracted image features. Image features are extracted in offline mode while image retrieval is performed in online mode. In CBIR, the features of all the images are extracted and stored as feature database. When a user submit query image to the retrieval system for searching desired image, the system computes the feature vector for the query image and then computes the distance between the feature vector of the query image and the feature database. Finally system ranks the results based on the similarity measure and displays the most relevant images to the user. For improving the CBIR’s performance, users can be involved for obtaining feedback during the retrieval process which is called Relevance Feedback (RF). The general concept of the CBIR using RF is illustrated in Figure 1.1. CBIR is useful for different applications for examples, a design engineer who wants to search the related design projects from his organization database for his new client requirements. To search from the project database of his organization for design projects similar to that required by his clients. Similarly, police needs to confirm the face of suspects from criminals image database. Before the approval of trademarks, it needs to search that whether the same or a similar one is already available or not. One of the important application area of CBIR is the medical science; some disease require the medical practitioner to search and review similar scanned images or X-rays of a patient before suggesting some solution.
3
[image:17.595.149.485.118.342.2]acceptable level of retrieval accuracy, higher number of feedback iterations is required. This leads to the need of further enhancements in RF.
Figure 1.1: CBIR - Flow Chart of General Retrieval Procedure [1]
1.2 Motivation
4
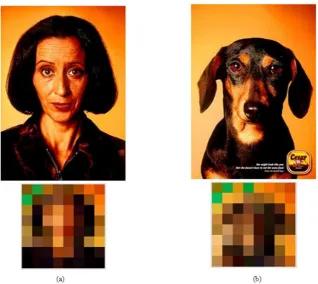
Figure 1.2: Two images having similar textures and color statistics but different in semantic meaning
One of the challenging problems of CBIR is to bridge the gap between LLF and HLS as shown in Figure 1.2, the visual features of human and the dog are very similar, but their semantic meanings are completely different that why for machine it is not easy to distinguish between these two figures. RF is a technique that is adopted from information retrieval to bridge this gap and enhance the performance of CBIR. The basic aim of RF is to distinguish the relevant and irrelevant images displayed by the system [8]. Various researchers [9, 10, 8] used different mechanism to improve the performance of RF based image retrieval systems. However, RF process needs large number of iterations to achieve desired results which can frustrate the user and also consumes excessive time. To overcome this problem, different machine learning techniques such as Mining User Navigation Patterns [9], Gaussian Mixture Modeltion for the uses [11] and SVM [8] are used for enhancing the performance of RF. Among these, SVM is the most popularly used technique which models the retrieval process as the classification problem and uses relevant and irrelevant images as training sets [12]. SVM based RF also has some limitations as highlighted by Bian and Tao et al. [12]. These are;
5
Therefore, the performance of the system may be poor with insufficient and inexactly labeled samples.
• SVMs optimal hyper plane may be biased when the positive feedback samples are much less than the negative feedback samples. In the relevance feedback process, there are usually many more negative feedback samples than positive ones. Because of the imbalance of the training samples for the two classes, SVMs optimal hyper plane will be biased toward the negative feedback samples. Consequently, SVM RF may consider many query irrelevant images as relevant ones.
Hence, for achieving the better performance of CBIR in any domain area these problems need to be addressed. Thus, this study focuses on addressing the problem of bridging the gap between the LLF and HLS. Also, the issues of SVM based RF CBIR techniques are addressed by evolving the training set and increasing the number of relevant images through stochastic nature of Particle Swarm Optimization (PSO). the purpose of using PSO in to increase the number of positive samples marked by the user.It will enable SVM to have larger relevant set for performing classification task. Besides that, this thesis also explores the combination of Genetic Algorithm (GA) with PSO to improve the performance of SVM based RF technique. The increased positive samples by PSO input to GA, where GA further increased the number of positive samples to have more larger training set for SVM.
1.3 Objectives
1. to develop a new signature scheme CLD-cw using Color Layout Descriptor and Coiflets Wavelets.
2. to develop a scheme using Particle Swarm Optimization, Support Vector Machine and Genetic Algorithm to improve the performance of CBIR.
3. to develop a Laplace mutated PSO for premature convergence of PSO.
1.4 Scope
6
from different classes such as, African peoples, Beaches, Buildings, Buses, Horses, Food, Mountains, Flowers, Elephant, Dinosaurs and others.
Though, there are various metrics available for measuring the performance of CBIR, however Precision, Recall and F-Score are widely adopted metrics [12, 10, 8]. Hence, in this thesis only Precision, Recall and F-Score are adopted as metrics for measuring the performance of proposed CBIR techniques.
1.5 Thesis Outline
The rest of the thesis is organized as follows. Chapter 2 summarizes the important aspects of CBIR and the primary research issues addressed in various research works related to CBIR. The core objective of this chapter is to provide the basis of CBIR to the readers of this thesis. Visual features to represent the images, similarity measure techniques and approach of results presentation and performance evaluation are discussed in this chapter. This chapter also discusses robust image retrieval and retrieval models, which are the topics to be investigated in this thesis.
In Chapter 3 research on feature aggregation for similarity is presented. A feature vector is proposed by combining the Color Layout Descriptor (CLD) and Coiflets wavelet. This chapter specifically focuses on the user involvement in the image retrieval process. The issues which appear as a hurdle in the success of RF based CBIR system have been addressed. In this regard problem of over sensitivity in subjective labeling is addressed which is a significant source of user frustration. The second problem which addressed in this thesis is the problem of enormously large imbalanced feedback for SVM based image retrieval. Particle Swarm Optimization is employed with support vector machines and user feedback to enhance the performance of CBIR. Retrieval is considered as an optimization problem where relevant output against any query image is subject to maximize.
The detail of the implementation is presented in chapter 4. The implementation of the visual features is discussed in detail and detailed architecture of the proposed solution is presented. Two approaches namely PSO-SVM-RF and PSOGA-SVM-RF are presented in this chapter. PSO-SVM-RF combined the PSO and SVM to improve the performance of RF. It is explained that how PSO helps SVM and RF to improve the performance of CBIR. In PSOGA-SVM-RF approach, GA is injected in PSO-SVM-RF approach, in this chapter it is described that how GA improve the performance of PSO-SVM-RF approach.
7
results obtained during the assessment process of PSO-SVM-RF and PSOGA-SVM-RF with other well known PSOGA-SVM-RF based CBIR system. The results are presented in the form of tables and graphs.
CHAPTER 2
CONTENT BASED IMAGE RETRIEVAL
2.1 Introduction
This chapter discusses the fundamental concepts of Content Based Image Retrieval (CBIR) and review relevant topics to provide the basis for this thesis. An overview of CBIR, feature extraction techniques, similarity measure techniques and the enhancements of CBIR are described in detail. In the context of feature extraction, the details of color, texture and shape features are elaborated. The discussion about similarity techniques is also provided. The enhancements of CBIR such as segmentation based CBIR techniques, Support Vector Machine (SVM) based CBIR and relevance feedback based CBIR techniques together with the concept of Particle Swarm Optimization (PSO) and SVM are also presented.
2.2 An Overview of CBIR
9
order to retrieve user desired images. For this, the researchers have proposed the use of CBIR to tackle image searching efficiently regardless of meta data and keywords.
CBIR system uses the actual image visual contents which can describe the image in better way for searching any image from large repositories and it does not require to use any keywords or associated meta data.
General retrieval procedure of CBIR system needs a query as input from the user. The query can be an image or sketch, for which user wants to search similar images from the image repository or from internet using search engine. There are two approaches of CBIR available to search an image as; (1) known as the reverse image search [13] and content matching [13]. In reverse image search approach, the system searches exact match of the query image. Various CBIR system such asTin eye (http://www.tineye.com/)employ this approach to display the exact match of the query image to the user available on the internet. On the other hand, in content matching approach, query image is treated as a sample image based on which, the system hunts for relevant images using the visual contents of the query image
CBIR system hunts the images from the image database with alike semantic sense. Usually LLF (visual features) are used to compute the similarity between the query image and the database images [13]. LLF are extracted for all available images in the database which are stored as feature database. When user input a query image to the system, system first extract the features of the query image and then find the similar images from image database, based on the visual features. For similarity measurement, distance between the database images and query images is computed which is known as similarity distance. The results are ranked and returned based on the similarity distance. To retrieve the most desired results, image retrieval process is enhanced by involving the user in retrieval process. System allows the user to record her/his feedback on relevant output; so that the image retrieval system can generate more accurate output.
In CBIR, query input is the fundamental need. There are several ways to represent the query. Usually, users provide an example image to the system, which is treated as the query image. This method of query input is called as Query by Example (QBE) scheme. The contents of this query image are considered as required information to be searched by the user. In QBE, image searching process begins immediately after extracting visual features from image where system displays various images similar to the example image used for searching. These images are displayed based on similarity measure. Datta et.al.[14] stated that query by example paradigm is the representative mean to query from a CBIR system.
10
are of user interest. Researchers named this technique as query by image region. To employ this approach, the retrieval systems use segmentation. Region based technique was introduced by Carson and Greenspan [15]. In this technique, when query image is loaded, user needs to mark her/his interested region to search from the image repository. Segmentation is used for image divisions into regions. Some CBIR systems do not rely on one image as query image but multiple examples are selected as query image [16]. In such systems, user selects multiple images and system further performs searching process by considering all the query images simultaneously.
In case, if example image is not available; then query by sketch is a beneficial technique to formulate the user query. Szanto et al. [17] presented sketch- based image retrieval system. This approach is helpful for the digital libraries, photo sharing sites and crime preventions. This approach is a good asset for the law enforcement agencies and forensics lab to catch suspects and identify victims. One example for potential applications of this technique is suspect identification when police department only has the sketch of the suspect to match from the forensic database.
2.3 Feature Extraction
When query image provided to the system for searching the similar images, the contents of the query image are described in term of LLF or visual features. The efficiency and effectiveness of the CBIR system highly depends on the quality of feature vector. Therefore, choosing appropriate visual feature is an important task in CBIR system. Inappropriate feature vector may results in slow and poor retrieval accuracy. Three types of LLF are used to describe the image content in the field of CBIR which are color features, texture features and shape features. In color feature, color histogram is most commonly used technique to describe the color characteristic of an image. Texture is the appearance of a surface which defines repeating patterns of local variation of pixel intensities [18]. Shape features are the best descriptors of the image to perform searching on a shape database. Following sub-sections present detailed discussion on these LLF which including their concept, applicability and use in various types of applications.
2.3.1 Texture Features
11
These texture features are efficient and can be applied for general purposes. These texture features have been proved very useful for the classification of image data. Experimental work on photomicrograph image set showed that 89% accuracy was achieved by using these texture features [19]. Texture is represented by two approaches as statistical and structural. Statistical methods include Fourier power spectra, co-occurrence matrices, shift-invariant principal component analysis (SPCA), Tamura feature, Wold decomposition, Markov random field, fractal model, and multi-resolution filtering techniques (such as Gabor and wavelet transform), characterize texture by the statistical distribution of the image intensity. Structural methods include morphological operator and adjacency graph which describe texture by identifying structural primitives and their placement rules. Structural methods tend to be most effective when applied regular textures [20]. Some of the texture features are elaborated below.
1. Tamura Features: Tamura et al. [21] proposed the textural features similar to human visual perceptions consisting of six features as regularity, coarseness, roughness, contrasts, line-likeness and directionality. These features are developed according to the psychological measurements and are visually meaningful to human [22]. Tamura feature are proved to be less effective when applied to natural scene image retrieval [23].
2. Gabor Filter Features : The Gabor filters have been extensively employed to compute features from images, particularly texture features [24]. The human visual system and orientation & frequency represented by the Gabor filter, are similar to each other. Gabor features have multi-resolution and multi-orientation properties and are suitable for texture illustration and discrimination [25]. One of the disadvantages of Gabor filter is that it is expensive in computation and may not be suitable for real time applications where efficiency is the essential requirement [26].
12
and sub sampling. which includes LL, LH, HL, and HH. These sub samples are resulted from wavelets Decomposition; where L represents lower frequency and H represent higher frequency where L represents lower frequency and H represent higher frequency. There are different types of wavelet transforms available, however for texture analysis, pyramid-structured wavelet transforms (PWT) and the tree structured wavelet transform (TWT) are widely used techniques. Usually, PWT is used to decompose LL band while TWT is used to collect information from LH, HL and HH bands as middle frequency channels contain imperative information. Wavelet features are broadly used in various image retrieval systems and results obtained through wavelets match with the results of human vision study [28, 27]. Wavelet transform are originally designed for rectangular images. The advantage of the wavelet transform over Gabor is that, its computation cost is very low [30].
In essence, it can be concluded that Tamura features are less effective for natural science images, while Gabor and wavelet transform both have multi resolution property but Gabor filters are computationally expensive, therefore wavelet transform can be the best choice for image retrieval system.
2.3.2 Color Features
Color is the most widely used visual content for the retrieval of images due to its in-dependency on size and orientation. Various color spaces are available to define the color features for different kinds of applications. Therefore, before studying color features, it is important to study about the color space.
Color space explains the range of the color. As each image is the combination of pixel values where every pixel value is considered as a point in the 3D color space. Usually the color spaces used for the image retrieval are RGB, CIE L*a*b*, HSV and CIE L*u*v*. Prior to select suitable color description, it is important to determine the color space.
13
Figure 2.1: The RGB Color Cube [2]
CIE L*u*v* and CIE L*a*b* color spaces depends on the device and are perceptually uniform. They are the combination of a luminance or lightness component (L) and two chromatic components a and b or u and v. CIE L*a*b* is developed to deal with subtractive coloring combination, while CIE L*u*v* is developed to deal with additive coloring combination. HSV or HSL is developed for the computer graphics and can describe color in a more instinctive means. HSV color space has three components as Hue, saturation (light) and value (brightness) as shown in Figure 2.2.
In HSV color space, Hue illustrates the shade of the color. Saturation demonstrates the purification of the hue with respect to white. While value, represents the brightness of the color. For example: If there is a full red color without any white in it, this red color is considered as completely saturated, if a little white is added with this red, the color will convert to pink but the hue will remain red with low saturation. Saturation is measured in percentage and its range is from 0 to 100. A full red without any white is 100% saturated. Through value, the level of brightness of any image is measured. Bright color reflects lot of light, while a dark color cannot such as if a completely red car is observed in day and night, during day it will look bright as compared to night time. It happens due to reasons that in night time, color reflects less light compared to day. Value is measured in percentage and the range of 0 to 100. The range represents the amount of light reflecting from the color. A color with red hue will look bright if value is high. If value is low, same color will look dark. The hue remains unchanged to the changes in light and directions of camera. Hence, it is more suitable for the retrieval of an object. Several color descriptors such as Color histogram, color correlogram, color moments and color coherence vector are discussed in following sub-section.
14
Figure 2.2: Hue, Saturation, and Value [2]
also described as red, green and blue for RGB color space [31] for any pixel of an image. Each component of color histogram can be defined by the distribution of the number of pixels for each quantized bin. If a color histogram contains more bins, it means it has more discrimination power. However, histogram having large number of bins not only expensive for computation, but inappropriate for efficient indexing. Use of opponent color space which allows the brightness of the histogram to reduce the image resolution is one of the ways of reducing the number of bins. Use of clusters to find out the k best colors in a known color space for available set of images is another way of reducing the number of bins. Each best color will be treated as the histogram bin. Another option is to select bins which have highest pixel numbers because most of the image pixels can be captured by the small number of bins which boosts up the performance of histogram.
15
2. Color Correlogram: Colors of any pixel pairs are in first two dimension of a three-dimensional histogram, while 3rd dimension is reserve for their spatial distance. To capture the spatial information along with color information Hung et al. [34] proposed the color correlogram. Color correlogram can be represented into a tabular form indexed by the color pairs, wherekth entry for
(x, y) stipulates the possibility of searching a pixel of color x and y from a distance k in image. One of the major drawbacks of the color correlogram is that it is expensive to compute [35]. Several researchers [36, 37] have used color correlogram for improving the performance of CBIR.
3. Color Moments: Color moments are the measures employed to distinguish images based on their color information. Flickner et al. [38] used color moments as the color feature vector to overcome the quantization effect of the color histogram. Color moments feature vector has lower feature vector dimensions than color histogram and color correlogram which makes it faster and need lower computational complexity. If the image contains multiple objects, then color moments are more effective. Variance, mean and skewness are first, second and third order color moments respectively. These are proved to be effective and efficient to represent compared to Color histogram [35]. Various research works [39, 40] have used color moments to improve the performance of CBIR. Mathematical representation of all three moments is presented from Equation 2.1 to Equation 2.3.
µi = 1
N
N
X
j=1
fij (2.1)
σi = 1
N
N
X
j=1
(fij −µi)
2 !12
(2.2)
si = 1
N
N
X
j=1
(fij −µi)
3 !13
(2.3)
where N represent the total number of image pixels, fij is the value of the ith
color component of the pixel j in image
16
[41]. Use of third moment order with first and second, it improves overall performance in comparison to use of only first and second order [41]. As, each color component has three moments therefore, color contents of every image is represented in only 9 numbers. This is a compact representation of the images comparing to other features. However, color moments extract only the initial color characteristic of the image [42] which is its drawback. Color moments are often used as first filter and then sophisticated set of color features is used for final retrieval.
4. Color Coherent Vector: Pass and Zabih [43] proposed the color coherence vector (CCV) to refine the color histogram for the image retrieval. The advantage of CCV over Color histogram is that it captures spatial information of the color and also prevents coherent pixels in one image from matching incoherent pixels in another [44]. However, CCV cannot elaborate the existence of dissimilarity between two images [45]. Main purpose of the CCV is to incorporate the spatial information into color histogram. In CCV histogram, bins are partitioned into two classes as coherent or in coherent. A bin is marked as coherent if it exists in large homogeneous colored regions otherwise marked as incoherent.
A CCV of an image can be defined as a vector ((α1, β1),(α2, β2)...(αN, βN)),
whereas(α1+β1, α2, β2...αN +βN)represent the color histogram of image.
whereαrepresent the coherent pixels andβ represent the incoherent pixels. CCV produce better results for image retrieval compared to color histogram as it can cope the spatial information, particularly in the case when image has uniform color or uniform texture. Additionally HSV color space give better results for color histogram and CCV than CIE L*u*v* and CIE L*a*b* space. Various research works [46, 47] have applied CCV to improve the performance of CBIR.
5. MPEG-7 Color Descriptors: The MPEG-7 Visual Standards specifies content based descriptors that allow users to measure similarity in images or video. Similarity is measured based on visual criteria, and can be used for efficient identification, filter, or browse images or videos based on visual content [48]. 7 has different descriptors for color, texture, shape and motion. MPEG-7 color descriptors include the color histogram, dominant color descriptor and color layout descriptors etc. Detail of the MPEG-7 color descriptors are discussed below.
17
• Color structure Descriptor (CSD): CSD is also a color histogram, defined in hue-max-min difference (HMMD) space to retrieve color distribution and localized spatial color structure from the images.
• Dominant Color Descriptor(DCD): Compactly describe the overall information of the representative colors of images. Opposite to the classical histogram based descriptors, color information is computed from each image instead of the color space, this help to calculate accurate and compact color information.
• Color Layout Descriptor (CLD): To describe the spatial distribution of color in an arbitrary shaped region the CLD is the best descriptor. Image is divided into 64 blocks and then through discrete cosine transform from each block of the image CLD is extracted.
Among these color descriptor CLD is a very compact and considered as fast descriptor for image retrieval [49]. It is designed to efficiently represent spatial distribution of colors.
2.3.3 Shape Features
Some CBIR systems employed the shape features along with color and texture features. To compute the shape features, usually segmentation is required, because shape features are calculated based on regions or objects. As segmentation is a difficult job and it is not easy to have robust and accurate segmentation, therefore use of the shape features for the process of image retrieval is limited. Usually applications, which have easily access to the objects or regions, used shape features. Few of the state of the art methods are finite element models [50], polygonal approximation [51], boundary-based [52], Fourier-based shape descriptors [53] and region-based methods [54]. Shape feature which are invariants to translation, rotation and scaling considered an excellent shape representation. This section, briefly described some of these shape features that have been commonly used in image retrieval applications.
18
2. Edge Histogram Descriptor : Edge Histogram Descriptor (EHD) is used to capture the journal image information and invariant to image translation and rotation. It is very useful for indexing and retrieving images. EHD is used by various researchers [58, 59] to improve the performance of CBIR. The drawback of the EHD is two visually dissimilar images can have similar edge histogram.
3. Turning Angles: The contour of a 2D object can be represented as a closed sequence of successive boundary pixels (xs,ys), where0≤s≤N −1and N is
the total number of pixels on the boundary. The turning function or turning angle θ(s), which measures the angle of the counter clockwise tangents as a function of the arc-length s according to a reference point on the objects contour, proposed by [60] is defined as:
θ(s) = tan−1
´ ys ´ xs ´
ys=
dys
ds
´
xs =
dxs
ds
(2.4)
The advantages of turning angles are is invariant under translation, rotation, and change of scale. However, one major problem with this representation is sensitive to small variations of shape and the choice of the reference point. If we shift the reference point along the boundary of the object by an amount t then the new turning function becomesθ(s+t). If we rotate the object by angle ω, then the new function becomes θ(s) +ω. Therefore, to compare the shape similarity between objects A and B with their turning functions, the minimum distance needs to be calculated over all possible shifts t and rotationsω, i.e.
dp(A, B) =
minω∈R,t∈[0,1] 1 Z
0
|θA(s+t)−θB(s)|pds
1
p
(2.5)
19
used Fourier features for the purpose of image retrieval.
2.4 Similarity Measures
A CBIR system computes the visual similarities among the query image and database images for searching the relevant images against a query image. As a result, several images are displayed according to their resemblance with the query image. The simplest way to calculate the similarity between images is calculating the distance between the query image features and database images features. Simple methods of distance measuring may not be effective to determine the relevant matches, therefore researchers proposed various techniques for similarity measure techniques, which are more effective. Distance measuring techniques frequently used by researchers are discussed in following subsections.
2.4.1 Mahalanobis Distance
The Mahalanobis distance (MD) was proposed by Professor P.C. Mahalanobis [66] to distinguish patterns of a certain group from another group. MD is a descriptive statistic that provides a relative measure of a data point’s distance from a common point. MD is suitable, when the feature vector dimensions are dependent of each other and is computed by Equation 2.6
Dist(x, y) =
q
(Fx−Fj)TC−1(Fx−Fy) (2.6)
where C represent the covariance matrix of the image feature vector. The advantage of MD is that, it takes into consideration the correlations between the variables and this consideration is very important in pattern analysis [67]. Different researchers [68, 69] have used MD to support the research work in the field of multimedia. However, the drawback of the MD is, it is not suitable for the noisy features [70].
2.4.2 Euclidean Distance
20
DistL2(x, y) = v u u t
n
X
i=1
(xi−yi)2 (2.7)
MARS [71] modified the Euclidean distance by adding weight component, the formula of modified Euclidean distance is given as:
DistL2(x, y) = v u u twi
n
X
i=1
(xi −yi)2 (2.8)
Euclidean distance is most frequently used similarity measure due to its simplicity; however it suffers from a high sensitivity [72]. Various research works [73, 74, 75] have used Euclidean distance to measure the similarity between the query image and database images.
2.4.3 Manhattan Distance
Manhattan distance or L1 metrics or city block metrics [76] is used to measure the distance between two points and is defined as
Dist(x, y) = n
X
i=1
|xi −yi| (2.9)
2.4.4 Hausdorff Distance
Daniel et al. [77] proposed Hausdorff Distance which is helpful for the region based image retrieval systems proposed. It is defined by Equation 2.10.
Dist(x, y) = max(maximinjD(x,yj), maxjminiD(yj, xi)) (2.10)
21
2.4.5 Earth Movers Distance
The Earth Mover’s Distance (EMD) is a method to evaluate dissimilarity between two multi-dimensional distributions which is initially proposed by Rubner et al. [81]. First time this technique first time used for the image retrieval was done by Rubner et al. [82]. The EMD is defined as
Dist(X, Y) = m
P
i=1
n
P
j=1 fijcij
m
P
i=1
n
P
j=1 fij
(2.11)
where X = (x1, wx1), ....(xm, wxm) and Y = (y1, wy1), ....(yn, wyn) where
xi and yi are the representatives of the clusters. Corresponding weights of clusters
are represented bywi and wj. Distance of two clusters are denoted by cij. fij is the
optional flow to convert distribution from X to Y. The advantage of EMD is it that naturally extends the notion of a distance between single elements to that of a distance between sets, or distributions, of elements. Beecks et al. [78] and Kundu et al. [83] used EMD for the purpose of image retrieval. The limitation of EMD is that it is very expensive in computation [84].
Kok’are et al. [85] and Vadivel et al. [86] through a comparative study of above similarity metrics notified that Manhattan distance has better performance over many other similarity measure techniques.
2.5 Evaluation Methods
A CBIR system can be evaluated by measuring its performance in term of accuracy (for example how many mistakes the image retrieval algorithm makes) and efficiency (such as how quickly does the system present the results). Different performance measures are available to evaluate the CBIR system such as precision, recall, precision-recall graph and others. Among these, precision and precision-recall are commonly adopted performance measures [87]. Precision indicates the percentage of relevant images from all retrieved images and is calculated by Equation 2.12.
P recision= Retrieved Relevant images
22
Recall = Retrieved Relevant Images
T otal Relevant Images in Database (2.13) The precision and recall measure the accuracy of image retrieval with relevancy to the query image and database images and two values are computed to show the effectiveness of image retrieval. However, these two measurements cannot be considered as complete accuracy for the effective image retrieval. Hence they can be combined to give a single value that describes the accuracy of image retrieval and this combination is called F-Score or F-measure to measure accuracy. Both precision and recall measurements are combined to compute the score and it is also called as a weighted average or harmonic mean of the precision and recall. F-Score can be defined as [88].
F −Score= 2× P recision.Recall
P recision+Recall (2.14) The F-score value is a single value that indicates the overall effectiveness of the image retrieval technique.
2.6 Related Work
Although researchers of multimedia pay much attentions to best describe the image using low level features, but only feature selection cannot fulfill the user requirements. To bridge the gap between high level semantics and low level features, several researchers have investigated different techniques such as Segmentation, Clustering, Relevance Feedback, Support Vector Machine, Evolutionary Computing and others. The techniques are discussed in detail in following subsections
2.6.1 Segmentation Based CBIR Techniques
23
Liu and Zhou [90] proposed texture-based segmentation for the content-based image retrieval. For feature extraction, image is divided into 4x4 blocks, than every block is processed using 2 level wavelet transform with Daubechies-4 filter. Two level wavelets transform results into 7 sub bands. To get the feature vector, mean and variance of each sub band is computed. On the basis of feature vector classification is performed and each block assigned to a class. Experiments were performed on a database containing total 250 texture images. The image having alike regions as of query image are displayed to the user. Wei et al. [91] performed filtering using Gaussian filter, then extracted features and used ISODATA clustering algorithm for segmentation. To make the segmentation process automatically they used dynamic parameter selection for the ISODATA clustering algorithm. They portioned the image into 4x4 blocks and used LUV color space to extract color features. For texture features they used the Daubchies-4 Wavelet transform. Finally to group the blocks into regions, ISODATA clustering algorithm was applied. To make the regions meaningful, the system searched for small regions and then add them to the nearest big region. This way fragments are eliminated. For semantic organization of the image contents, Chen et al. [92] proposed a segmentation technique based on combined color and texture features for the natural images. Instead of trying to identify the objects, the system actually tried to isolate the certain regions which are perceptual significant such as sky, mountains etc. On the basis of these regions, images can be classified to their respective classes. Segmentation was performed in two steps, i.e. firstly spatial texture features are combined with the color compositions for basic segmentation, secondly for perfect and exact border localization, elaborate border refinement procedure is used. Author used the multigrain region growing algorithm for segmentation. Combination of the color and texture spatial information made the segmentation robust and precise.
Zhang et al. [93] used segmentation to filter out the salient point features while preserving the diversity. First they introduced the new salient point feature vector. To reduce the salient point they applied the segmentation and salient point detection algorithm. To decrease the salient points, segmentation was applied as a mask. The presented technique preserves theksalient point in a segmented region, having utmost saliency value and drops the rest of salient point. They used the Haar wavelet based salient point features and set the value of k as 3. Sum of the wavelet coefficients are used as saliency value. For segmentation they used the clustering algorithm and grouped the similar pixels into one region.
24
semantic in an image. First of all they segment the image into uniform regions and then they used Expectation-Maximization technique to extract the color features from each region. Further they used SVM for the identification of activity scope of a region. They evaluate the presented methods through a number of experiments and found that proposed system outperformed than many previous works. Kam et al. [96] segmented the image to analyze the image up to object level. They proposed a CBIR system which is used to extract the objects from the image, as many users are interested in the objects available in the images. The segmentation performed was unsupervised using CIE L*a*b* color space for color features and wavelets coefficients as texture feature. They applied mean shift procedure for decomposition purpose. Once decomposition was done, author used Multiscale Random Field mode for further classification. Experiments were performed on natural images but the database size was very small. The main goal of the authors was to bridge the semantic gap but they achieved the goal up to some extent. The experiments performed, were very poor.
Suhasini et al. [97] proposed the graph based segmentation as a pre-processing step. In this technique, feature vector is extracted from the segmented images, where color features are extracted using color histogram and texture features were extracted through pyramid-structured wavelet. This technique does not combine the texture and color feature; instead they calculate the similarity measure separately for texture and color features and display results separately. It was notified that, color features perfumed well than texture approach. Reddy et al. [98] have used adaptive k-means algorithm to divide the image into segments. The image is divided into 4x4 blacks to extract color and texture features. In this approach, Color features were extracted using LUV color space due to its perceptually consistent nature. Block was decomposed into 2 x 2 frequency band by transforming up to one level through Daubechies-4 wavelet. For segmentation process the feature vector was divided into different clusters using k-means. Experiments are performed on remote sensing images.
2.6.2 Relevance Feedback
REFERENCES
1. Salamah, R. A. A. Efficient Content Based Image Retrieval. Master’s Thesis. Faculty of Engineering Computer Engineering Department Islamic University Gaza, Islamic University Gaza. 2010.
2. Bunks, C. and Kylander, K. Grokking the GIMP. New Riders. 2000.
3. Hoi, C.-H. and Lyu, M. R. Group-based relevance feedback with support vector machine ensembles. Pattern Recognition, 2004. ICPR 2004. Proceedings of the 17th International Conference on. IEEE. 2004, vol. 3. 874–877.
4. Antonelli, M., Dellepiane, S. and Goccia, M. Design and Implementation of Web-Based Systems for Image Segmentation and CBIR. IEEE Transactions on Instrumentation and Measurement, 2006. 55(6): 1869–1877. ISSN 0018-9456. doi:10.1109/TIM.2006.884286.
5. Zhou, X. S. and Huang, T. S. Relevance Feedback for Image Retrieval: A Comprehensive Review. ACM Multimedia Systems, April. 8: 536–544. 6. Zhang, L., Wang, L. and Lin, W. Generalized Biased Discriminant Analysis
for Content-Based Image Retrieval. IEEE Transactions on Systems, Man, and Cybernetics, Part B: Cybernetics, 2012. 42(1): 282–290. ISSN 1083-4419. doi:10.1109/TSMCB.2011.2165335. URLhttp://dx.doi.org/
10.1109/TSMCB.2011.2165335.
7. Zhao, L. and Tang, J. Content-based image retrieval using optimal feature combination and relevance feedback. International Conference on Computer Application and System Modeling (ICCASM). 2010, vol. 4. V4–436 –V4– 442. doi:10.1109/ICCASM.2010.5620791.
8. Yildizer, E., Balci, A. M., Hassan, M. and Alhajj, R. Efficient content-based image retrieval using Multiple Support Vector Machines Ensemble. Expert Systems with Applications: An International Journal ., 2012. 39(3): 2385– 2396. ISSN 0957-4174. doi:10.1016/j.eswa.2011.08.086. URL http://
dx.doi.org/10.1016/j.eswa.2011.08.086.
105
IEEE Transactions on Knowledge and Data Engineering, 2011. 23(3): 360– 372. ISSN 1041-4347. doi:10.1109/TKDE.2010.124.
10. Bul, S. R., Rabbi, M. and Pelillo, M. Content-based image retrieval with relevance feedback using random walks. Pattern Recognition, 2011. 44(9): 2109 – 2122. ISSN 0031-3203. doi:10.1016/j.patcog. 2011.03.016. URL http://www.sciencedirect.com/science/ article/pii/S0031320311001014, ¡ce:title¿Computer Analysis of Images and Patterns¡/ce:title¿.
11. Marakakis, A., Galatsanos, N., Likas, A. and Stafylopatis, A. Application of Relevance Feedback in Content Based Image Retrieval Using Gaussian Mixture Models. Tools with Artificial Intelligence, 2008. ICTAI ’08. 20th IEEE International Conference on. 2008, vol. 1. ISSN 1082-3409. 141–148. doi:10.1109/ICTAI.2008.110.
12. Bian, W. and Tao, D. Biased Discriminant Euclidean Embedding for Content-Based Image Retrieval. IEEE Transactions on Image Processing, 2010. 19(2): 545–554. ISSN 1057-7149. doi:10.1109/TIP.2009.2035223.
13. Zhang, J., Liu, X., Luo, J. and Lang, B. DIRS: Distributed image retrieval system based on MapReduce. Pervasive Computing and Applications (ICPCA), 2010 5th International Conference on. 2010. 93–98. doi: 10.1109/ICPCA.2010.5704081.
14. Datta, R., Joshi, D., Li, J. and Wang, J. Z. Image retrieval: Ideas, influences, and trends of the new age. ACM Comput. Surv., 2008. 40(2): 5:1–5:60. ISSN 0360-0300. doi:10.1145/1348246.1348248. URL http://doi.
acm.org/10.1145/1348246.1348248.
15. Carson, C., Belongie, S., Greenspan, H. and Malik, J. Blobworld: image segmentation using expectation-maximization and its application to image querying. IEEE Transactions on Pattern Analysis and Machine Intelligence, 2002. 24(8): 1026–1038. ISSN 0162-8828. doi:10.1109/TPAMI.2002. 1023800.
16. Abbadeni, N. An approach based on multiple representations and multiple queries for invariant image retrieval. Proceedings of the 9th international conference on Advances in visual information systems. Berlin, Heidelberg: Springer-Verlag. 2007, VISUAL’07. ISBN 3-540-76413-5, 978-3-540-76413-7. 570–579. URLhttp://dl.acm.org/citation.cfm?id=
1783294.1783358.
106
18. Chandankhede, P., Puranik, P. and Bajaj, P. Soft computing tool approach for texture classification using Discrete Cosine Transform.Electronics Computer Technology (ICECT), 2011 3rd International Conference on. 2011, vol. 4. 296–299. doi:10.1109/ICECTECH.2011.5941907.
19. Haralick, R., Shanmugam, K. and Dinstein, I. Textural Features for Image Classification. IEEE Transactions on Systems, Man and Cybernetics, 1973. SMC-3(6): 610–621. ISSN 0018-9472. doi:10.1109/TSMC.1973.4309314. 20. Shete, D. S. and Chavan, M. Content Based Image Retrieval: Review.
International Journal of Emerging Technology and Advanced Engineering, 2012. 2(9): 85–90. ISSN 2250-2459.
21. Tamura, H., Mori, S. and Yamawaki, T. Textural Features Corresponding to Visual Perception. IEEE Transactions on Systems, Man and Cybernetics, 1978. 8(6): 460–473. ISSN 0018-9472. doi:10.1109/TSMC.1978.4309999. 22. Wells, N. An Investigation into Texture Features for Image Retrieval.
Master’s Thesis. Faculty of Computer Science University of Bath, niversity of Bath, United Kingdom. 2006.
23. Liu, Y., Zhang, D., Lu, G. and Ma, W.-Y. A survey of content-based image retrieval with high-level semantics. Pattern Recognition, 2007. 40(1): 262– 282.
24. Daugman, J. Complete discrete 2-D Gabor transforms by neural networks for image analysis and compression. IEEE Transactions on Acoustics, Speech and Signal Processing, 1988. 36(7): 1169–1179. ISSN 0096-3518. doi: 10.1109/29.1644.
25. Abubacker, K. and Indumathi, L. K. Attribute associated image retrieval and similarity reranking. International Conference on Communication and Computational Intelligence (INCOCCI). 2010. 235–240.
26. Mikhail, M. and El Kaliouby, R. Detection of asymmetric eye action units in spontaneous videos. Image Processing (ICIP), 2009 16th IEEE International Conference on. IEEE. 2009. 3557–3560.
27. Yildizer, E., Balci, A. M., Jarada, T. N. and Alhajj, R. Inte-grating wavelets with clustering and indexing for effective content-based image retrieval. Knowledge-Based Systems, 2012. 31(0): 55 – 66. ISSN 0950-7051. doi:http://dx.doi.org/10.1016/j.knosys. 2012.01.013. URL http://www.sciencedirect.com/science/
article/pii/S0950705112000305.
107
29. Wavelet Transforms in MATLAB, 2013. URL http://www.
mathworks.com/discovery/wavelet-transforms.html.
30. Sifuzzaman, M., Islam, M. and Ali, M. Application of wavelet transform and its advantages compared to Fourier transform. Journal of Physical Sciences, 2009. 13: 121–134.
31. Zhang, Z., Li, W. and Li, B. An improving technique of color histogram in segmentation-based image retrieval. Fifth International Conference on Information Assurance and Security. IEEE. 2009, vol. 2. 381–384.
32. Suhasini, P., Krishna, K. and KRISHNA IV, M. CBIR USING COLOR HISTOGRAM PROCESSING. Journal of Theoretical & Applied Information Technology, 2009. 6(1).
33. Kumar, A. R. and Saravanan, D. Content Based Image Retrieval Using Color Histogram. International Journal of Computer Science and Information Technologies, 2013. 4(2).
34. Huang, J., Kumar, S., Mitra, M., Zhu, W.-J. and Zabih, R. Image indexing using color correlograms. Computer Vision and Pattern Recognition, 1997. Proceedings., 1997 IEEE Computer Society Conference on. 1997. ISSN 1063-6919. 762–768. doi:10.1109/CVPR.1997.609412.
35. Huang, Z.-C., Chan, P. P., Ng, W. W. and Yeung, D. S. Content-based image retrieval using color moment and Gabor texture feature. International Conference on Machine Learning and Cybernetics. IEEE. 2010, vol. 2. 719– 724.
36. Rasheed, W., An, Y., Pan, S., Jeong, I., Park, J. and Kang, J. Image Retrieval Using Maximum Frequency of Local Histogram Based Color Correlogram. International Conference on Multimedia and Ubiquitous Engineering, 2008. 2008. 62–66. doi:10.1109/MUE.2008.27.
37. Park, J., Han, S. and An, Y. Heuristic Features for Color Correlogram for Image Retrieval. International Conference on Computational Sciences and Its Applications. 2008. 9–13. doi:10.1109/ICCSA.2008.50.
38. Flickner, M., Sawhney, H., Niblack, W., Ashley, J., Huang, Q., Dom, B., Gorkani, M., Hafner, J., Lee, D., Petkovic, D., Steele, D. and Yanker, P. Query by image and video content: the QBIC system. Computer, 1995. 28(9): 23–32. ISSN 0018-9162. doi:10.1109/2.410146.
39. Velmurugan, K. and Baboo, L. D. S. S. Content-based image retrieval using SURF and colour moments. Global Journal of Computer Science and Technology, 2011. 11(10).
108
41. Kousalya, S. and Thananmani, A. S. Similarity of Image Multiple Feature Extraction and Retrieval Perspectives. International Journal of Advanced Research in Computer and Communication Engineering, 2013. 2(9).
42. Xue, B. and Wanjun, L. Research of Image Retrieval Based on Color. International Forum on Computer Science-Technology and Applications. 2009, vol. 1. 283–286. doi:10.1109/IFCSTA.2009.74.
43. Pass, G. and Zabih, R. Histogram refinement for content-based image retrieval. Applications of Computer Vision, 1996. WACV ’96., Proceedings 3rd IEEE Workshop on. 1996. 96–102. doi:10.1109/ACV.1996.572008. 44. Vatamanu, O. A., Frandes, M., Ionescu, M. and Apostol, S. Content-Based
Image Retrieval using Local Binary Pattern, Intensity Histogram and Color Coherence Vector. E-Health and Bioengineering Conference. IEEE. 2013. 1–6.
45. Al-Hamami, A. and Al-Rashdan, H. Improving the Effectiveness of the Color Coherence Vector. International Arab Journal of Information Technology (IAJIT), 2010. 7(3).
46. Al-Hamami, A. and Al-Rashdan, H. Improving the Effectiveness of the Color Coherence Vector. International Arab Journal of Information Technology (IAJIT), 2010. 7(3).
47. Roy, K. and Mukherjee, J. Image Similarity Measure using Color Histogram, Color Coherence Vector, and Sobel Method. International Journal of Science and Research (IJSR), 2013: 2319–7064.
48. Salembier, P., Sikora, T. and Manjunath, B. Introduction to MPEG-7: multimedia content description interface. John Wiley & Sons, Inc. 2002. 49. Jalab, H. A. Image retrieval system based on color layout descriptor and
Gabor filters. IEEE Conference on Open Systems (ICOS). IEEE. 2011. 32– 36.
50. Sclaroff, S. and Pentland, A. Modal matching for correspondence and recognition. IEEE Transactions on Pattern Analysis and Machine Intelligence, 1995. 17(6): 545–561. ISSN 0162-8828. doi:10.1109/34. 387502.
51. Arkin, E., Chew, L., Huttenlocher, D., Kedem, K. and Mitchell, J. An efficiently computable metric for comparing polygonal shapes. IEEE Transactions on Pattern Analysis and Machine Intelligence, 1991. 13(3): 209–216. ISSN 0162-8828. doi:10.1109/34.75509.
52. Jagadish, H. V. A retrieval technique for similar shapes. SIGMOD Rec., 1991. 20(2): 208–217. ISSN 0163-5808. doi:10.1145/119995.115821. URL
http://doi.acm.org/10.1145/119995.115821.
109
comparison of autoregressive and Fourier-based descriptors in 2D shape classification. IEEE Transactions on Pattern Analysis and Machine Intelligence, 1995. 17(2): 201–207. ISSN 0162-8828. doi:10.1109/34. 368168.
54. Yang, L. and Albregtsen, F. Fast computation of invariant geometric moments: a new method giving correct results. Pattern Recognition, 1994. Vol. 1 - Conference A: Computer Vision amp; Image Processing., Proceedings of the 12th IAPR International Conference on. 1994, vol. 1. 201–204 vol.1. doi:10.1109/ICPR.1994.57625.
55. Hu, M.-K. Visual pattern recognition by moment invariants. Information Theory, IRE Transactions on, 1962. 8(2): 179–187. ISSN 0096-1000. doi: 10.1109/TIT.1962.1057692.
56. Maitra, S. Moment invariants. Proceedings of the IEEE, 1979. 67(4): 697– 699. ISSN 0018-9219. doi:10.1109/PROC.1979.11309.
57. Mindru, F., Tuytelaars, T., Gool, L. V. and Moons, T. Moment invariants for recognition under changing viewpoint and illumination. Computer Vision and Image Understanding, 2004. 94(1): 3–27.
58. Dubey, R. S., Choubey, R. and Bhattacharjee, J. Multi Feature Content Based Image Retrieval. International Journal on Computer Science & Engineering, 2010. 2(6).
59. Agarwal, S., Verma, A. and Singh, P. Content Based Image Retrieval using Discrete Wavelet Transform and Edge Histogram Descriptor. Information Systems and Computer Networks (ISCON), 2013 International Conference on. IEEE. 2013. 19–23.
60. Arkin, E., Chew, L., Huttenlocher, D., Kedem, K. and Mitchell, J. An efficiently computable metric for comparing polygonal shapes. IEEE Transactions on Pattern Analysis and Machine Intelligence,, 1991. 13(3): 209–216. ISSN 0162-8828. doi:10.1109/34.75509.
61. Brandt, S., Laaksonen, J. and Oja, E. Statistical shape features for content-based image retrieval. Journal of Mathematical Imaging and Vision, 2002. 17(2): 187–198.
62. Zahn, C. T. and Roskies, R. Z. Fourier descriptors for plane closed curves. IEEE Transactions on Computers, 1972. 100(3): 269–281.
63. Tolstoy, L. Application of Fourier Descriptors and Neural Network to Shape Recognition. 2002. doi:https://www-n.oca.eu/Bijaoui/doc ab/Bib ab0402/ leonid.pdf.
110
65. Zhang, G., Ma, Z., Tong, Q., He, Y. and Zhao, T. Shape Feature Extraction Using Fourier Descriptors with Brightness in Content-Based Medical Image Retrieval. Intelligent Information Hiding and Multimedia Signal Processing, 2008. IIHMSP ’08 International Conference on. 2008. 71–74. doi:10.1109/ IIH-MSP.2008.16.
66. Mahalanobis, P. C. On the generalized distance in statistics. Proceedings of the National Institute of Sciences (Calcutta), 1936. 2: 49–55.
67. Cudney, E. A., Hong, J., Jugulum, R., Paryani, K. and Ragsdell, K. M. An evaluation of Mahalanobis-Taguchi system and neural network for multivariate pattern recognition. Journal of Industrial and Systems Engineering, 2007. 1(2): 139–150.
68. Ramaswamy, S. and Rose, K. Fast adaptive mahalanobis distance-based search and retrieval in image databases. 15th IEEE International Conference on Image Processing. IEEE. 2008. 181–184.
69. Rajakumar, K. and Muttan, S. MRI Image Retrieval Using Wavelet with Mahalanobis Distance Measurement. Journal of Electrical Engineering & Technology, 2013. 8(5): 1188–1193.
70. Kapoor, S., Khanna, S. and Bhatia, R. Facial gesture recognition using correlation and mahalanobis distance. International Journal of Computer Science and Information Security, 2010. 7(2): 267–272.
71. Rui, Y., Huang, T., Ortega, M. and Mehrotra, S. Relevance feedback: a power tool for interactive content-based image retrieval. IEEE Transactions on Circuits and Systems for Video Technology, 1998. 8(5): 644–655. ISSN 1051-8215. doi:10.1109/76.718510.
72. Wang, L., Zhang, Y. and Feng, J. On the Euclidean distance of images. IEEE Transactions on Pattern Analysis and Machine Intelligence, 2005. 27(8): 1334–1339.
73. Qian, G., Sural, S., Gu, Y. and Pramanik, S. Similarity between Euclidean and cosine angle distance for nearest neighbor queries. Proceedings of the 2004 ACM symposium on Applied computing. ACM. 2004. 1232–1237. 74. Rajakumar and Muttan. A Framework For Mri Image Retrieval Using
Curvelet Transform And Euclidean Distance. Journal of Computer Science, 2013. 9(3): 285–290.
75. Kekre, H. and Mishra, D. Content Based Image Retrieval Using Full Haar Sectorization. International Journal of Image Processing (IJIP), 2011. 5(1): 1.
76. Swain, M. J. and Ballard, D. H. Color indexing. International journal of computer vision, 1991. 7(1): 11–32.
111
images using the Hausdorff distance. IEEE Transactions on Pattern Analysis and Machine Intelligence, 1993. 15(9): 850–863.
78. Beecks, C., Uysal, M. S. and Seidl, T. A comparative study of similarity measures for content-based multimedia retrieval. IEEE International Conference on Multimedia and Expo (ICME). IEEE. 2010. 1552–1557. 79. Olszewska, J. and Wilson, D. Hausdorff-distance enhanced matching of Scale
Invariant Feature Transform descriptors in context of image querying. IEEE 16th International Conference on Intelligent Engineering Systems (INES), 2012. 2012. 91–96. doi:10.1109/INES.2012.6249.
80. Rotter, P., Skulimowski, A. M., Kotropoulos, C. and Pitas, I. Fast shape matching using the Hausdorff distance. Mirage: Computer Vision/Computer Graphics Collaboration Techniques and Applications, INRIA Rocquencourt, France (March 2005), 2005.
81. Rubner, Y., Tomasi, C. and Guibas, L. J. A metric for distributions with applications to image databases.Sixth International Conference on Computer Vision. IEEE. 1998. 59–66.
82. Rubner, Y., Tomasi, C. and Guibas, L. J. The earth mover’s distance as a metric for image retrieval. International Journal of Computer Vision, 2000. 40(2): 99–121.
83. Kundu, M. K., Chowdhury, M. and Banerjee, M. Interactive image retrieval using M-band wavelet, earth movers distance and fuzzy relevance feedback. International Journal of Machine Learning and Cybernetics, 2012. 3(4): 285–296.
84. Shirdhonkar, S. and Jacobs, D. W. Approximate earth movers distance in linear time. IEEE Conference on Computer Vision and Pattern Recognition, 2008.IEEE. 2008. 1–8.
85. Kokare, M., Chatterji, B. and Biswas, P. Comparison of similarity metrics for texture image retrieval. TENCON 2003. Conference on Convergent Technologies for the Asia-Pacific Region. IEEE. 2003, vol. 2. 571–575. 86. Vadivel, A., Majumdar, A. and Sural, S. Performance comparison of distance
metrics in content-based image retrieval applications.Proc. of Internat. Conf. on Information Technology, Bhubaneswar, India. 2003. 159–164.
87. Banerjee, M., Kundu, M. K. and Maji, P. Content-based image retrieval using visually significant point features. Journal of Fuzzy Sets and Systems, 2009. 160(23): 3323–3341. ISSN 0165-0114. doi:10.1016/j.fss.2009.02.024. URL
http://dx.doi.org/10.1016/j.fss.2009.02.024.
![Figure 1.1: CBIR - Flow Chart of General Retrieval Procedure [1]](https://thumb-us.123doks.com/thumbv2/123dok_us/8763531.895195/17.595.149.485.118.342/figure-cbir-flow-chart-general-retrieval-procedure.webp)
![Figure 2.1: The RGB Color Cube [2]](https://thumb-us.123doks.com/thumbv2/123dok_us/8763531.895195/27.595.211.415.78.230/figure-the-rgb-color-cube.webp)
![Figure 2.2: Hue, Saturation, and Value [2]](https://thumb-us.123doks.com/thumbv2/123dok_us/8763531.895195/28.595.210.416.75.232/figure-hue-saturation-and-value.webp)
