2017 2nd International Conference on Computer Science and Technology (CST 2017) ISBN: 978-1-60595-461-5
A Collaborative Filtering Recommendation
Algorithm-based on User Attribute and Rating
Yu-liang SHI
1and Jian ZHENG
2,a1,2School of Beijing University of Technology, Beijing, China
Keywords: Recommendation algorithm, Collaborative Filtering, User similarity,
Improvement of similarity
Abstract. Collaborative Filtering recommendation is one of the most widely used recommendation systems in e-commerce recommendation systems. However, because of the growing number of users and goods, the recommended quality of traditional collaborative filtering technology is getting lower and lower. In this paper, we propose a method of Similarity Measurement Based on User - Attribute and User - Score to improve the accuracy of similarity calculation between users. First, this method calculates the similarity of user attribute and the similarity of user rating. Next, we combine the two similarities into the new similarity measure based on weighted fusion. Finally, we incorporate this similarity measure into the traditional collaborative filtering algorithm and improve the recommended quality. The experimental results show that the presented algorithm can improve the recommendation accuracy and produce a better recommendation results.
Introduction
Since the 20th century, internet technology and e-commerce have developed rapidly; it made the expression of the information on the net. The function of personalized recommendation which can help users to find information more exact and quickly. And the core of it--recommended algorithm has aroused general concern from academic circles to industrial circles. Up to date, the research of recommended algorithm has got a series of research production data matrix.
But, with the growing amount of data, the data matrix becomes sparse, it seriously affected the truth and recommended space. The result of traditional recommended algorithm has which computed on the high-dimensional sparse matrix is not accuracy. In my thesis, I devote a kind of collaborative filtering recommendation algorithm which can improve measure, imitate by experiment and similarity. According to the relevant evaluation criteria to assess and I find that this algorithm can partly improve the recommendation quality and efficiency.
Traditional Collaborative Filtering Algorithm
Traditional Collaborative Filtering Algorithm Based on Users
1) Construct of users-projects rating matrix
Firstly, collect evaluation records, then quantify them and clean the junk. So the original data is D={U,I,R}.U={user1,user2,user3,……,userm} represents collection
of users, I={Item1,Item2,Item3,……,Itemn}represents collection of projects, R is
rating matrix for every project. Rij is the grade made by No.i user to No.j item.
2)Looking for nearest neighbor
At first, we should compute the similarity between target and all users. Then choose K highest similarity neighbor set as collection V. We can use Pearson correlation
coefficient [2] (2-1), Cosine similarity[3](2-2),or Modified cosine similarity[4](2-3) to calculate the level. In this formula, riu,rju express the scores by user No.i and
userNo.j. express the average rating of user No.i and userNo.j. S express item’s
collection which had been rated by user No.i and userNo.j.
∈ ∈ ∈ − − − − = S u j ju S u i iu S u j ju i iu r r r r r r r r 22 ( )
) ( ) )( ( j) sim(i, (2-1) 2 2 ) ) ( ) ( ( ) , cos( ) , (
∈ ∈ ∈ = = S u ju S u iu S u ju iu r r r r J I j isim (2-2)
∈ ∈ ∈ − − − − = S u j ju S u i iu S u j ju i iu r r r r r r r r 22 ( )
) ( ) )( ( j) sim(i, (2-3)
3)Make a list of recommendation
We can use nearest neighbor rating data to calculate predicted result of unrated item by target, and also rank grade from higher to lower. Then select top-n as a list. The corresponding calculation method be shown in formula, among this pui means
predicted ratings pui with (2-4)
∈ ∈ − × + = V v V v v vi u ui v u sim R R v u sim R p |) ) , ( (| ) ( ) , ( (2-4)Traditional Collaborative Filtering Algorithm Based on Users
1) Construct of users-projects rating matrix
Firstly, collect evaluation records, then quantify them and clean the junk. So the original data is D={U,I,R}.U={user1,user2,user3,……,userm} represents collection
of users, I={Item1,Item2,Item3,……,Itemn} represents collection of projects, R is
rating matrix for every project. Rij is the grade made by No.i user to No.j item.
2)Looking for similarity item
At first, we should compute the similarity between target and all item. Then choose K most similaritem set as collection V. We can use Pearson correlation coefficient (2-1),
i
Cosine similarity (2-2), or Modified cosine similarity (2-3) to calculate the level. In this formula, riu,rju express the scores by item No.i and item No.j. express the
average rating of No.i and userNo.j. S express item’s collection. 3)Make a list of recommendation
We can use nearest neighbor item to calculate predicted result of unrated item by target, and also rank grade from higher to lower. Then select top-n as a list. The corresponding calculation method be shown in listing, among this pui means
predicted ratings Pui with (2-4)
Improved Algorithm Based on the Collaborative Filtering Algorithms An Improved Method Which can Measure Similarity
Leads in the similarity of.There are many basic users' information, just as ages, gender, and type of work and so on. In the paper [5], they improve a different processing mode for different property to calculate the similarity. On the above basis, I will further improve users' similarity .Firstly, I split users' information into each type, one is quantitative attribute another one is categorical attributes. We presents a new user attributes similarity metering scheme (3-1) base on this division.
∈ ∈
= ×
=
Ud k
k k
Ud k
jk
ik a a a
a sim v
u
s( , ) ( , ) ω( ); ω( ) 1 (3-1)
Among this, Ud means the attribute set of users. sim(aik,ajk)means the similarity
of users No.i and user NO.j in attribute K. ω(ak) is weight of attribute K ,the weight
originates statistics which provided by domain expert. According to above, we can divide it into two methods:
(1)If the attribute is quantitative attribute, the similarity computation method as follow.
1 | |
1 )
, (
+ − =
jk ik jk ik
a a a a
sim (3-2)
(2)If it is categorical attribute, we should consider the potential semantic relevance between each classification .Then build a classification of semantic hierarchy tree which is based on domain knowledge. The leaves of the tree are different attribute value, the similarity between all attribute correspond to the position of leaf node in the book as shown in type (3-3).l(aik,ajk) is the longest distance
between two leaf nodes. H is the height of the whole tree.
H a a l a
a
sim( ik, jk)=1− ( ik, jk) (3-3)
Similarity Improvement Scheme. When dealing with the similarity of users, traditional collaborative filtering algorithms do not consider the attribute of users. So when we calculate the similarity of user, we can use the user attributes to improve accuracy. The paper proposes an improved algorithm based on user rating and user properties. Firstly the similarity degree of user properties is computed with (3-1) and the User - Attribute matrix. And then we calculate the traditional collaborative filtering algorithm with Modified cosine similarity (2-3) and User-Item Score matrix. Finally, we get a new similarity degree of user by incorporating attributes similarity measure into the traditional collaborative filtering algorithm with (3-4).
i
) , ( )
, ( ) 1 ( ) ,
(u v S u v sim u v m
si ′ = −α +α (3-4)
The Process of Recommending Algorithm
The target user u calculate the degree of similarity between the target user and all users according to the improved user similarity algorithm (3-4). And then we find the k-nearest neighbor sets V= {u1, ui2 , ……, uk} with the highest similarity. The set V
satisfies the condition that all users in this set has the highest similarity of target user. So we can calculate the project forecast points which have not been rated by the target user with points of users in sets V. And we Sort data from high to low. With the project forecast points we can get the top-n projects as a list of recommendations to the target user. In this paper we calculate the project forecast points with (3-5)
∈ ∈
− × +
=
V v V v
v vi u
ui
v u sim
R R v u sim R
p
|) ) , ( (|
) (
) , (
(3-5)
Simulation Dataset
We use the MovieLens collaborative filtering dataset of 10 M as the testing data set, which was collected by the GroupLens Research Project at the University of Minnesota (http://www.grouplens.org). This data set consists of 10000054 ratings from 71567 users on 10681 movies in the online movie recommendations service MovieLens. In addition, it is assured that each user, who has rated 20 movies at least, is selected at random. The ratings are given on the scale of 1 to 5.Attributes of all users, including age, gender, occupation, address, etc., provided in the data set. These users attribute information weights are set to [0.4, 0.3, 0.2, 0.1] according to Document [6].
Evaluation
MAE was used in this study, the mean absolute error (MAE) is dedicated to calculating the average absolute difference between predicted ratings and actual ratings. MAE is defined as (4-1)
) (
| |
) (
, ,
v I
R P
MAE t I v
t v t v
∈
−
= (4-1)
The lower MAE is, the better effectiveness of the algorithm has.
Experimental Results
Compared
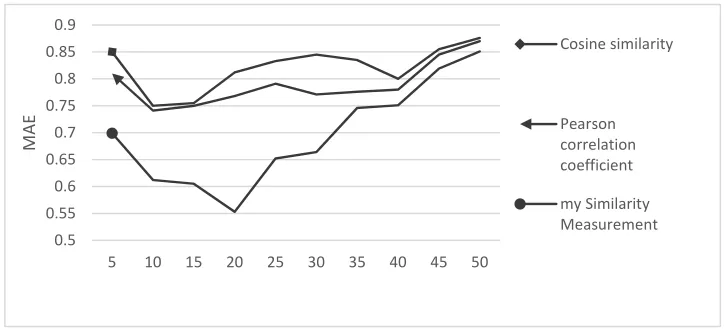
[image:5.612.126.495.93.245.2]In this paper, we choose the two similarity algorithms of Pearson correlation coefficient and Cosine similarity in the traditional collaborative filtering algorithm to compare the results. Experimental results shown in Figure 2, the MAE value of the improved algorithm has been the smallest, The improved algorithm have can enhance the recommendation performance effectively.
Figure 2. Experimental results.
Conclusions
This paper presents a new user similarity metering scheme, which incorporating attributes similarity measure into the traditional collaborative filtering algorithm. When calculating the similarity between users, we take full account of the impact of user attribute similarity. We can get more accurate user similarity. Simulations show that the improved algorithm can enhance the recommendation performance effectively compared with traditional algorithms.
0.71 0.715 0.72 0.725 0.73 0.735 0.74 0.745
0.1 0.2 0.3 0.4 0.5 0.6 0.7 0.8 0.9
MAE
MAE
0.5 0.55 0.6 0.65 0.7 0.75 0.8 0.85 0.9
5 10 15 20 25 30 35 40 45 50
MAE
Cosine similarity
Pearson correlation coefficient
my Similarity Measurement
α MAE
0.1 0.7380 0.2 0.7301 0.3 0.7250 0.4 0.7230 0.5 0.7252 0.6 0.7304 0.7 0.7351 0.8 0.7390 0.9 0.7415
[image:5.612.129.491.371.537.2]References
[1] Resnick, P., Iacovou, N., Suchak, M., et al. GroupLens: an open architecture for collaborative filtering of Netnews [C] ∥ Proc. of ACM 1994 Conference on Computer Supported Cooperative Work. Chapel Hill: ACM Press
[2] G. Adomaviciusi, A. Tuzhilin. Toward the Next Generation of Recommender Systems: A Survey of the State-of-the-Art and Possible Extensions, IEEE Trans. on Knowl. and Data Eng., vol. 17, iss. 6, pp. 734-749
[3] N. J. Belkin, W. B. Croft. Information filtering and information retrieval: twosides of the same coin?, Commun. ACM, vol. 35, iss. 12, pp. 29-38
[4] R. Burke. Hybrid Recommender Systems: Survey and Experiments, UserModeling and User-Adapted Interaction, vol. 12, iss. 4, pp. 331-370
[5] WU, YiFan, WANG Haoran, Collaborative filtering algorithm using user background information[J]. Journal of Computer Applications