ISSN: 1992-8645 www.jatit.org E-ISSN: 1817-3195
RESOURCE MANAGEMENT IN COMPUTATIONAL GRID
WITH ECONOMIC BASED ALLOCATION MODEL USING
PARTICLE SWARM OPTIMIZATION (PSO)
1R.VENKATESAN, 2K. THANUSHKODI 1
Assistant Professor, The School of Computer Science and Technology, Karunya University 2
Director, Akshaya College of Engineering and Technology, Coimbatore
E-mail: [email protected] , [email protected]
ABSTRACT
In grid environment, based on economic model, grid users who submit jobs and grid resource providers who provide resources have different motivations. Due to autonomy of both in gird users and resource providers, their objectives often conflict. This paper, review the Literature studies and techniques to solve the grid resource allocation problem. The problem of allocating resources in Grid environment requires the definition of a model that allows in considerable level in the code of allocating right resources to right jobs, poor economic model to communicate in order to achieve an efficient management of the resources themselves. Some of the drawbacks occur during grid resource allocation are low utilization, less economic reliability and increased waiting time of the jobs. Hence in this paper, the efficiency of the resource allocation mechanism is improved by proposing one allocation model. The allocation model technique which is presented in this paper has used the Particle Swarm Optimization (PSO) to overcome all the above mentioned drawbacks. This model also considers the economic reliability and this model overcomes the poor economic model drawback that is in the existing method. The economic based model is implemented and experimented with different number of jobs and resources. The proposed model has also been compared with the conventional resource allocation models in terms of utilization, cost factor, failure rate and make span.
Keywords: Resource Allocation, Genetic Algorithm, Grid Environment, Allocation based on With Penalty
Function (AP)
1. INTRODUCTION
In computing, the study on ‘‘Grids’’ has come to an area of dynamic concern [1]. By enabling seamless integration of computing systems and clusters, data storage, specialized networks and sophisticated analysis and visualization software, the grid concept has recently emerged as a vision of future network based computing [2]. For wide area distributed computing, the revaluation in field of computer science and business, communication, and storage technologies, Grid computing is quickly rising as the conquered model [3]. The Grid is an infrastructure which involves the integrated and shared use of computers, networks, databases and scientific instruments owned and managed by various organizations [4].
In Grid computing, the resources should be pooled in a set of classes like, CPU cycles, disk space, memory space, network bandwidth, and specialized processing power [5]. Using their inactive cycles, the Grid computing System
In Grid computing system, resource management is a middleware. Security is a most important concern in a large-scale wide-area system like Grid [10]. The resource management in Grid computing systems challenges due to geographical distribution of resources, resource heterogeneity, autonomously administered Grid domains having their own resource policies and practices, and Grid domains using different access and cost models [11]. For resource allocation in grid computing, three types of agents work in Resource allocation, namely resource brokering agents (RBAs), job agents (JAs), and resource monitoring agents (RMAs) [12]. In both Computer Science and Economics, allocation of resources is a vital concern. An allocation means a particular distribution of resources among agents [13]. For example, an allocation is a partition of the set of resources among the agents, in the case of non sharable indivisible resources. Set of resources allocated to a particular agent is also called the bundle assigned to that agent [14]. Plenty of researches have been performed on the resource allocation in grid environment. Few recent works related to this resource allocation in the literature are reviewed in the following section 2.
2. RELATED WORKS
Sarbani Roy et al. [16] have discussed that in
Grid computing, it is provided uniform access to heterogeneous resources closely-held by multiple organizations. The system hundreds and standing of the resources additionally amendment of times. Thus, a resource broker was an important element in an exceedingly Grid environment which was assist within the choice of a right resource supplier for employment all told aspects. In this proposed
method, they discussed the planning and
implementation of resource brokering ways inside the multi-agent framework. These ways facilitate to find out associate degree best allocation of resources for corporal punishment multiple concurrent jobs in an exceedingly Grid surroundings. Totally different stages in resource brokering and their implementation within the framework area unit mentioned.
Wei-Chang Yeh et al. [17] have discussed that
Grid computing is a permutation of parallel and distributed computing. In this proposed method, an economic-based resource allocation model to derive the service reliability of Grid-computing from cellular automata Monte-Carlo simulation (CA-MCS) for the service level agreement, and to evaluate total rental-time cost of Grid resources by
virtual payment assessment for the free rider problem. This proposed method, they converted the Grid system into the multi-state unreliable network in advance, and then the transforms network facilitates the CA-MCS to simulate the service reliability. To economize on total rental-time cost and ensure the Grid-computing service being dependable, this proposed method a binary-code Genetic Algorithm (bGA) and an integer-code Particle Swarm Optimization (iPSO), in which both consider Elite-selected and Reborn (ER) mechanisms, to explore the resource allocation in the light of cost-effectiveness and guaranteed reliability.
Li Chunlin et al. [18] have proposed an ad hoc
grid resource management system, the producers and consumers of ad hoc grid resource were modeled as the self-interested decision-makers described in microeconomic theory. All market participants in the ad hoc grid environment including grid resources and services could be represented as agents. They applied economic agents to build ad hoc grid resource management, where ad hoc grid resource consumers and providers can buy and sell ad hoc grid resource based on an underlying economic architecture. The experiments were conducted to compare ad hoc grid resource allocation algorithm with other ad hoc grid resource allocation algorithm.
Ali Sarhadi [19] has discussed that the most important objective of load balancing was to supply a distributed, low cost method that balances the load across all the resources. Effective and efficient load balancing algorithms were essentially important, to develop the global throughput of Grid resources. With the plan of load balancing, the paper identifies the issues in task mapping based on ant colony algorithm. Computer simulations have been used to demonstrate the efficiency of the proposed method. The results of the model have exposed that the performance of proposed algorithms has a noteworthy improvement.
Thenmozhi et al. [20] considered the node
ISSN: 1992-8645 www.jatit.org E-ISSN: 1817-3195
ratio, throughput and delay against the rate of success.
The aim of this study is too established to implement the resource allocation in grid environment. However, resource allocation based on economic scheduling, resource insufficiency for executing jobs in conventional resource allocation techniques are stagnant with key problematic in the literary works. To avoid this drawback, we propose resource allocation model based on economic factor and Particle Swarm Optimization. The complete description of the proposed resource allocation model is given in Section 3 with view of an architectural model of the resource allocation mechanism and finally the instant of involvement of PSO is described. Section 4 discusses the implementation results and the result is examined with different resources and jobs. In Section 5 conclusion of the paper is given. This paper presents a brief discussion on various heuristics and their importance in grid environment.
3. PROPOSED MECHANISM FOR RESOURCE ALLOCATION IN GRID ENVIRONMENT
Like the traditional resource allocation mechanism, here, we used Job and Resource pools as the sources of allocation in the proposed architectural view, which is depicted in Fig 1. Subsequently, a PSO block is used to select the resources for the economic model.
Fig.1. Proposed Resource Allocation Mechanism Procedure
In this proposed application, we assume the job task pool. The tasks of user are denoted
byTij,j=1,2,3,...mi, where
m
ithe total numberof jobs in the pool is contains three field mainly: job identity number, execution time and economic significance of job within the job pool, which will
be symbolized as T= {(
n
DR
T ), (
n ET
T
),(
n
ES
T )}:n=1,2,Nj and
N
j (=T ) representsthe dimensions of task pool. Correspondingly, the
resource on which task T needs to be executed. In
this method resource pool also contains three field mainly Identification number, Volume of
performing a job and cost to be given to obtain
m
thresource in the resource pool, which will be
symbolized as (
m
ID
R ), (
m
v
R ),
(
m c
R
)}:m
=1,2,Mj, andM
j(= R)represents the size of
R
i.e. number of resources inthe pool.
3.1 Resource Allocation Economic model
economic allocation model. In this application three allocation functions are proposed to allocate the resources namely, Job Completion function, Job-Resource mate Penalty function and Job’s waiting standing function. This model simply stimulates right resource to the proper job in terms of price i.e. the many job with a lesser quantity of frugally is strictly forbidden for exclusive resources. So as to accomplish this, performance is introduced with the next two economic constraints.
) ( * m n c ES R T > φ (1) ) ( * m n c ES R
T >Σ Σ
η (2)
The constriction in eq. (1) deals with the single level of economic limitations i.e. it will be allocating economic match with the each job pool and individual resource allocation for pacts of economic matching level, while the constraint in eq. (2) deals with the total level of economic limitations i.e. the allocation of economic match for all jobs within the whole job pool with the all resources that area unit allotted for pacts of whole economic level. The model consider the resources by the Job Completion allocation function and Job-Resource mate Penalty allocation function, the additional exactly appropriate resources are allotted to the jobs by minimizing the Job-Resource mate Penalty function, that is given below.
Job Completion allocation functions: This function evaluates the resource allocation by allowing the resource capacity
m
C
R and job
length
n
ET
T . The Job Completion function is
responsible for neither allocating the high capacity resource nor allocating the low capacity resource to the submitted jobs. The job completion time for the
th
n job in mth resource is calculated by using the
developed Job Completion function (
F
1) which isspecified below,
∑
= = j z n N n v ET R T F 1 1 log (3)Where,
p
value is based on executed on particlessize andz∈Mj..
Job’s Waiting Standing Function: This Job’s Waiting Standing function agreements with minimizing the waiting time of every job.
{
}
∉ =∑
= = − otherwise T R R R T f N R R l ET n x x x x ET n l x n x l n ; , ; ) ( ) ( ; 2 , 1 ) 1 ( ) 1 ( ) ( (4)∑
= = N n n f F 12 (5)
Job-Resource Mate Penalty: Job-Resource Mate
Penalty function evaluates the function F3 based on
their speed at executing a job.
2 )
( 1 2
3 S S
F = + (6)
∑
= = j N n n h S 11 (7)
− ≥ ℵ = otherwise R T R T if N h z n z n c ES c ES j n ; ) * ( )) ) * ( ; 1 φ φ (8) − ≥ ℵ = ∑ ∑ ∑ = = = otherwise R T R T if S z j n j z j n c N n ES N n c N n ES ; * * ; 1 1 1 2 η η (9)
Where
φ
,
η
are constants andz c
R
is theth
z
resource’s budget.The Allocation based on Penalty Function appraises the allocation using Job Completion function, Job’s Waiting Standing Function and finally using Job-Resource Mate Penalty functions.
3.2 PSO-Based Allocation Mechanism
The proposed allocation model relies on the satisfaction of the economic constraints as well as the validation by the allocation functions. The input of resources for the allocation of jobs is required from resource pool as well as from job pool. Hence, PSO is utilized in finding the appropriate resources that can satisfy the constraints and can obtain validity from the model functions. The procedures that are involved in PSO operation are discussed below.
Particles generation
ISSN: 1992-8645 www.jatit.org E-ISSN: 1817-3195
) ... , ,
(G1G2 G3 Gi
G=
i
= 1, 2, 3……N
where, glb<gi<gub (10)
Where, G is a particle,
g
lb and pub are upperand lower bound values of the number of particles. The randomly generation of initial particles size
N
i.e.N
is randomly generated within theinterval
[
1,Mr]
. Hence each particle has a velocitywhich can be represented as
) ... ,
,
(H1 H2 H3 Hi
H =
=
i 1, 2, 3 ……N Hmin <Hi<Hmax (11)
Velocity is represented as H, Hminand Hmaxis
the minimum and maximum values of velocity respectively. The all particles are done in above specified particular intervals, no one particles does not exceed the specified interval. Before each and every iteration if we check the particles intervals. The checking process represented as follows,
If (n 1) max( 1)
i ) 1 ( max ) 1 ( H , + + +
+ > n = n
n
i H then H
H And if ) 1 ( min 1) (n i ) 1 ( min ) 1 ( H , + + +
+ < n = n n
i H then H
H (12)
(12) The duplication does not exist in the generation
of particles i.e. the same element are not present in a particle, if we must check the duplication in the PSO process.
Evaluation function
The evaluation values are calculated for each individual particle to determine the optimal solution. The result of fitness values for all particles, the maximum fitness value is selected as an optimum value, the optimum value initially in pbest (flocal) value and so far gbest (fglobal) value.
Evaluation value can be calculated by,
3 2 1 3 F F F F + +
= (13)
where,
1
F → is the value from Job Completion function.
2
F → is the value from Job’s Waiting Standing
Function
3
F → is the value from Job-Resource Mate
Penalty function.
Initial iteration the values of velocity are assigned as zero. Use the randomly generated and initial velocity of particle to find the fitness values of these particles. We define pbest and gbest values
from this fitness result, pbest value is called local best and gbest value is called global best.
All particles have fitness values evaluated by the fitness function to be optimized, and have velocities. The particles fly through the problem space by following the current optimum particles. After finding the best values every particle tries to modify its position and velocity. To modify its position uses two data. First one is the distance between the current particle position and pbest and second one is the distance between the current position and gbest. This modification can be represented by the velocity. Velocity of each particle can be modified by the following equation 14. ) ( ) ( ) ( ) ( ) ( 2 2 ) ( 1 1 ) ( ) 1 ( n i i n i i n i n i c bglobal R L c blocal R L H H − ∗ ∗ + − ∗ ∗ + = + (14)
c
i(n+1)=
c
i(n)+
H
i(n+1) (15)In the above equation
) (n i
H
→ is the velocity of ith particle at iterationn
2 1,L
L → are commonly referred as the learning
factors
2 1,R
R → are random numbers generated in the
range of [0, 1]
blocal →is the position of the best fitness value of the particle at the current iteration
bglobal→ is the position of the particle with the
best fitness value in the swarm )
(n i
c → is the current position of the particle
i
atiteration n
Each particle knows its best value (pbest) and its position. Moreover, each particle knows the best value in the group (gbest) among the p bests. Particles update their position and velocity for each iteration until it reaches the termination criteria. This process will be repeated until the maximum number of iterations is reached. Once the maximum number of iterations is produced the process will be terminated. The last solution pointing the particle is considered as the accurate resources can be selected for the resource allocation process.
4. IMPLEMENTATION RESULTS
(version 7.10) with system specifications, Intel (R) core i5 CPU @ 3.20GHz and 4GB RAM. The performance of the technique was analyzed by executing with different synthetic job datasets, and the obtained results are evaluated. In this Section, firstly we describe numerically analyzed dataset and its generation, secondly we analyze the results and finally, the technique is compared with the existing resource allocation techniques between the proposed method and the existing scheduling
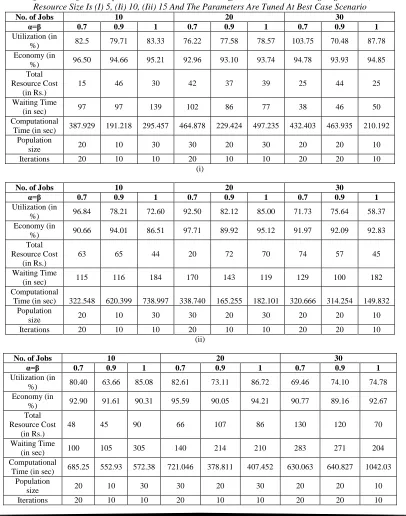
[image:6.612.106.512.229.745.2]algorithms. Our proposed model based on economic Allocation model is analyzed with the varying the Job lengths and various resource sizes. The utilized the performance analysis such as Utility, Economy and Total Resource cost, Processing time and Computational time. For different resource sizes, job lengths and weightage values presentation of Allocation model results are specified in below tables.
Table 1. Performance Of Our Proposed Allocation Model With Different Job Size And Weightage Values, When The Resource Size Is (I) 5, (Ii) 10, (Iii) 15 And The Parameters Are Tuned At Best Case Scenario
No. of Jobs 10 20 30
α=β 0.7 0.9 1 0.7 0.9 1 0.7 0.9 1
Utilization (in
%) 82.5 79.71 83.33 76.22 77.58 78.57 103.75 70.48 87.78
Economy (in
%) 96.50 94.66 95.21 92.96 93.10 93.74 94.78 93.93 94.85
Total Resource Cost
(in Rs.)
15 46 30 42 37 39 25 44 25
Waiting Time
(in sec) 97 97 139 102 86 77 38 46 50
Computational
Time (in sec) 387.929 191.218 295.457 464.878 229.424 497.235 432.403 463.935 210.192 Population
size 20 10 30 30 20 30 20 20 10
Iterations 20 10 10 20 10 10 20 20 10
(i)
No. of Jobs 10 20 30
α=β 0.7 0.9 1 0.7 0.9 1 0.7 0.9 1
Utilization (in
%) 96.84 78.21 72.60 92.50 82.12 85.00 71.73 75.64 58.37
Economy (in
%) 90.66 94.01 86.51 97.71 89.92 95.12 91.97 92.09 92.83
Total Resource Cost
(in Rs.)
63 65 44 20 72 70 74 57 45
Waiting Time
(in sec) 115 116 184 170 143 119 129 100 182
Computational
Time (in sec) 322.548 620.399 738.997 338.740 165.255 182.101 320.666 314.254 149.832 Population
size 20 10 30 30 20 30 20 20 10
Iterations 20 10 10 20 10 10 20 20 10
(ii)
No. of Jobs 10 20 30
α=β 0.7 0.9 1 0.7 0.9 1 0.7 0.9 1
Utilization (in
%) 80.40 63.66 85.08 82.61 73.11 86.72 69.46 74.10 74.78
Economy (in
%) 92.90 91.61 90.31 95.59 90.05 94.21 90.77 89.16 92.67
Total Resource Cost
(in Rs.)
48 45 90 66 107 86 130 120 70
Waiting Time
(in sec) 100 105 305 140 214 210 283 271 204
Computational
Time (in sec) 685.25 552.93 572.38 721.046 378.811 407.452 630.063 640.827 1042.03 Population
size 20 10 30 30 20 30 20 20 10
ISSN: 1992-8645 www.jatit.org E-ISSN: 1817-3195
(iii)
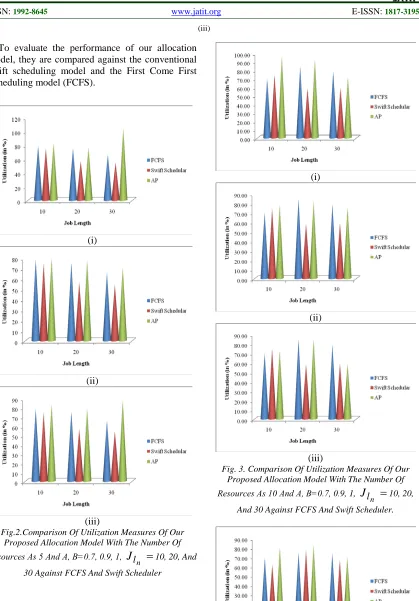
To evaluate the performance of our allocation model, they are compared against the conventional swift scheduling model and the First Come First Scheduling model (FCFS).
(i)
(ii)
[image:7.612.102.521.70.671.2](iii)
Fig.2.Comparison Of Utilization Measures Of Our Proposed Allocation Model With The Number Of Resources As 5 And Α, Β=0.7, 0.9, 1,
=
n
l
J
10, 20, And 30 Against FCFS And Swift Scheduler(i)
(ii)
(iii)
Fig. 3. Comparison Of Utilization Measures Of Our Proposed Allocation Model With The Number Of Resources As 10 And Α, Β=0.7, 0.9, 1,
=
n
l
J
10, 20, [image:7.612.314.521.74.540.2](i)
(ii)
(iii)
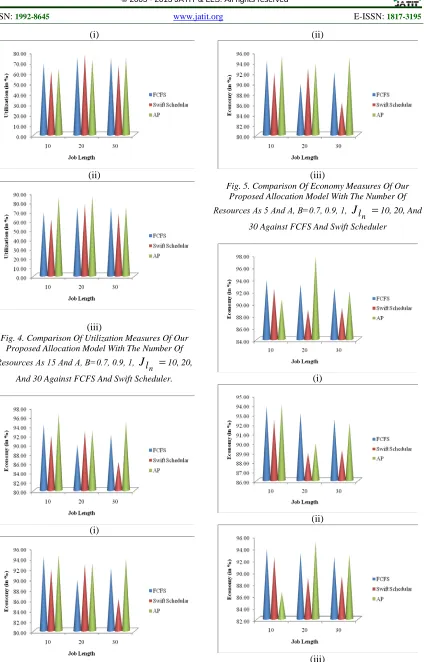
Fig. 4. Comparison Of Utilization Measures Of Our Proposed Allocation Model With The Number Of Resources As 15 And Α, Β=0.7, 0.9, 1,
=
n
l
J
10, 20,And 30 Against FCFS And Swift Scheduler.
(i)
(ii)
[image:8.612.100.524.65.727.2](iii)
Fig. 5. Comparison Of Economy Measures Of Our Proposed Allocation Model With The Number Of Resources As 5 And Α, Β=0.7, 0.9, 1,
=
n
l
J
10, 20, And 30 Against FCFS And Swift Scheduler(i)
(ii)
ISSN: 1992-8645 www.jatit.org E-ISSN: 1817-3195
Fig. 6. Comparison Of Economy Measures Of Our Proposed Allocation Model With The Number Of Resources As 10 And Α, Β=0.7, 0.9, 1,
=
n
l
J
10, 20,And 30 Against FCFS And Swift Scheduler
(i)
(ii)
[image:9.612.309.519.74.525.2](iii)
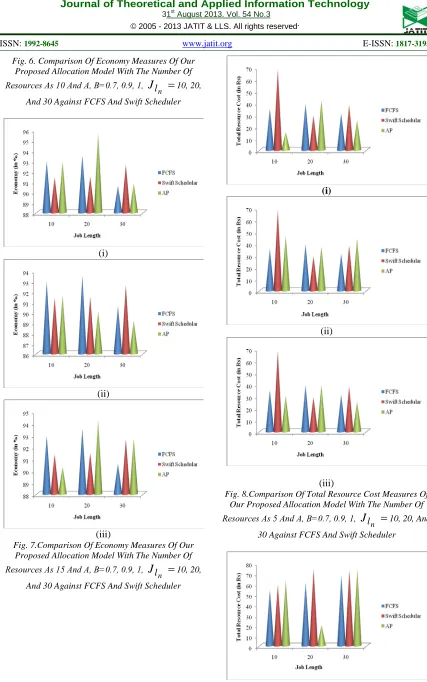
Fig. 7.Comparison Of Economy Measures Of Our Proposed Allocation Model With The Number Of Resources As 15 And Α, Β=0.7, 0.9, 1,
=
n
l
J
10, 20,And 30 Against FCFS And Swift Scheduler
(i)
(ii)
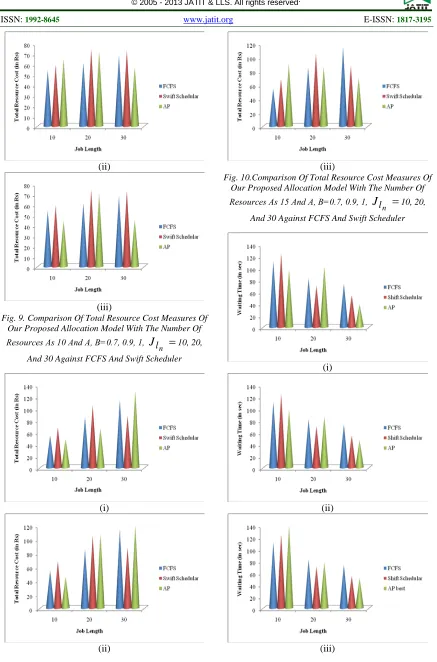
[image:9.612.315.519.572.721.2](iii)
Fig. 8.Comparison Of Total Resource Cost Measures Of Our Proposed Allocation Model With The Number Of Resources As 5 And Α, Β=0.7, 0.9, 1,
=
n
l
J
10, 20, And 30 Against FCFS And Swift Scheduler(ii)
(iii)
Fig. 9. Comparison Of Total Resource Cost Measures Of Our Proposed Allocation Model With The Number Of Resources As 10 And Α, Β=0.7, 0.9, 1,
=
n
l
J
10, 20,And 30 Against FCFS And Swift Scheduler
(i)
(ii)
[image:10.612.90.527.62.724.2](iii)
Fig. 10.Comparison Of Total Resource Cost Measures Of Our Proposed Allocation Model With The Number Of Resources As 15 And Α, Β=0.7, 0.9, 1,
=
n
l
J
10, 20,And 30 Against FCFS And Swift Scheduler
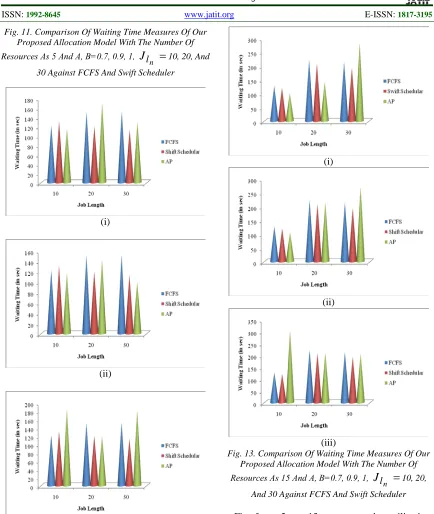
(i)
(ii)
ISSN: 1992-8645 www.jatit.org E-ISSN: 1817-3195
Fig. 11. Comparison Of Waiting Time Measures Of Our Proposed Allocation Model With The Number Of Resources As 5 And Α, Β=0.7, 0.9, 1,
=
n
l
J
10, 20, And 30 Against FCFS And Swift Scheduler(i)
(ii)
(iii)
Fig. 12. Comparison Of Waiting Time Measures Of Our Proposed Allocation Model With The Number Of Resources As 10 And Α, Β=0.7, 0.9, 1,
=
n
l
J
10, 20,And 30 Against FCFS And Swift Scheduler
(i)
(ii)
(iii)
Fig. 13. Comparison Of Waiting Time Measures Of Our Proposed Allocation Model With The Number Of Resources As 15 And Α, Β=0.7, 0.9, 1,
=
n
l
J
10, 20,And 30 Against FCFS And Swift Scheduler
Fig from 2 to 13 compares the utilization, economy, total resource cost and waiting time between the proposed and conventional resource allocation models. However, in some of the plots,
the conventional models dominate. The
[image:11.612.89.523.67.581.2]economy stage. When compared to the other achievements, the degradation can be tolerable as it is just low level value while the other improvements are relatively higher than these.
5. CONCLUSION
In this paper, an allocation model was utilized for efficient resource allocation in a grid environment. This allocation model allocates resources that were obtained using the PSO. The allocation model has fruitfully allocated the resources in a framework. The PSO algorithm successfully computes the exact resources from the resource vector. The allocation model was implemented in a grid environment and the implementation result was analyzed with different number of grid resources and jobs. The failure rate, resource utilization and cost factor values of our proposed allocation model was compared with other conventional resource allocation methods. The comparison results have shown that our allocation model was better than the other methods.
REFERENCES
[1] Zhongzhi Shi, He Huang, Jiewen Luo, Fen Lin and Haijun Zhang, "Agent-based grid
computing", Applied Mathematical Modeling,
Vol. 30, No. 7, pp. 629–640, 2006
[2] Junwei Cao, Stephen A. Jarvis, Subhash Saini and Graham R. Nudd, "GridFlow: Workflow
Management for Grid Computing", In
Proceedings of 3rd IEEE/ACM International Symposium on cluster Computing and the
Grid, pp. 198- 205, 2003
[3] Jianmin Zhu and Bhavani Thuraisingham,
"Secure Grid Computing", International
Journal of Computer Science and Network Security, Vol. 6, No.8, 2006
[4] Manjula and Raju, "A Study on Applications of
Grid Computing in Bioinformatics", Computer
Aided Soft Computing Techniques for Imaging and Biomedical Applications, Vol. 4, No. 2, pp. 69-72, 2010
[5] Kumaran Subramoniam, Muthucumaru
Maheswaran and Michel Toulouse, "Towards a Micro-Economic Model for Resource
Allocation in Grid Computing Systems", IEEE
Canadian Conference on Electrical & Computer Engineering, Vol. 2, pp. 782-785, 2002
[6] Ger Koole, Rhonda Righter, "Resource
allocation in grid computing", Journal of
Scheduling, Vol. 11, No 3, pp. 163-173, 2008
[7] Sumathi and Punithavalli, "Constructing a Grid Simulation for E-Governance Applications
Using GridSim", Journal of Computer Science,
Vol. 4, No. 8, pp. 674-679, 2008
[8] Farag Azzedin and Muthucumaru Maheswaran, "Towards Trust-Aware Resource Management
in Grid Computing Systems", In Proceedings
of the 2nd IEEE/ACM International Symposium on Cluster Computing and the
Grid, pp. 452, 2002
[9] Ger Koole and Rhonda Righter, "Resource
allocation in grid computing", Kluwer
Academic Publishers Hingham, MA, USA, Vol. 11, No. 3, pp. 163-173, 2008
[10] Mark Baker, Rajkumar Buyya and Domenico Laforenza, "Grids and Grid technologies for
wide-area distributed computing", Department
of Computer Science and Software Engineering, Vol. 32, No. 15, pp. 1437–1466, 2002
[11] Carsten Ernemann, Volker Hamscher, Uwe Schwiegelshohn, Ramin Yahyapour and Achim Streit, "On Advantages of Grid Computing for
Parallel Job Scheduling", In Proceedings of
2nd IEEE/ACM International Symposium on Cluster Computing and the Grid, Vol. 2, pp. 1582-1587, 2002
[12] Manvi and Telsang, "An agent-based resource
allocation model for grid computing", IEEE
International Conference on Services
Computing Vol. 1, pp. 311-314, 2005
[13] Stefano Cozzini, "Grid computing and
e-science: a view from inside", Journal of
Science Communication, Vol. 7, No. 2, 2008 [14] Yann Chevaleyre, Paul E. Dunne, Ulle
Endriss, Jerome Lang, Michel Lemaitre, Nicolas Maudet, Julian Padget, Steve Phelps, Juan A. Rodriguez-Aguilar and Paulo Sousa, "Issues in Multiagent Resource Allocation",
Journal of Informatics, Vol. 30, pp. 3-31, 2006 [15] C. Senthamarai, A. Krishnan and R.
Hemalatha, "Performance Monitoring of Energy Flow in the Power Transmission and Distribution System Using Grid Computing",
Journal of Computer Science, Vol. 3, No. 5, pp. 323-328, 2007
[16] Sarbani Roy and Nandini Mukherjee “Efficient resource management for running multiple concurrent jobs in a computational grid
environment”, Future Generation Computer
ISSN: 1992-8645 www.jatit.org E-ISSN: 1817-3195
[17] Wei-Chang Yeh and Shang-Chia Wei, “Economic-based resource allocation for reliable Grid-computing service based on Grid
Bank”, Future Generation Computer Systems,
Vol. 28, No. 7, pp. 989–1002, 2012.
[18] Li Chunlin and Li Layuan “Design and implementation of economics-based resource
management system in ad hoc grid”, Advances
in Engineering Software, Vol. 45, No. 1, pp. 281–291, 2012.
[19] Ali Sarhadi, "Proffering a Brand New Method for Mapping of Tasks to Resource in Grid Computing with the Aims of Load Balancing Based on P2P Model Uses Ant Colony
Algorithm", Journal of Emerging Trends in
Computing and Information Sciences, Vol. 2, No. 11, October 2011
[20] Thenmozhi, Tamilarasi and Vanathi, "A Fault Tolerant Resource Allocation Architecture for
Mobile Grid", Journal of Computer Science,