942
APPLICATIONS OF REGION DEVELOPING FEATURE IN
WHEEL IMAGE SEGMENTATION
JINGYU YANG, SONG WANG, XIAOGANG DU
School of Electronic & Information Engineering, Lanzhou Jiaotong University, Lanzhou 730070, China
ABSTRACT
Online detection of protection orbit round as an important part of the train, the tread wear parameters traffic safety is important. Like the wheel of the measurement techniques based on optical screenshots Dimensions dynamic detection 'access to a complete round of the contour image is essential. For the round image features is proposed based on region developing the round image segmentation algorithm. Round of the algorithm according to the different circumstances of the image characteristics through the base point, select the appropriate seed points and determine the appropriate growth criteria. After region developing, effectively extract the wheel contour image. Through a large number of the image verification, the segmentation results of the algorithm figure overlap area ratio is greater than 82%, the misclassification error area ratio of less than 0.01%. Round extract can be effective in a variety of circumstances of the contour curve has good noise immunity.
Keywords: Round of Testing, Image Segmentation, Regional Growth, Single Connection Area Growth
1. INTRODUCTION
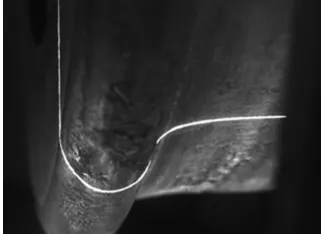
Online detection of protection orbit round as an important part of the train, the tread wear parameters traffic safety is important. Literature [1] is proposed based on the structure of light and image analysis of wheel wear parameters online testing method, the method uses the line structured light projected onto the wheel, as shown in Figure 1, where the white bright line is the line structure light in the wheel on the projector. The projection of the rim tread shape contour obtained by CCD wheel wear parameters obtained after image analysis. Parameters crucial to the accuracy of the results of the image analysis of wear, and its process for image segmentation, thinning, pixel tracking, as well as the parameters calculated. Which to obtain a complete round outline pictured key technologies.
[image:1.612.337.498.355.472.2]Currently, China used to round multi-use image segmentation algorithm wide value method [2-3], which Otsu method Otsu [4-5] for the traditional image segmentation method is widely used. But after the experiment, Otsu's used in round image segmentation, consider the lack of correlation between the pixels in an image, the experimental results can not meet the actual demand. In this paper, the round image features a round of regional growth the image segmentation new algorithm ISAWRG (image segmentation algorithm of wheel region developing).
Figure 1: The Lines Structured Light Projector On The Wheel Set
943
2. WHEELONTHEIMAGE
CHARACTERISTICS
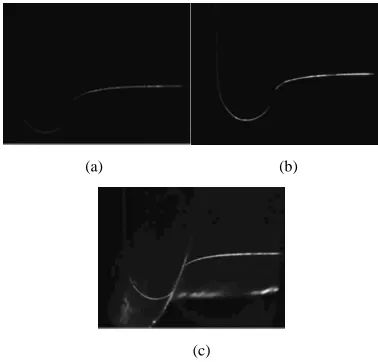
Round the image acquisition process, the different light intensities and outside interference causes the image gray dynamic changes in different target image the grayscale distribution and noise intensity varies. Figure 2(a) the background intensity weak wheel on the image, Figure 3(a) its histogram; Figure 2(b) is a standard wheel, Figure 3(b) of the image to its histogram; Figure 2(c) is a strong background intensity of the wheel on the image, Figure 3(c) its histogram. It can be seen from Figure 3, and the background pixel proportion of large, distributed largely in the area grayscale value is less than 50. Foreground pixels proportion less reaction foreground pixel gray value distribution for clarity, only the statistical gray value of not less than 50 pixels. The obtain histogram shown in Figure 4.
The wheel has the following main features:
1) Noise round the complex structure itself will be reflective, coupled with the impact of natural light, the noise distribution more random, and the relatively wide distribution. But the noise is mainly concentrated in the rim around the tread and the rim is the most sensitive part of the light. When the interference light is strong, the parts are first be noise generated interference strength will generate different intensity noise.
2) Background characteristics of the whole background pixel gray value distribution are more concentrated, clearly showing the clustering phenomenon.
(a) (b)
[image:2.612.318.519.66.464.2](c)
Figure 2: Background Intensity Of The Same Wheel Set On The Image
(a) (b)
(c)
Figure 3: Figure 2 corresponds to the histogram
(a) (b)
(c)
Figure 4: Only Statistical Gray Scale Value Is Not Less Than 50 Pixels Resulting Histogram
3. IMAGESEGMENTATIONALGORITHM
BASEDONREGIONDEVELOPING
ROUND
Fore-ground object light in the wheel for the wire structure on the projection shown in Figure 1 of a white bright line. Combining round growth characteristics of the image using the single connection area proposed image segmentation algorithm based on region developing round, each pixel in the image as a node in the connection diagram, and then, in accordance with certain growth criteria characteristics similar pixel node merge join up. Growth criteria are compared two gray differences between the adjacent pixels, set the width value is less than merge them to generate a new seed point.
2.1 The Growth Object Of Select
[image:2.612.99.288.507.688.2]944 background pixel, the gray value distribution is relatively concentrated, rendered obvious clustering phenomenon. Round image features selected background pixels of reverse thinking growth, the use of regional growth statistics, are isolated background set of points. Growing Point pixel gray value is set to 0, growing point, i.e. the foreground pixel gray level value is set to 255, in order to achieve the separation of the foreground and background.
2.2 Seed Selection
The seed should not select a relatively high pixel in the gray value in statistics classes, but also should not select relatively low gray value pixels, it should be more appropriate to select the pixels close to the center of gravity of clustering [15]. The wheel of the image concerned, PBase is the distance of 70 millimeter of the rim inner side tread surface of the point [16], is an important point in the image. The distribution of the noise is a gradual transition from the rim portion to the tread portion. Therefore, a gradation value of the point PBase will not be at the ends of the distribution of the gray value of the cluster, but the intermediate section. PBase is near background pixels can be selected for seed point
Seed
P . One is the search range α of PBase. PBase is the position of the follower wheel diameter size of the dynamic changes, there is a change in α , Let
( )
{
x y, |xmin x xmax,ymin y ymax}
α= ≤ ≤ ≤ ≤ ;
second search range of γ in PSeed, defined in the
paper
( )
{
x y, |xmin x xmax,yPBase L y ymax}
γ = ≤ ≤ + ≤ ≤ ,
wherein, Base
P
y is the ordinate of PBase, L for the
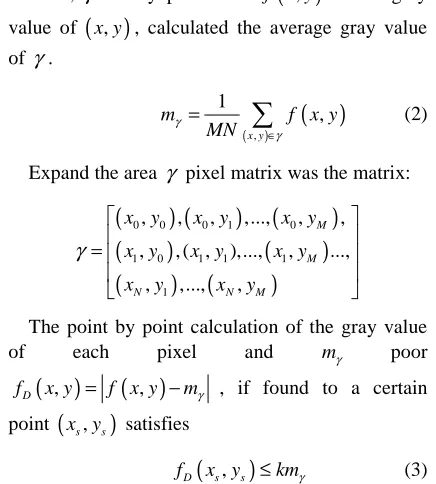
[image:3.612.309.527.389.631.2]partial the shift amount is greater than the vertical distance of PBase to round the edge of the profile curve. Therefore, γ α⊂ , as shown in Figure 5.
Figure 5: The Range Of α And γ Is A Schematic Diagram
1) Determining the position basis points
As the wheel diameter size dynamically change due to the position of PBase, it can determine PBase's
trajectory curve, the curve is monotonic and continuous. Known PBase ⊂α , then PBase abscissa
collection A=
{
x x| min ≤ ≤x xmax}
set of ordinateB satisfy the correspondence mapping: A→B, then
( )
{
| ,}
B= y y=h x x∈A . Regional α
segmentation, refinement and least-squares fitting the region α wheel of contour curves single-pixel monotonic continuous function. C and collection of the range of the function A satisfies correspondence mapping z : A → C, then
( )
{
| ,}
C= y y=z x x∈A . These two functions are
monotone continuous exclude parallel, there is a point of intersection PBase is this intersection. Let
1
h− mapping inverse mapping.
( )
( )
{
1}
, | ,
Base
P = x y y=BIC x=h− y (1)
2) Determine the location of the seed
In order to select the appropriate seed point, can select γ near the average gray value of a given
pixel point. A seed point search area γ size is
M×N , γ at any point in a f x y
( )
, of the grayvalue of
( )
x y, , calculated the average gray valueof γ.
( )
( ), 1
,
x y
m f x y
MN
γ
γ
∈
=
∑
(2)Expand the area γ pixel matrix was the matrix:
(
) (
) (
)
(
)
(
)
(
) (
)
0 0 0 1 0
1 0 1 1 1
1
, , , ,..., , ,
, , ( , ),..., , ...,
, ,..., ,
M
M
N N M
x y x y x y
x y x y x y
x y x y
γ
=
The point by point calculation of the gray value
of each pixel and mγ poor
( )
,( )
,D
f x y = f x y −mγ , if found to a certain point
(
x ys, s)
satisfies(
,)
D s s
f x y ≤kmγ (3)
Stop the operation of subsequent points, the point
(
x ys, s)
is satisfied for the seed point PSeed, where k is an adjustable parameter.2.3 Determining The Growth Criteria
945 the neighborhood points and the absolute value of the difference of the current seed pixel gray value less than or equal to the threshold of T . It can be seen from Figure 2 that the wheel on the gradation value of the image background distribution due to the light conditions and interference exhibit different distributions. It is difficult to choose a suitable and generic growth threshold. Based on the wheel on the image characteristics, according to the average grayscale value m of the pixels in the rim R region R , and dynamically determine the growth threshold value of T . If m is less than R m , 1 background intensity is weak, the growth of broad value minus t mR greater than m2 , the background intensity, the growth of broad value increases t . If m between R m and 1 m , to retain 2 the initial growth threshold.
Let R be the number of pixels for the N , R
( )
,f x y is the gradation value of each pixel of the
R zone, the average grayscale value of all the pixels in the calculation region R .
( )
1,
R
R R
m f x y
N
=
∑
(4)(
1)
(
2)
0
sgn sgn
2
R R
m m m m
T = +T − + − × ∆t(5)
Wherein, m and 1 m , a non-negative parameter, 2
1 2
m <m , determined by experiment. T is the 0
initial width value, ∆t is a step length.
Finally, the growth criteria for consideration in the neighborhood D pixel
(
x yr, r)
∈D with thecurrent seed pixel
(
x ys, s)
the gray value of theabsolute value of the difference is less than or equal to a gate limit T , i.e.
(
s, s) (
r, r)
f x y −f x y ≤T (6)
(
) (
) (
)
(
) (
) (
)
(
) (
)
1, 1 , 1, , 1, 1 ,
, 1 , , 1 , 1, 1 ,
1, , 1, 1
s s s s s s
s s s s s s
s s s s
x y x y x y
D x y x y x y
x y x y
− − − − +
= − + + −
+ + +
2.3 Program Design Process
According to the algorithm described above, the program flow is:
1) To search PBase, by the formula (1) search
Base
P , it is determined whether it satisfies PBase∈α ,
and if satisfied, then return to the coordinates of
Base
P , otherwise exit the algorithm;
2) To determine the PSeed and growth criteria by
Base
P determining γ and R , and according to
formula (2) and (3) determine PSeed, by the formula (4) and (5) calculated growth door limit T-last in accordance with formula (6) determining the growth criteria;
3) Progressive scan image progressive scan, identify the pixels not yet vest;
4) Check the neighborhood D seed points as the center, check one neighborhood pixel grayscale values meet growth standards, to meet the then merge them to seed the queue, to be the next growth point and make the gray value f x y
( )
, =0 ,otherwise let f x y
( )
, =255;5) Outward growth of newly merged pixels for the center, go back to step 4), check the new pixel neighborhood until the area can not be expanded further;
6) Growth terminated, return to step 3), to continue scanning until a pixel does not belong can not be found, the end of the entire growth process.
4. COMPARISONISAWRGWITHOTSU
4.1 Segmentation Results Contrast
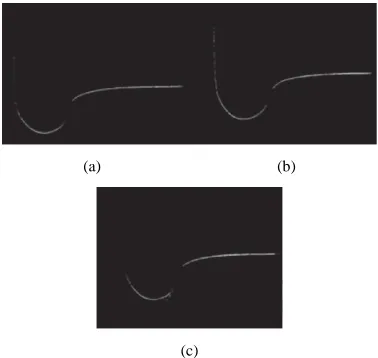
Based on the above, the use of VC++ 6.0 ISAWRG algorithm, experiment, take L=10, k=0.1, m1=8, m2=18, T0=10, ∆ =t 6 . The experimental image size 764 576× (coordinates into screen coordinates, in pixels). Figure 6(a) of Figure 2(a) ISAWRG segmentation result, the seed point
(
x ys, s) (
= 593, 357)
, T=4; Figure 6(b) of Figure 2(b) ISAWRG segmentation result, the seed point(
x ys, s) (
= 598 311×)
, T=10; Figure 6(c) of Figure 2(c) ISAWRG segmentation results,(
x ys, s) (
= 609, 286)
, T=16. Figure 7 is the Otsu segmentation results in Figure 2 corresponding image.Compare Figure 6 and Figure 7 can be seen, the wheel on the results of the image segmentation algorithm based on region developing significantly better than in the human visual Otsu algorithm.
4.2 Segmentation Results Contrast
946 both comprehensive evaluation of segmentation methods, define evaluation criteria are as follows.
(a) (b)
[image:5.612.100.289.121.300.2](c)
Figure 6: ISAWRG Segmentation Results
(a) (b)
[image:5.612.306.528.191.278.2](c)
Figure 7: OTUS Segmentation Results
Overlap area ratio is cor P Q 100%
Q
S E
S
= I ×
.
Misclassification area ratio is E 100%
err
S E
S
= × .
In the formula, P algorithm for automatic segmentation is obtained through the target area; Q artificial manual segmentation of the object region, expected to get the target area; automatic SP QI
extraction area and expect to receive regional intersection area; SE error segmentation area, namely the intersection outside the region segmentation results area; S for wheel set image area. Apparently, Ecor bigger shows the algorithm for automatic segmentation is obtained through the
target area closer to the target 's real situation, Eerr more novel Ming error segmentation pixel number less, namely Eerr bigger is better, the smaller the better. Table 1 lists the figure 3 images respectively by ISAWRG and Otsu after segmentation of Ecor
and Eerr results.
Table I: Evaluation Of Segmentation Results
图2 ISAWRG Ostu
cor
E Eerr Ecor Eerr
(a) 91.8 0 26.1 0
(b) 94.3 0 46.3 0
(c) 82.1 0.01 78.3 1.26
For Figure 2(a) and 2(b), either ISAWRG or Otsu has over-segmentation phenomenon, there is no belong to the background pixels as foreground pixels have been misclassified case, so Eerr is 0. From Table 1 income data shows ISAWRG algorithm does have obvious advantages. Through to the 341 round image repeated experiments, we can conclude that the similar results.
4.3 The Analysis Of Experimental Results Through the above results, the proposed algorithm advantages as follows:
1) Effective extraction of wheel contour curve, ISAWRG can adapt to a variety of light intensity. When the light is weak, as shown in Figure 2(a), Otsu algorithm can hardly recognize intracellular side portion of the target, ISAWRG still can effectively extract the portion of the target.
2) Strong anti-jamming ability, for Figure 2(c), as part of the background and target presence of gray level crossing, Otsu in dividing the target will also many pixel of the background into the wrong target pixel, so that the target submerged in the background; and ISAWRG in considering the image global and local information based on after segmentation, after a large number of background information filtering.
[image:5.612.96.291.327.578.2]947
5. CONCLUSIONS
A detailed analysis of the wheel set image characteristic, discussed based on region developing image segmentation algorithm for wheel, wheel image characteristic, elaborates the algorithm growth object selection. And in accordance with the wheel image target strength and noise intensity, diversity, through the point position properly in the seed point selection and growth standards establishment.
The experiment proved the feasibility and superiority, and the algorithm and the Otsu algorithm the experiment result in comparison and analysis. It was proved by experiments, proves that the algorithm can be on different intensity of illumination and noise interference by complete extraction of wheel contour curve, can meet the requirements on image segmentation.
ACKNOWLEDGEMENTS
This work is jointly supported by The National Natural Science Foundation (60962004, 61162016).
REFERENCES:
[1] Wu K H, Li Z J, Ban T, “Online measurement for geometrical parameters of locomotive wheel set”, Proceedings of 2009 International Conference on Optical Instruments and Technology: Optoelectronic Imaging and Process Technology, IEEE Conference Publishing Services, November 20-21, 2009, pp. 1-5.
[2] Gambino O, Vitabile S, Lo Re G, “Automatic volumetric liver segmentation using texture based region developing”, Proceedings of 2010 International Conference on Complex, Intelligent and Software Intensive Systems, IEEE Computer Society, February 15-18, 2010, pp. 146-152.
[3] Jun T, “A color image segmentation algorithm based on region developing”, Proceedings of the 2nd International Conference on Computer Engineering and Technology, IEEE Conference Publishing Services, February 17-18, 2010, pp. 634-637.
[4] Qi L N, Zhang B, Wang Z K, “Application of the Ostu method in image processing”, Radio Engineering, Vol. 36, No. 7, 2006, pp. 25-26. [5] Li M, “Research of image segmentation based
on Ostu algorithm”. Hefei: Hefei University of Technology, 2011, pp. 30-59.
[6] Verma O P, Hanmandlu M, Susan S, “A simple single seeded region developing algorithm for color image segmentation using adaptive thresholding”, Proceedings of 2011 International Conference on Communication Systems and Network Technologies and Computer, IEEE Computer Society, July 7-8, 2011, pp. 500-503.
[7] Wan S Y, “Higsins W E. Symmetric region developing”, Image Processing, Vol. 12, No. 9, 2003, pp. 1007-1015.
[8] Nakib A, Oulhadj H, Siarry P, “Non-supervised image segmentation based on multi-objective optimization”, Pattern Recognition Letters, Vol. 29, No. 2, 2008, pp. 161-172.
[9] YAN F X, ZHANG H, KUBE C R, “A multistage adaptive thresholding method”, Pattern Recognition Letters, Vol. 16, No. 1, 2005, pp. 1183-1191.
[10] ZHANG X M, YAN L, “A fast image thresholding method based on chaos optimization and recursive algorithm for two dimensional Tsallis entropy”, Journal of Computers, Vol. 5, No. 7, 2010, pp. 1054-1061. [11] Chan T F, Vese L A, “Active contours without