http://dx.doi.org/10.4236/as.2016.78051
How to cite this paper: Khalil, M.I., Abdalla, M., Lanigan, G., Osborne, B. and Müller, C. (2016) Evaluation of Parametric Limitations in Simulating Greenhouse Gas Fluxes from Irish Arable Soils Using Three Process-Based Models. Agricultural Sciences, 7, 503-520. http://dx.doi.org/10.4236/as.2016.78051
Evaluation of Parametric Limitations in
Simulating Greenhouse Gas Fluxes from
Irish Arable Soils Using Three
Process-Based Models
Mohammad I. Khalil
1*, Mohamed Abdalla
2, Gary Lanigan
3, Bruce Osborne
1,
Christoph Müller
1,41UCD School of Biology & Environmental Science and UCD Earth Institute, University College Dublin, Dublin,
Ireland
2Institute of Biological & Environmental Sciences, University of Aberdeen, Scotland, UK 3Teagasc Environment Research Centre, Johnstown Castle, Wexford, Ireland
4Department of Plant Ecology, Justus-Liebig-University Giessen, Giessen, Germany
Received 8 June 2016; accepted 13 August 2016; published 16 August 2016
Copyright © 2016 by authors and Scientific Research Publishing Inc.
This work is licensed under the Creative Commons Attribution International License (CC BY).
http://creativecommons.org/licenses/by/4.0/
Abstract
Globally a large number of process-based models have been assessed for quantification of agri-cultural greenhouse gas (GHG) emissions. Modelling approaches minimize the presence of spatial variability of biogeochemical processes, leading to improved estimates of GHGs as well as identi-fying mitigation and policy options. The comparative performance of the three dynamic models (e.g., DNDC v9.4, DailyDayCent and ECOSSE v5+) with minimum numbers of common input pa-rameters was evaluated against measured variables. Simulations were performed on convention-ally-tilled spring barley crops receiving N fertilizer at 135 - 159 kg∙N∙ha−1∙yr−1 and crop residues at
3 t∙ha−1∙yr−1. For surface soil nitrate (0 - 10 cm), the ECOSSE and DNDC simulated values showed
significant correlations with measured values (R2 = 0.31 - 0.55, p < 0.05). Only the ECOSSE-simu-
lated N2O fluxes showed a significant relationship (R2 = 0.33, p < 0.05) with values measured from
fertilized fields, but not with unfertilized ones. The DNDC and DailyDayCent models significantly
underestimated seasonal/annual N2O fluxes compared to ECOSSE, with emission factors (EFs),
based on an 8-year average, were 0.09%, 0.31% and 0.52%, respectively. Predictions of ecosystem respiration by both DailyDayCent and DNDC showed reasonable agreement with Eddy Covariance data (R2 = 0.34 - 0.41, p < 0.05). Compared to the measured value (3624 kg∙C∙ha−1∙yr−1), the ECOSSE underestimated annual heterotrophic respiration by 7% but this was smaller than the DNDC (50%)
and DailyDayCent (24%) estimates. All models simulated CH4 uptake well although the ECOSSE
prediction was closer (−29 g∙C∙ha−1∙yr−1) to the measured one (2.9). The site-specific results imply that the ECOSSE model performed better under Irish conditions. However, further refinement and validation of all of the models with a more extensive dataset that includes other land-use and soil types will be required to determine their suitability in providing national estimates.
Keywords
Greenhouse Gases, Arable Lands, Input Parameters, Process-Based Models, Ireland
1. Introduction
Agricultural activity is estimated to be responsible for approximately 14% of global anthropogenic greenhouse gas (GHG) emissions [1]. In the European Union (EU), agriculture comprises 10% of emissions, with CH4 and N2O contributing 49% and 63%, respectively to sectoral emissions [2]. In the Republic of Ireland (ROI), agri-cultural emissions comprise one-third of national emissions and remain a key component of national emissions despite recent decreases, due to the economic downturn [3]. Agricultural GHGs, particularly N2O, are produced mainly through biological processes and the degree of variation (spatial and temporal) in emissions depends on soil type, land use and climatic factors (e.g. [4]-[10]. Agricultural soils may either be net sinks or sources, de-pending largely on the balance between N2O release and carbon (C) sink-source strength and functional rela-tionships exist between organic C and N, derived from either inorganic or organic sources, to produce GHGs. These relationships are regulated by agricultural activities and associated disturbances (e.g. [11][12]. Thus, an understanding of the associated controlling factors and their interactions, including impact of site-specific soil conditions are key requirements [13] for understanding the GHG balance and for the development and selection of an appropriate model for accounting and reporting.
Most of the Annex-I countries are using IPCC Tier 1 methodologies [1][14][15] for the estimation of agri-cultural GHGs due to a lack of detailed, spatially-explicit activity data and the absence of disaggregated sion factors (EFs). Some countries (e.g. New Zealand, USA) have moved to Tier 2, with country-specific emis-sion factors and are developing Tier 3 (modelling) methodologies. The Tier 1 approach has several limitations for studies of the GHG balance relevant to Agriculture, Forestry and Other Land Uses (AFOLU)/LULUCF [1]. Development of higher tiers requires good country/regional-specific activity data allied to extensive GHG emis-sions datasets. Compared to Tier 2, more additional resources are required for the development of Tier 3, in-cluding an appropriate biogeochemical model. A process-based model could take into account functional rela-tionships and provide a flexible and structured way to assess how different scenarios including land-use man-agement and land-use change can affect GHG emissions and soil C and N dynamics. A modelling approach can provide improved estimates of GHG budgets and reflect more robust emissions assessments (sink or source) by reducing the uncertainties associated with the impacts of soil, climate and management activities. The advantages in using a model include an ability to 1) scale GHG emissions from the site-specific to the national/regional level, 2) identify potential mitigation options and the interactions between different gaseous and/or other loss path-ways, and 3) provide a better understanding of how agricultural soils can act as C sinks or sources.
In line with commitments under the UNFCCC, the ROI is committed to improving the estimation of GHG budgets by developing Tier 3 approaches. There has been much progress in recent years in developing models to simulate GHG emissions. Modelling is considered a low-cost method of estimating GHG emissions from agri-cultural soils at different scales and for exploring potential mitigation strategies [16]. Any discrepancies in pre-dicting field measured GHG fluxes can be used to identify limitations to model use, suggesting further potential developments that could lead to a better representation of the impacts of differences in land use, land use man-agement or environmental factors. However, spatial variability in GHG fluxes due to soil heterogeneity, in par-ticular, has to be considered when comparing model results with field measurements [17][18]. There is also a particular need for improved methodologies for up-scaling of GHG emissions from site to regional/national scales [1]. The use of models for estimating soil GHG emissions is expected to increase, and further improve-ments in model accuracy and precision will be essential.
(N) biogeochemistry in agro-ecosystems and has been used for predicting GHG emissions, soil C dynamics, crop growth and other relevant data [19]. DailyDayCent is the daily time-step version of the CENTURY bio-geochemical model [20], which simulates daily N-gas fluxes, C fluxes and other ecosystem parameters [21]. More recently, the Rothamsted Carbon Model (RothC) and SUNDIAL (SimUlation of Nitrogen Dynamics in Arable Land) have been used in the development of a multi-pool, process-based model, called “ECOSSE” (Es-timating Carbon in Organic Soils-Sequestration and Emissions) [22]. The ECOSSE model simulates soil C and N turnover, including GHG/trace gas emissions, in both mineral and organic soils using only limited meteoro-logical, land-use and soil data, compared to other models. In the ROI, some models (DNDC, DayCent, RothC, PASIM, etc.) have been tested/validated using limited datasets measured from grassland and arable systems
[23]-[29]. However the results have not been sufficiently robust to allow them to be used in the inventory proc-ess without further investigations.
Based on the different characteristics and performances, three process-based models (DNDC v9.4, Daily-DayCent and ECOSSE v5+) were chosen to evaluate GHG emissions associated with the major Irish cropland type. The goal was to establish the basis of an emission inventory system using process-based models with the minimum number of commonly available input parameters that reflect the site-specific diversity of management practices that influence GHG emissions. Barley, with dominancy of spring barley, is the major cereal crop in Ireland, comprising 71% of the total cereals in 2014 [30]. Multi-year GHG fluxes data for spring barley, meas-ured at the plot scale, were available to initiate model comparison exercises. The main objectives were: 1) to simulate daily N2O, CH4 and CO2 emissions from conventionally-tilled spring barley fields located in Carlow, Ireland over 8 years using the DNDC v9.4, DailyDayCent and ECOSSE v5+ models; 2) to assess the extent of sta-tistical agreements (R2, RMSE, RE and MD) between model outputs and measured datasets; and 3) to evaluate the differences between the measured and modelled seasonal/annual GHG emissions and their estimated EFs.
2. Materials and Methods
2.1. Experimental Sites and Datasets
Data on inputs and management practices were collected from plot-scale field experiments conducted at the Teagasc Oak Park Research Centre, Carlow (52°86' N and 6°54' W). The soil (0 - 10 cm depth) at Oak Park site is classified as a sandy loam (overlying loam) in texture, free draining, Euteric Cambisol (Grey Brown Pod-zolics). Detailed site characteristics, which may differ from other published information [24] [25][31] due to averaging of samples taken from both small and large plots, are given in Table 1. Thirty years (1982-2011) cli-mate data measured from the nearby weather stations (Oak Park, Carlow and Kilkenny, 30 km away) by Met Eireann were used as inputs to run the models. The meteorological inputs required for DNDC and DailyDayCent are daily minimum and maximum air temperature, rainfall, wind speed, radiation and relative humidity; and for ECOSSE only average air temperature, rainfall and potential evapotranspiration is required.
2.2. Description of Field Experiments
The larger plots used (2.5 ha) for field-scale studies were part of an experiment comparing the effects of con-ventional and minimum tillage practices [24] [25] [32]-[34]. An experiment was also carried out using small plots (6 m × 25 m = 150 m2, each plot containing a 0.27 m2 ground area chamber), which were on the border of the large plots. Only the results from the conventional (CT) tillage treatment were used in the present paper. The CT plots were prepared using a mouldboard plough to a depth of 22 - 25 cm. Subsequently, a light tilling was performed in the CT treatment and seeds (spring barley, cv. Tavern/Quench) were sown using a cultivator drill, followed by rolling. The small plots comprised three randomized. Each main plot divided into two subplots containing different fertilizer treatments: fertilized (N1) and non-fertilized (N0) plots. Treatments were randomly distributed and each treatment was replicated four times.
Table 1.Site characteristics of experimental field as well as inputs and management practices (EC = Eddy Covariance/large
plot received highest N rate).
Site characteristics
Location Oak Park, Carlow
Latitude-longitude 52˚86'N - 6˚54'W
Mean annual air temperature (˚C) 9.8
Mean annual precipitation (mm) 870.5
Land use history Cereals (15 years), croplands (50 years), received 140 - 160 kg∙N∙ha
−1
in 2003 and the year before. Spring barley since 2000.
Soil type (FAO/Irish GSG) Euteric Cambisol/Grey Brown Podzolics
Soil texture: 0 - 10/0 - 25 cm Sandy loam
Clay (%): 0 - 10/0 - 25 cm 15.13/14.73
Silt (%): 0 - 10/0 - 25 cm 25.63/33.73
Sand (%): 0 - 10/0 - 25 cm 59.24/51.55
Bulk density (g∙m−3): 0 - 10/0 - 25 cm 1.42/1.46
Total soil organic carbon (kg∙ha−1): 0 - 10/0 - 25 cm 19.912/42.888
Total inert soil organic carbon (kg∙ha−1):
0 - 10/0 - 25 cm 3.863/8.163
Soil pH: 0 - 10/0 - 25 cm 7.24/7.35
Available water (AW) at field capacity (mm):
0 - 10/0 - 25 cm 22.69/55.13
Water content at saturation (%): 0 - 10/0 - 25 cm 47.21 (AW = 29.51 mm)/45.56 = 113.87 mm (AW = 71.17)
Water content at field capacity (%): 0 - 10/0 - 25 cm 40.39 (AW = 22.69 mm)/38.97 = 97.43 mm (AW = 54.73 mm)
Water content at wilting point (%): 0 - 10/0 - 25 cm 17.70 (=17.70 mm)/17.08 = 42.7 mm
Initial NH4 and NO3− (kg∙N∙ha−1): 0 - 10/0 - 25 cm 2.8/6.9 and 9.5/23.17
Annual atmospheric N deposition (kg∙ha−1) 11
Slope (%) and water table depth (cm) 0.004% from vertical and 240
Depth of impermeable layer (cm) and drainage class >150 and High
Inputs and management practices
Land use Spring barley (var. Tavern or Quench)
Date of previous crop harvested 17/08/03
Type and depth of tillage practices Conventional (22 - 25 cm)
Date of tillage practices (ploughed and light till)
19/02/04 and 25/03/04; 09/03/05 and 14/03/05; 10/03/06 and 19/03/06; 24/02/07 and 18/03/07; 22/02/08 and 19/03/08; 18/02/09 and 18/03/09; 02/03/10 and 08/03/10;
02/03/11 and 08/03/11
Date of sowing 26/03/04; 16/03/05; 20/03/06; 21/03/07; 20/03/08; 19/03/09; 09/03/10; 09/03/11
Residue incorporation 3.0 t∙DM∙ha
−1(1.32 t∙C∙ha−1), chopped and left on the field; incorporated during
tillage operation only
Type of N fertilizer Calcium Ammonium Nitrate (CAN)
Number of fertilizer application 2003-04: 1; 2005-11: 2
Fertilizer N rates (kg∙N∙ha−1) 2003: 140; 2004: 0 and 140; 2005: 0 and 159 (106 + 53); 2006: 0 and 140 (90 + 50);
2007-2011: 0 and 135 (67.5 + 67.5)
Date of fertilizer application
27/04/04; 12/04/05 and 10/05/05; 12/04/06 and 11/05/06; 20/04/07 and 10/05/07; 16/04/08 and 15/05/08; 21/04/09 and 22/05/09; 13/04/10 and 07/05/10; 04/04/11 and
10/05/11
Date of harvest 17/08/03; 17/08/04; 09/08/05; 09/08/06; 17/07/07; 22/08/08; 12/08/09; 06/08/10;
2.3. Measurements of N2O, CO2 and CH4
Measurements of GHGs from the experimental plots were either made seasonally or annually and for three years commencing from 2009 to 2011, at daily or fortnightly intervals. N2O emissions were measured using the static closed chamber method. Gas was sampled at 0, 30 and 60 min intervals between 9 and 11 am every week and more intensively (twice weekly) following fertilizer application. The gas samples were stored in exetainers (Labco, High Wycombe, UK) prior to the analyses. The gas analyses were performed using a gas chromatogra-phy (Varian CP 3800 GC, Varian, USA) fitted with a 63Ni electron capture detector (ECD) for N2O analysis and a Flame Ionisation Detector (FID) for CH4 analysis with high purity helium as a carrier gas. Samples were returned to ambient pressure prior to analysis and fed into the system by a Combi-Pal automatic sampler (CTC Analysis, Switzerland). Following a two-year gap, gas samples for the measurement of both N2O and CH4 were collected from September 2008 to September 2010 and from April 2009 to September 2010, respectively. Gas sampling was carried out weekly during the crop growth period and less frequently (2 - 3 weeks) during the fal-low period using static chambers, with 18 replicates.
Eddy Covariance (EC) systems installed in the large plots, consisted of Gill R3 sonic anemometer (Gill In-struments, USA) and Li-7000 infra-red gas analyser (Licor Inc., USA), for net ecosystem exchange (NEE) and ecosystem respiration (Reco) measurements. Estimates of Reco (2003-2007) were based on half-hourly measure-ments and expressed on a daily basis.
2.4. Determination of Soil Nitrate Concentrations
Soils were sampled during the gas sampling periods and soil nitrate concentrations were determined on 2M KCl extracts using an auto-analyzer (Bran and Luebbe, Norderstedt, Germany) [35].
2.5. Description of Models
Three dynamic models (ECOSSE v5 updated in 2012, DNDC v9.4 and DailyDayCent) were selected for this comparative study. Input requirements for each model differ as indicated previously. However, the site charac-teristics and crop management practices used were the same for all the models which were run for 8 years. Other inputs were either defaults or module-based. A brief description of the models is given below. ECOSSE was mainly calibrated under UK conditions [36] with subsequent improvements of the N2O and CH4 modules using Irish data [37]. Both DNDC and the DailyDayCent were calibrated/validated under Irish conditions [24][32][33].
2.5.1. ECOSSE Model
The ECOSSE model was developed to simulate SOC in highly organic soils from algorithms originally derived for mineral soils in the RothC and SUNDIAL models [22][38]. The model uses a pool type approach, and all of the major processes of C and N turnover in the soil are included and are driven by readily available input vari-ables (e.g., SOC, soil water, plant inputs, nutrient applications and timing of management operations). It is a tool for site-specific simulations that apparently does not result in any major loss in accuracy at this scale and makes full use of the limited information that is available to run models whilst still providing accurate simulations of GHGs. The N2O fluxes derive from both nitrification and denitrification, CO2 corresponds to RH and CH4 through a balance between methanogenesis and methanotrophy and changes in SOC stocks. The model can be used with both organic and mineral soils, to provide estimates of the net change in soil C and N in response to changes in land use and climate. This model considers variations for outputs by calculating them on each soil layer for each time step. This model doesn’t use crop growth parameters as inputs but uses a built-in default functional relation.
2.5.2. DNDC Model
However, time-dependent variations in soil moisture, temperature, pH, C and N pools are considered for a reli-able estimate of C and N fluxes by calculating them for each soil layer for each time step.
2.5.3. DailyDayCent Model
DailyDayCent is a biogeochemical model based on the Century soil C model and, for the most part, the parame-ter files used are identical to the ones used by Century 4.5 and DayCent 4.5 [41][42]. This model simulates C and N fluxes between the atmosphere, vegetation, and soil. Major factors (e.g. nutrient availability, water, tem-perature) controlling plant growth are included in order to simulate GHGs and SOC changes over time. This model considers nutrient supply as a function of SOM decomposition and external nutrient additions. Other model inputs are the timing and description of management events (e.g. fertilization, tillage, harvest), and soil texture data. There are submodels that consider plant production, SOM decomposition, soil water and tempera-ture for each layer, as well as nitrification and denitrification, and CH4 oxidation. Improvements in this model are on-going, and comparison of model results and plot data have shown that DayCent reliably simulates crop yield, SOM levels, and trace gas fluxes for various native and managed systems [43].
2.6. Model Run, Statistical Evaluation and Calculation
The datasets were collated and compiled to prepare a list of common input parameters with respect to site char-acteristics and managements to initialize the models (Table 1). The models were run using the common input parameters and the weather data (data not shown). For DNDC and DailyDaycent, the corresponding simulation spin-up for 30 and 700 years were used to allow the model to reach equilibrium state. For ECOSSE, the soil C pool at steady state equilibrium, with crop residue inputs and N as the NO3
− concentration measured
immedi-ately before the start of experiments was used for the initialization.
The ECOSSE model can predict soil heterotrophic respiration (RH) only whereas the EC provides Reco (soil autotrophic and heterotrophic respiration + crop respiration). For comparison and validation of ECOSSE-simu- lated RH with measured ones, daily Reco measured by EC from the large fertilized plot was transformed to daily RH using DailyDayCent fractions (RH/Reco) obtained from this study. Calculation of the total/cumulative N2O, RH and Reco through integration of the measurement values and the sum of simulated values were performed. Seasonal and annual emission factors (EFs) for N2O over the 8 years were calculated by subtracting cumulative measured and model outputs of the unfertilized control from that of the fertilized treatments and dividing by the respective N inputs.
The outputs were collated and converted into standard units for comparison with measured datasets. The simulated values of GHGs were compared and validated quantitatively with measured values using MS Excel speadsheet (MODEVAL v 2.0) [44]. Based on the available measured flux data, an evaluation of the consistency of seasonal (4 - 5 months)/annual N and C emissions with simulated values was carried out. The approach was to take a simple mean and standard error (SE) of the values for each dataset and to calculate statistics (e.g., R2 = Coefficient of determination; RMSE = Root Mean Square Error; RE = Relative Error; MD = Mean Difference) that describe the model fits for all data points simulated by placing equal weight on all values. An analysis of variance for significance at the 0.05 level of probability was performed and the 95% confidence intervals calcu-lated using SAS v. 9.3 (SAS Inc.), MODEVAL and MS Excel (v. 2010).
3. Results
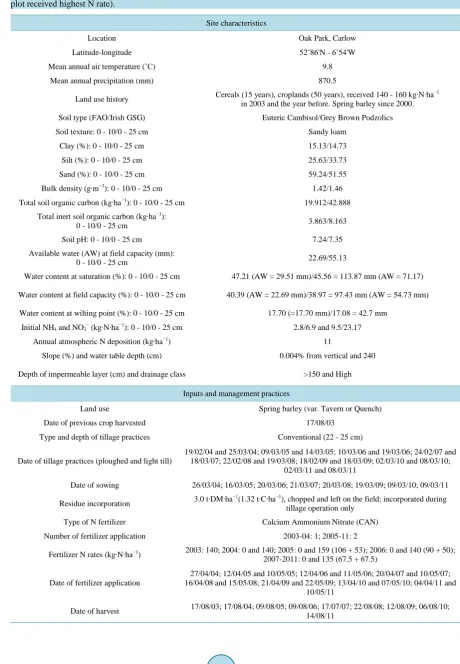
3.1. Simulated and Measured Nitrate-N Concentrations
The measured surface soil NO3− concentration was found to reach a maximum of 71.3 kg∙N∙ha−1 following
fer-tilization, decreasing to 0.82 kg∙N∙ha−1 during later periods (Figure 1). In the unfertilized field, the minimum and maximum surface NO3
− levels (seasonal/annual) measured was 0.20 and 25.2 kg∙N∙ha−1, respectively. The
DailyDayCent and DNDC-predicted soil NO3− levels were highly variable. For the fertilized field, the average
3
Figure 1. Comparison of field measured (seasonal/annual; open circle/square with vertical bars as standard errors) nitrate-N concentrations (kg∙N∙ha−1) in the 0 - 10 cm soil depth with values simulated (solid line) using the three process-based models
over 8 years, commencing from 17 August 2003 (day of harvest), in conventionally-tilled fertilized arable land cropped to spring barley. Solid arrows indicate the days of ploughing and dotted arrows indicate the days of N fertilizer application.
and the DNDC (R2 = 0.31) model estimates correlated significantly (p < 0.05) with the measured values (Table 2). None of the models simulated the surface soil NO3
− concentrations for the unfertilized field accurately,
showing poor coefficients of determination (R2 = −0.07 to 0.13). The total error and bias differences between the simulated and measured soil NO3
− concentrations were large and significantly (p < 0.05) greater than their 95%
confidence intervals for both fields.
3.2. Performance of Models to Simulate GHG Emissions
3.2.1. N2O Emissions
The maximum N2O flux measured across all years was observed in 2004 (56.0 g∙N∙ha−1∙d−1) (Figure 2). For the other years the maximum value was 17.6 g∙N∙ha−1∙d−1 and the minimum −8.0 g∙N∙ha−1∙d−1, demonstrating small differences with the unfertilized plot (16.6 versus −10.4 g∙N∙ha−1∙d−1). Regardless of the models, the simulated N2O fluxes were consistent over the years but differed from the measured values, and none of the models pre-dicted fluxes less than zero. The N2O fluxes varied largely between the fertilized (80.0 - 100.9 g∙N∙ha−1∙d−1) and unfertilized (24.5 - 56.5 g∙N∙ha−1∙d−1) plots, with the highest values predicted by DailyDayCent, including an unusual peak for the unfertilized field (110.1 g∙N∙ha−1∙d−1). The ECOSSE-simulated values correlated well with the measured values (R2 = 0.33, p < 0.05) under fertilized conditions only (Table 2). The total bias and error differences between simulated and measured values did not vary significantly with their 95% confidence levels. Similar results were observed for the unfertilized field but the coefficient of determination was poor (R2 = −0.02 to −0.04, negative).
For the fertilized fields, both DNDC (87%) and DailyDayCent (81%) underestimated the total N2O fluxes
0 100 200 300 400 500 600 700 800 DNDC (Fertilized) 0 100 200 300 400 500 600 700 800 S o il N O3 cont ent ( kg N ha -1) DAYCENT (Fertilized) Measured Simulated 0 100 200 300 400 500 600 700 800 0 10 0 20 0 30 0 40 0 50 0 60 0 70 0 80 0 90 0 10 00 11 00 12 00 13 00 14 00 15 00 16 00 17 00 18 00 19 00 20 00 21 00 22 00 23 00 24 00 25 00 26 00 27 00 28 00 29 00 30 00
Days after harvest of previous crop (2003)
ECOSSE (Fertilized) 0 10 20 30 40 50 60 70 80 0 1 0 0 2 0 0 3 0 0 4 0 0 5 0 0 6 0 0 7 0 0 8 0 0 9 0 0 1 0 0 0 1 1 0 0 1 2 0 0 1 3 0 0 1 4 0 0 1 5 0 0 1 6 0 0 1 7 0 0 1 8 0 0 1 9 0 0 2 0 0 0 2 1 0 0 2 2 0 0 2 3 0 0 2 4 0 0 2 5 0 0 2 6 0 0 2 7 0 0 2 8 0 0 2 9 0 0 3 0 0 0
Table 2. Statistical comparison between simulated and the measured daily soil NO3− concentration (kg∙N∙ha−1) and N2O
fluxes (g∙N∙ha−1) from a conventionally-tilled plot cropped to spring barley.
Statistical parameters Fertilized Unfertilized (Control)
DNDC DailyDayCent ECOSSE DNDC DailyDayCent ECOSSE
Soil NO3− concentration
R2 0.31* 0.14 0.55* −0.07 0.00 0.13
RMSE (%) 925* 2847* 115* 837* 684* 169*
RMSE95% (%) 103 103 103 157 157 157
RE (%) −610* −1807* −46* −419* −497* −86*
RE95% (%) 66 66 66 65 65 65
MD (%) −68 −203 −5 −14 −16 −3
N2O fluxes
R2 −0.02 0.19 0.33* −0.02 −0.03 −0.04
RMSE (%) 189 367 154 186 183 197
RMSE95% (%) 372 372 372 305 305 305
RE (%) 87 74 −59 94 87 −43
RE95% (%) 267 267 267 305 305 305
MD (%) 5* 4* −3 2* 2* −1
*Significant at 5% level of probability. R2 = Coefficient of Determination; RMSE = Root Mean Square Error; RE = Relative Error (Mean); MD =
Mean Difference; n = 130.
Figure 2. Comparison of field measured (seasonal/annual; open circle/square with vertical bars as standard errors) N2O
emissions (g∙N∙ha−1) with values simulated (line) using the three process-based models over 8 years, commencing from 17
August 2003 (day of harvest), in conventionally-tilled fertilized arable land cropped to spring barley. Solid arrows indicate
the days of ploughing and dotted arrows indicate the days of N fertilizer application.
-20 0 20 40 60 80 100 120 DNDC (Fertilized) -20 0 20 40 60 80 100 120 N2 O f luxe s (g N ha -1 d -1) DAYCENT (Fertilized) Measured Simulated -20 0 20 40 60 80 100 120 0 1 0 0 2 0 0 3 0 0 4 0 0 5 0 0 6 0 0 7 0 0 8 0 0 9 0 0 1 0 0 0 1 1 0 0 1 2 0 0 1 3 0 0 1 4 0 0 1 5 0 0 1 6 0 0 1 7 0 0 1 8 0 0 1 9 0 0 2 0 0 0 2 1 0 0 2 2 0 0 2 3 0 0 2 4 0 0 2 5 0 0 2 6 0 0 2 7 0 0 2 8 0 0 2 9 0 0 3 0 0 0
Days after harvest of previous crop (2003)
ECOSSE (Fertilized) -20 0 20 40 60 80 100 120 DNDC (Unfertilized) -20 0 20 40 60 80 100 120 DAYCENT (Unfertilized) Measured Simulated -20 0 20 40 60 80 100 120 0 1 0 0 2 0 0 3 0 0 4 0 0 5 0 0 6 0 0 7 0 0 8 0 0 9 0 0 1 0 0 0 1 1 0 0 1 2 0 0 1 3 0 0 1 4 0 0 1 5 0 0 1 6 0 0 1 7 0 0 1 8 0 0 1 9 0 0 2 0 0 0 2 1 0 0 2 2 0 0 2 3 0 0 2 4 0 0 2 5 0 0 2 6 0 0 2 7 0 0 2 8 0 0 2 9 0 0 3 0 0 0
Days after harvest of previous crop (2003)
[image:8.595.84.540.110.324.2] [image:8.595.116.514.356.677.2](seasonal/annual), whilst the ECOSSE model overestimated these by 59% (Table 3). Based on an 8-year aver-age, the DNDC simulated total N2O fluxes for the fertilized (207 kg∙N∙ha−1) and unfertilized (81 kg∙N∙ha−1) fields were 2 - 15 times lower than the estimates provided by the other two models. The DNDC-simulated values resulted in significant underestimation of N2O EFs, whilst those derived from DailyDayCent, and the ECOSSE were closer to those calculated from measured values. Compared to the annual EFs derived from measured val-ues, DNDC was 94% lower, DailyDayCent 44% lower, and ECOSSE 35% lower. An estimation discrepancy for total fluxes between integrated values and the corresponding sum of daily fluxes and thereby EFs was observed. On an 8-year average, the simulated N2O EF was 0.09% with DNDC, 0.31% with DailyDayCent and 0.52% with the ECOSSE model.
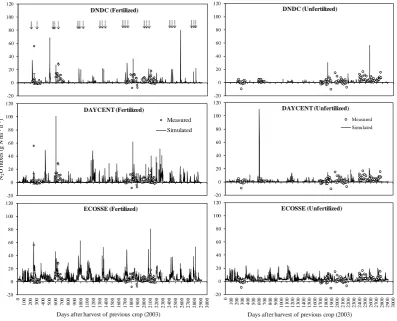
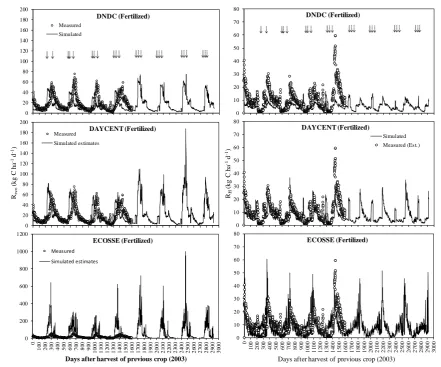
3.2.2. Ecosystem and Heterotrophic Respiration
The Reco measured using EC from the large fertilized plot reached a maximum flux of 75.6 kg∙C∙ha−1∙d−1 during crop growth that decreased to 0.59 kg∙C∙ha−1∙d−1 during the non-crop period, corresponding to RH (Figure 3). The DNDC simulated values for Reco showed trends similar to the measured values, with an R2 of 0.34 (p < 0.05), and the total bias and error differences between simulated and measured values were ≤34% and ≤91%, respectively (Table 4). The estimated Reco for the DailyDayCent model also showed trends similar to the meas-ured values, with higher fluxes from 2007 onwards, with an R2 of 0.41 (p < 0.05) and relatively small total bias (≤50%) and error (≤85%) difference between simulated and measured values. All models simulated RH satisfac-torily, with R2 ranging from 0.44 - 0.62 (p < 0.05), with a small bias (≤50%) and error (≤87%) difference be-tween simulated and measured values.
The annual total Reco measured using the EC was on average 6771 kg∙C∙ha−1, which is closer to the Daily-DayCent value (6736) but higher than the DNDC estimate (4455; Table 4). Based on a 4-year average, the es-timated RH based on measured values of Reco was 3624 kg∙C∙ha−1, which is closer to the ECOSSE and the DailyDayCent simulated values, but higher than the DNDC estimate (1794 kg∙C∙ha−1). Based on an 8-year av-erage, the RH differed somewhat from the 4-year average though the simulated amount was similar to the meas-ured value.
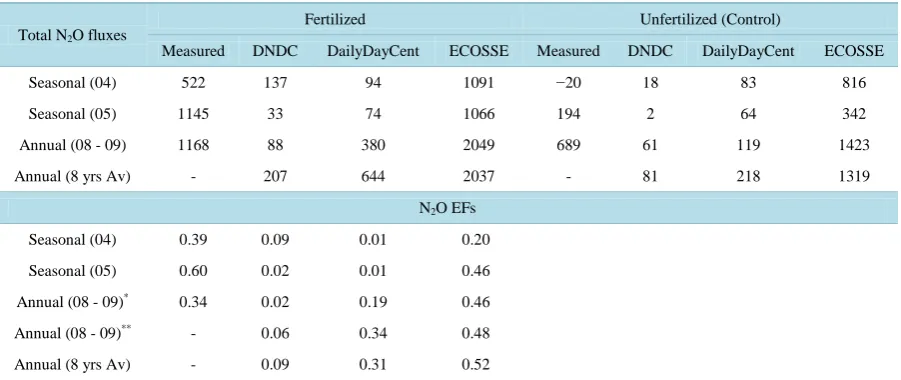
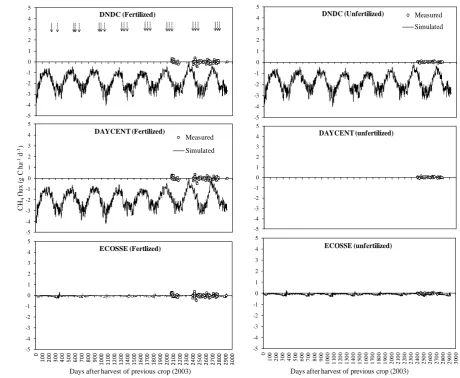
3.2.3. CH4 Fluxes
[image:9.595.88.539.518.708.2]The measured CH4 fluxes (emission and oxidation) were small and differed significantly between the fertilized (−040 to 0.36 g∙C∙ha−1∙d−1) and unfertilized (−0.09 to 0.12) plots (Figure 4). The highest simulated oxidation and emission, respectively, were 2.92 and 0 g∙C∙ha−1∙d−1 with DNDC, 4.02 and 0 with DailyDayCent, and 0.24 and 0.31 with ECOSSE, providing values closer to the measured ones for the fertilized plot only. The DNDC and the DailyDayCent simulated values correlated poorly with the measured values (R2 = 0.02), demonstrating
Table 3.Statistical comparison between simulated and the measured seasonal and annual N2O fluxes (g∙N∙ha−1) and
emis-sion factors (EFs) derived from a conventionally-tilled field cropped to spring barley.
Total N2O fluxes
Fertilized Unfertilized (Control)
Measured DNDC DailyDayCent ECOSSE Measured DNDC DailyDayCent ECOSSE
Seasonal (04) 522 137 94 1091 −20 18 83 816
Seasonal (05) 1145 33 74 1066 194 2 64 342
Annual (08 - 09) 1168 88 380 2049 689 61 119 1423
Annual (8 yrs Av) - 207 644 2037 - 81 218 1319
N2O EFs
Seasonal (04) 0.39 0.09 0.01 0.20
Seasonal (05) 0.60 0.02 0.01 0.46
Annual (08 - 09)* 0.34 0.02 0.19 0.46
Annual (08 - 09)** - 0.06 0.34 0.48
Annual (8 yrs Av) - 0.09 0.31 0.52
Figure 3. Comparison of Eddy Covariance measured (3 years; open circle) CO2 emissions (Reco, soil respiration only;
kg∙C∙ha−1) with values simulated (and/or estimated using DNDC-derived fractions for DailyDayCent and ECOSSE; lines,
solid/dotted including RH, heterotrophic respiration) using the three process-based models over 8 years, commencing from
17 August 2003 (day of harvest), in conventionally-tilled fertilized arable land cropped to spring barley. Solid arrows
[image:10.595.90.532.79.446.2]indi-cate the days of ploughing and dotted arrows indiindi-cate the days of N fertilizer application.
Table 4.Validation of daily soil (Reco) and heterotrophic respiration (RH) simulated by three process-based models with
val-ues measured from spring barley fields.
Statistical parameters Reco RH
Measured DNDC DailyDayCent ECOSSE Measured! DNDC DailyDayCent ECOSSEφ
R2 0.34* 0.41* - - 0.58* 0.62* 0.44*
RMSE (%) 85 91 - - 85 68 87
RE (%) 34 1 - - 50 24 7
MD (%) 6* 0 - - 5* 2* 1*
Total CO2 fluxes kg∙C∙ha−1
Annual total Reco 6771 4455 6736 - - - - -
Annual total RH - 1826 2668 3218
Annual total RH
(4 yrs average) 3624 1794 2744 3387
*
Significant at 5% level of probability. ! = estimated using DailyDayCent derived ratio; φ = Reco estimated using a conversion ratio derived from
DNDC outputs for ECOSSE and DailyDayCent. R2 = Coefficient of determination; RMSE = Root Mean Square Error; RE = Relative Error (Mean); MD = Mean Difference.
0 20 40 60 80 100 120 140 160 180 200 DNDC (Fertilized) Measured Simulated 0 20 40 60 80 100 120 140 160 180 200 Re co (kg C ha -1 d -1) DAYCENT (Fertilized) Measured Simulated estimates 0 200 400 600 800 1000 1200 0 1 0 0 2 0 0 3 0 0 4 0 0 5 0 0 6 0 0 7 0 0 8 0 0 9 0 0 1 0 0 0 1 1 0 0 1 2 0 0 1 3 0 0 1 4 0 0 1 5 0 0 1 6 0 0 1 7 0 0 1 8 0 0 1 9 0 0 2 0 0 0 2 1 0 0 2 2 0 0 2 3 0 0 2 4 0 0 2 5 0 0 2 6 0 0 2 7 0 0 2 8 0 0 2 9 0 0 3 0 0 0
Days after harvest of previous crop (2003) ECOSSE (Fertilized) Measured Simulated estimates 0 10 20 30 40 50 60 70 80 DNDC (Fertilized) 0 10 20 30 40 50 60 70 80 RH (kg C ha -1 d -1) DAYCENT (Fertilized) Simulated Measured (Est.) 0 10 20 30 40 50 60 70 80 0 1 0 0 2 0 0 3 0 0 4 0 0 5 0 0 6 0 0 7 0 0 8 0 0 9 0 0 1 0 0 0 1 1 0 0 1 2 0 0 1 3 0 0 1 4 0 0 1 5 0 0 1 6 0 0 1 7 0 0 1 8 0 0 1 9 0 0 2 0 0 0 2 1 0 0 2 2 0 0 2 3 0 0 2 4 0 0 2 5 0 0 2 6 0 0 2 7 0 0 2 8 0 0 2 9 0 0 3 0 0 0
Days after harvest of previous crop (2003)
[image:10.595.93.536.535.691.2]Figure 4. Comparison of field measured (seasonal/annual; open circle/square with vertical bars as standard errors) CH4
emissions/oxidation (g∙N∙ha−1) with values simulated (line) using the three process-based models over 8 years, commencing
from 17 August 2003 (day of harvest), in conventionally-tilled fertilized arable land cropped to spring barley. Solid arrows
indicate the days of ploughing and dotted arrows indicate the days of N fertilizer application.
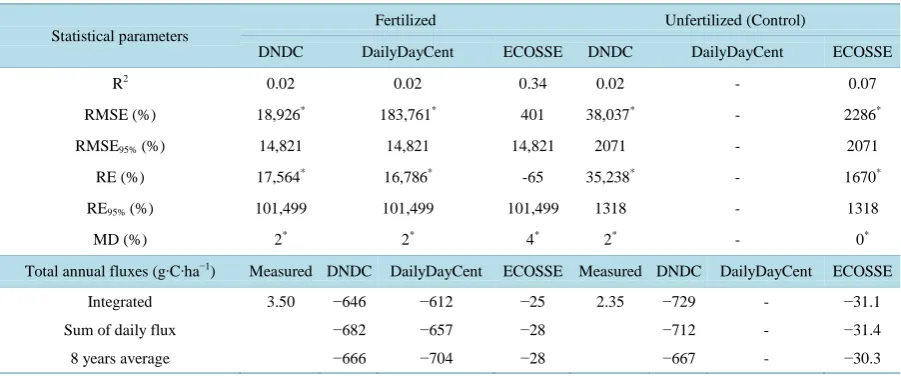
large bias and error differences between them (Table 5). The ECOSSE simulated values correlated well (R2 = 0.34, p < 0.05), with the total bias and error differences between simulated and measured values were at < 95% confidence intervals. For the unfertilized plots, either model estimates showed low R2 values, large total biases and errors.
Annual budgets based on the measured data showed the arable land to be a small CH4 source, with an emis-sion of 2.35 g∙C∙ha−1 from the unfertilized plot, increasing to 3.50 g∙C∙ha−1 for the fertilized plot (Table 5). For an 8-year average, the model estimates indicated that cropland was a sink for CH4, with the annual oxidation of 666 g∙C∙ha−1 predicted by DNDC, 704 g∙C∙ha−1 from the DailyDayCent and 28 g∙C∙ha−1 from the ECOSSE models. The integrated and sum of the daily flux approaches taken to calculate total CH4 fluxes showed a small difference.
4. Discussion
4.1. Performance of the Models in Simulating Nitrate-N Concentrations
Compared to the unfertilized field, the measured soil NO3− concentration in the fertilized plot following CAN fertilizer application was higher. The decrease in soil NO3− concentration over time is pre-assumed to have been due to plant uptake and other N loss processes, such as leaching. The DailyDayCent and DNDC-predicted
-5 -4 -3 -2 -1 0 1 2 3 4 5 DNDC (Fertilized) -5 -4 -3 -2 -1 0 1 2 3 4 5 C H4 fl ux (g C ha -1 d -1) DAYCENT (Fertilized) Measured Simulated -5 -4 -3 -2 -1 0 1 2 3 4 5 0 10 0 20 0 30 0 40 0 50 0 60 0 70 0 80 0 90 0 10 00 11 00 12 00 13 00 14 00 15 00 16 00 17 00 18 00 19 00 20 00 21 00 22 00 23 00 24 00 25 00 26 00 27 00 28 00 29 00 30 00
Days after harvest of previous crop (2003)
ECOSSE (Fertlized) -5 -4 -3 -2 -1 0 1 2 3 4 5 0 1 0 0 2 0 0 3 0 0 4 0 0 5 0 0 6 0 0 7 0 0 8 0 0 9 0 0 1 0 0 0 1 1 0 0 1 2 0 0 1 3 0 0 1 4 0 0 1 5 0 0 1 6 0 0 1 7 0 0 1 8 0 0 1 9 0 0 2 0 0 0 2 1 0 0 2 2 0 0 2 3 0 0 2 4 0 0 2 5 0 0 2 6 0 0 2 7 0 0 2 8 0 0 2 9 0 0 3 0 0 0
Days after harvest of previous crop (2003)
ECOSSE (unfertilized) -5 -4 -3 -2 -1 0 1 2 3 4 5
[image:11.595.76.537.81.459.2]Table 5. Validation of daily CH4 effluxes (g∙C∙ha−1∙d−1) simulated by three process-based models with values measured from
spring barley fields and their total fluxes.
Statistical parameters
Fertilized Unfertilized (Control)
DNDC DailyDayCent ECOSSE DNDC DailyDayCent ECOSSE
R2 0.02 0.02 0.34 0.02 - 0.07
RMSE (%) 18,926* 183,761* 401 38,037* - 2286*
RMSE95% (%) 14,821 14,821 14,821 2071 - 2071
RE (%) 17,564* 16,786* -65 35,238* - 1670*
RE95% (%) 101,499 101,499 101,499 1318 - 1318
MD (%) 2* 2* 4* 2* - 0*
Total annual fluxes (g∙C∙ha−1) Measured DNDC DailyDayCent ECOSSE Measured DNDC DailyDayCent ECOSSE
Integrated 3.50 −646 −612 −25 2.35 −729 - −31.1
Sum of daily flux −682 −657 −28 −712 - −31.4
8 years average −666 −704 −28 −667 - −30.3
*Significant at 5% level of probability. R2 = Coefficient of determination; RMSE = Root Mean Square Error; RE = Relative Error (Mean); MD =
Mean Difference.
soil NO3− levels are noisy, and attributed to a mismatch between plant N uptake and other N loss processes, or due to errors associated with the crop growth module, particularly for the latter model. Moreover, the simulated upper or lower limit of NO3− levels are generally above the measurement values. Similar large overestimations were reported by others [24][25][38][45] using the earlier DNDC versions. This may be ascribed to limitations in the ability of the models to accurately account for variable soil depth increments or movement through soils and/or high mineralization of N and rapid nitrification.
The ECOSSE simulated values are closer to the amount of NO3-N applied, in line with the results of other re-searchers [36], and consistent over the 8 years, unlike the simulations predicted by the other two. With the ex-ception of fertilizer-induced peaks in NO3−, there were small differences between fertilized and unfertilized plots. Statistical evaluations confirm that the ECOSSE model can simulate soil NO3− well (R2 = 0.50) for the fertilized field, and that it performs better than DNDC (R2 = 0.31) and DailyDayCent (R2 = 0.14). However, all the models have difficulties in predicting background levels of soil NO3−, though the total bias and error differ-ences are within their 95% confidence intervals, in line with the DNDC v9.2 estimates [25].
4.2. Simulation Capacity of the Models for GHG Emissions
4.2.1. N2O Emissions
Simulated N2O emissions using the three models are reasonably consistent over the different years. However, all models are unable to predict N2O fluxes less than zero. This contrasts with the measured values where a sink of N2O under conditions of low oxygen and/or mineral N was observed [7] [46]. DailyDayCent simulated N2O fluxes reasonably well. The total bias and error differences are somewhat large but within their 95% confidence levels. This indicates a high predictive potentials for the models although only the ECOSSE-simulated values show a significant relationship with the measured ones under fertilized conditions, in agreement with other ob-servations [36][38]. Higher R2 values for cumulative N2O fluxes derived from DNDC simulated values were reported by other workers [25] but these did not correspond with the daily fluxes. Similar strong relationships for total N2O fluxes might be achieved from the other two models; however, the overall performance mainly depends on daily fluxes. Given that the simulated values were within the 95% confidence intervals, none of the models simulated daily N2O fluxes particularly well for the unfertilized field. Thus, an appropriate methodo-logical compromise for the calculation of EFs may not be achievable without considering other factors control-ling N2O emissions.
and their relationship with key driving forces such as soil water and NO3
− levels are assumed to be functionally
related to the production and release of N2O [28]. These are consistent with the DNDC and the DailyDay-Cent-simulated peaks. This indicates that both models consider denitrification as the major contributor to N2O production. In contrast, nitrification might be the major pathway in the ECOSSE model and the N2O fluxes are reasonably consistent with the simulated NO3
− levels; however, further enhancement of the emissions is
possi-ble with increasing soil water contents provided that substrate supply is not limiting [37]. The results from ECOSSE are in general agreement with the literature values for total N2O emissions from crop fields, which range from 0.7 to 3.5 kg∙N∙ha−1∙yr−1[47]-[50]. The inconsistencies and uncertainties in the modelled predictions are thought to be partially associated with differences in model version, methods of data analyses, and crop managements between years as well as the use of default values particularly for DNDC and DailyDayCent.
Similarly, a large underestimations of N2O EFs by DNDC as well as by DailyDayCent, compared to the meas-ured data, are evident. Estimation of EFs using simulated values is constrained by total flux differences between the fertilized and unfertilized plots. Replacement of unfertilized values by using background annual N2O emis-sions of 1 kg∙N∙ha−1[41] could also be erroneous. Similar overall underestimations, particularly using the earlier versions of DNDC, have been reported [24] [25][51]. This may be attributed to the limited number of field measurements, as this could result in large uncertainties in the measured values [52]. The fact that the Daily-DayCent model also underestimated the N2O EF (44%), with similar findings using DayCent (~25%), when com-pared with the default annual value, was reported by Del Grosso et al. (2005). In contrast, the ECOSSE model, on average, increased the EF by 35%, but was within a closer range of the measured estimate (0.52%). This is in line with the previous version of the model used [53], although it is still lower than the IPCC default value (1%).
There is a discrepancy between the integration approach and the corresponding sum of daily fluxes in calcu-lating the total/cumulative N2O fluxes, which may under or overestimate the values, depending on the corre-sponding peak sizes, and thereby influence the EFs. Nitrous oxide emissions show large temporal and/or spatial variability [54], resulting in an EF uncertainty of >50% [55][56]. This uncertainty could be more significant over several years of measurements than management-induced variations [49] [57]. However, the lower meas-ured total N2O fluxes and the corresponding EFs may be explained by the application of CAN during a rela-tively dry period, leading to less denitrification, and a higher SOC density, which is favourable for complete de-nitrification to occur under anoxic conditions. The above statement remains equivocal due to intermittent gas sampling, suggesting the need for intensive/continuous sampling to cover the impact of tillage, fertilization, rainfall events and other environmental factors that regulate the degree of N2O emissions. Moreover, further im-provements of the models by identifying errors associated with the processes that interactively produce N2O are imperative. The use of more robust measurement protocols are also required for accurate validation and calcula-tion of N2O EFs across disaggregated land use types and in response to different management practices.
4.2.2. Ecosystem and Heterotrophic Respiration
The simulated values for Reco from both DailyDayCent and DNDC demonstrated good correlation with the measured values (R2 = 0.41 versus 0.34, p < 0.05), with relatively small total bias and error differences. Like-wise, DNDC simulates well the cumulative CO2 fluxes of cropland sites in Europe, except for some overestima-tion of net CO2 uptake [58]. It was found that DayCent provided robust simulated CO2 emissions for various land use systems [18]. Our study indicates that a further improvement of both models is required to remove the discrepancy with regard to the mis-match between the simulated CO2 peaks and the measured values. Irrespec-tive of the models, this shift cannot be seen for RH in the modelled values, which correlated well (R2 = 0.44 - 0.62; p < 0.05), with small biases and errors. The DailyDayCent and DNDC simulated RH better than ECOSSE. The relatively poor performance of ECOSSE is probably due to the estimation errors associated with the re-quirement to convert the measured Reco data to RH.
was reported that DNDC may not predict Reco perfectly, due to some limitations in the crop growth module [66]. The crop growth module has an application of a sigmoid curve based upon degree days which require additional parameters, e.g. base temperature, degree days of phenology stages and radiation use efficiency to correctly de-fine the growth curves for crops in terms of temporal carbon take up. Despite having a lower R2, the ECOSSE model simulated total RH values that were closer to the measured values, whilst the DailyDayCent and DNDC values underestimated it. Similar values based on the 8-year average were also observed, implying that the ECOSSE predicts RH better than the other two models. This can be attributed to the absence of crop growth and biomass-related inputs to run the models.
4.2.3. CH4 Emission/Oxidation
The measured data demonstrated both CH4 emissions and oxidation though the magnitude of the fluxes was relatively small. This might be linked to the contribution of RH with simultaneous influence of mainly soil water contents/precipitation events creating aerobic and anaerobic conditions [8]. The measured peaks for CH4 show a stimulating effect of N fertilization on both emissions and oxidation. The three models are unable to predict similar trends, and are assumed to be constrained by several regulating factors, so that consideration of the flux variations between fertilized and unfertilized fields may not be appropriate for judging the model’s performance. Both DNDC and DailyDayCent predict CH4 oxidation, in line with former versions [38][67], and the ECOSSE also provided values closer to the measured ones, showing small sources, particularly for the fertilized field. The simulated and measured values are poorly correlated, including remarkably high total bias and error differences, particularly with the DNDC and DailyDayCent models. The modified version of ECOSSE used in this study performs better (R2 = 0.34) than the previous one [53]. Although the CH4 fluxes from arable lands might have less impact in terms of overall GHG accounting the functional relationship between C and N emissions need to be improved for accurate estimations.
The measured data show that cropland is a CH4 source that increases with the application of N fertilizer, indi-cating fertilizer-induced limitation for CH4 oxidation to occur. Arable soils are mainly considered as a sink rather than a source of CH4[8][68]. Indeed, tillage and N fertilization have a tendency to reduce oxidation po-tentials [69]. Increased CH4 oxidation in arable soils [46] may be linked to well aerated conditions with a posi-tive redox potential that limits methanogenic activities through draining, coupled with ploughing [70]. The three models also demonstrated an annual reduction in CH4 oxidation from the N fertilizer-treated plots compared to the unfertilized ones. However, the higher predicted oxidation with the DNDC and DailyDayCent models com-pared to ECOSSE indicates that annual estimates are not in agreement with the amounts of mineral N either mineralized and/or applied as fertilizer. These results suggest that functional constraints on the DailyDayCent and DNDC models for predicting CH4 emissions were greater, in comparison to the ECOSSE model and as-sumed to be mainly due to input parametric limitations.
5. Conclusion
Compared to the measured values, ECOSSE could simulate nitrate concentration more robustly than DNDC and DailyDayCent. Both DNDC and DailyDayCent underestimated daily and total N2O fluxes compared to ECOSSE, providing an improved prediction of fertilizer-induced N2O fluxes and EFs. All models could simulate soil and/or heterotrophic respiration adequately, except for an underestimation with DNDC that may be related to the greater impact of variations in soil properties compared to other model predictions. Only the ECOSSE model was able to predict field CH4 emissions/oxidation that were closer to the measured ones, and demonstrate the overall dominance of oxidation processes. There are constraints in terms of processes and driving forces in all the models for predicting coupled C and N emissions, leading to the underestimation of GHGs. Thus, refinement and further validation of the models using country-specific activity data are required to better predict GHG emis-sions. In addition, to avoid a dependency on default inputs that may lead to significant errors in the model outputs more measurements are required that account for temporal and spatial variability. Furthermore, validations and sensitivity tests need to focus more on site-related characteristics, land use differences, management interven-tions, and climatic factors for providing national GHG estimates and for identification of mitigation options.
Acknowledgements
the Environment (STRIVE) Programme of the Irish Government under the National Development Plan 2007-2013 and the Department of the Environment, Heritage and Local Government. The authors would like to thanks Phillip O’Brien (EPA) for extending technical and relevant support; Mike Williams, Mike Jones and Matt Saunders (TCD), Komsan Rueangritsarakul and Mohamed Helmy (UCD) for supplying experimental data for modelling work; as well as Tom Bolger and Tommy Gallagher (UCD) for providing administrative support.
References
[1] IPCC (2007) Climate Change 2007: The Physical Science Basis. In: Solomon, S., Qin, D., Manning, M., Chen, Z., Marquis, M., Averyt, K.B., Tignor, M. and Miller, H.L., Eds., Contribution of Working Group I to the Fourth Assess-ment Report of the IntergovernAssess-mental Panel on Climate Change, Cambridge University Press, Cambridge, 996 p. [2] Weiske, A. and Petersen, S.O. (2006) Mitigation of Greenhouse Gas Emissions from Livestock Production. Agriculture,
Ecosystems and Environment, 112, 105-106. http://dx.doi.org/10.1016/j.agee.2005.08.009
[3] Duffy, P., Hanley, E., Black, K., O’Brien, P., Hyde, B., Ponzi, J. and Alam, S. (2015) Ireland’s National Inventory Report 2015. Greenhouse Gas Emissions 1990-2013 Reported to the United Nations Framework Convention on Climate Change. Environmental Protection Agency (An Ghníomhaireacht um Chaomhnú Comhshaoil), Wexford, Ireland, 609 p.
[4] Conrad, R. (1996) Soil Microorganisms as Controllers of Atmospheric Trace Gases (H2, CO, CH4, OCS, N2O, and NO). Microbiology Review, 60, 609-640.
[5] Drury, C.F., Oloya, T.O., McKenney, D.J., Gregorich, E.G., Tan, C.S. and van Luyk, C.L. (1998) Long-Term Effects of Fertilization and Rotation on Denitrification and Soil Carbon. Soil Science Society of America Journal, 62, 1572- 1579. http://dx.doi.org/10.2136/sssaj1998.03615995006200060014x
[6] Chan, A.S.K. and Parkin, T.B. (2001) Effect of Land Use on Methane Flux from Soil. Journal of Environmental Qual-ity, 30, 786-797. http://dx.doi.org/10.2134/jeq2001.303786x
[7] Khalil, M.I., Rosenani, A.B., Van Cleemput, O., Fauziah, C.I. and Shamshuddin, J. (2002) Nitrous Oxide Emission from an Ultisol of the Humid Tropics under Maize-Groundnut Rotation. Journal of Environmental Quality, 31, 1071- 1078. http://dx.doi.org/10.2134/jeq2002.1071
[8] Khalil, M.I. and Baggs, E.M. (2005) Soil Water-Filled Pore Space Affects the Interaction between CH4 Oxidation,
Ni-trification and N2O Emissions. Soil Biology and Biochemistry, 37, 1785-1794.
http://dx.doi.org/10.1016/j.soilbio.2005.02.012
[9] Stehfest, E. and Bouwman, L. (2006) N2O and NO Emission from Agricultural Fields and Soils under Natural
Vegeta-tion: Summarizing Available Measurement Data and Modeling of Global Annual Emissions. Nutrient Cycling in Agroecosystems, 74, 207-228. http://dx.doi.org/10.1007/s10705-006-9000-7
[10] Rochette, P., Angers, D.A., Chantigny, M.H., Gagnon, B. and Bertrand, N. (2008) N2O Fluxes in Soils of Contrasting
Textures Fertilized with Liquid and Solid Dairy Cattle Manures. Canadian Journal of Soil Science, 88, 175-187.
http://dx.doi.org/10.4141/CJSS06016
[11] Richter, J. and Roelcke, M. (2000) The N-Cycle as Determined by Intensive Agriculture: Examples from Central Europe and China. Nutrient Cycling in Agroecosystems, 57, 33-46. http://dx.doi.org/10.1023/A:1009802225307
[12] Khalil, M.I. and Inubushi, K. (2007) Possibilities to Reduce Rice Straw-Induced Global Warming Potential of a Sandy Paddy Soil by Combining Hydrological Manipulations and Urea-N Fertilizations. Soil Biology and Biochemistry, 39, 2675-2681. http://dx.doi.org/10.1016/j.soilbio.2007.05.003
[13] Oenema, O., Bannink, A., Sommer, S.G. and Velthof, G.L. (2001) Gaseous Nitrogen Emissions form Livestock Farm-ing Systems. In: Follett, R.F., Hatfield, J.L., Eds., Nitrogen in the Environment: Sources, Problems, and Management Ch. 10, Elsevier, Amsterdam, 255-289. http://dx.doi.org/10.1016/B978-044450486-9/50012-1
[14] IPCC (1996) Chapter 5, Land-Use Change and Forestry. Revised 1996 Guidelines for National Greenhouse Gas In-ventories. In: Reference Manual, The Intergovernmental Panel on Climate Change, Blacknell, 5.6-5.75.
[15] IPCC (2006) Agriculture, Forestry and Other Land Use. In: Eggleston, H.S., Buendia, L., Miwa, K., Ngara, T., Tanabe K., Eds., IPCC Guidelines for National Greenhouse Gas Inventories, Institute for Global Environmental Strategies, Hayama, Prepared by the National Greenhouse Gas Inventories Programme.
[16] Giltrap, D.L., Li, C. and Saggar, S. (2010) DNDC: A Process-Based Model of Greenhouse Gas Fluxes from Agricul-tural Soils. Agriculture, Ecosystems and Environment, 136, 292-300. http://dx.doi.org/10.1016/j.agee.2009.06.014
[17] Ambus, P. and Christensen, S. (1995) Spatial and Seasonal Nitrous Oxide and Methane Fluxes in Danish Forest-, Grassland-, and Agroecosystems. Journal of Environmental Quality, 24, 993-1001.
http://dx.doi.org/10.2134/jeq1995.00472425002400050031x
Emis-sions from Soils at Three Temperate Agricultural Sites: Simulations of Year-Round Measurements by Four Models.
Nutrient Cycling in Agroecosystems, 52, 77-105. http://dx.doi.org/10.1023/A:1009780109748
[19] Li, C., Frolking, S. and Harriss, R. (1994) Modeling Carbon Biogeochemistry in Agricultural Soils. Global Biogeo-chemical Cycles, 8, 237-254. http://dx.doi.org/10.1029/94GB00767
[20] Parton, W.J., Hartman, M.D., Ojima, D.S. and Schimel, D.S. (1998) DAYCENT: Its Land Surface Submodel: Descrip-tion and Testing. Global and Planetary Change, 19, 35-48.http://dx.doi.org/10.1016/S0921-8181(98)00040-X
[21] Del Grosso, S.J., Parton, W.J., Mosier, A.R., Hartman, M.D., Brenner, J., Ojima, D.S. and Schimel, D.S. (2001) Simu-lated Interaction of Carbon Dynamics and Nitrogen Trace Gas Fluxes Using the DAYCENT Model. In: Schaffer, M., Ma, L. and Hansen, S., Eds., Modeling Carbon and Nitrogen Dynamics for Soil Management, CRC Press, Boca Raton, 303-332.
[22] Smith, J.U., Gottschalk, P., Bellarby, P.J., Chapman, S., Lilly, A., Towers, W., et al. (2010) Estimating Changes in Na-tional Soil Carbon Stocks Using ECOSSE—A New Model That Includes Upland Organic Soils. Part I. Model Descrip-tion and Uncertainty in NaDescrip-tional Scale SimulaDescrip-tions of Scotland. Climate Research, 45, 179-192.
http://dx.doi.org/10.3354/cr00899
[23] Gottschalk, P., Wattenbach, M., Neftel, A., Fuhrer, J., Jones, M., Lanigan, G., et al. (2007) The Role of Measurement Uncertainties for the Simulation of Grassland Net Ecosystem Exchange (NEE) in Europe. Agriculture, Ecosystems and Environment, 121, 175-185. http://dx.doi.org/10.1016/j.agee.2006.12.026
[24] Abdalla, M., Wattenbach, M., Smith, P., Ambus, P., Jones, M. and Williams, M. (2009) Application of the DNDC Model to Predict Emissions of N2O from Irish Agriculture. Geoderma, 151, 327-337.
http://dx.doi.org/10.1016/j.geoderma.2009.04.021
[25] Abdalla, M., Rueangritsarakul, K., Jones, M., Osborne, B., Helmy, M., Roth, B., et al. (2012) How Effective Is Re-duced Tillage-Cover Crop Management in Reducing N2O Fluxes from Arable Crop Soils? Water, Air and Soil Pollu-tion, 223, 5155-5174. http://dx.doi.org/10.1007/s11270-012-1268-4
[26] Li, D., Lanigan, G. and Humphreys, J. (2011) Measured and Simulated N2O Emissions from Ryegrass and Ryegrass/
Clover Swards in a Moist Temperate Climate. PLoS ONE, 6, e26176. http://dx.doi.org/10.1371/journal.pone.0026176
[27] Rafique, R., Peichl, M., Hennessy, D. and Kiely, G. (2011) Evaluating Management Effects on Nitrous Oxide Emis-sions from Grasslands Using the Process-Based DeNitrification-DeComposition (DNDC) Model. Atmospheric Envi-ronment, 45, 6029-6039. http://dx.doi.org/10.1016/j.atmosenv.2011.07.046
[28] Xu, X., Liu, W., Zhang, C. and Kiely, G. (2011) Modeling the Change in Soil Organic Carbon of Grassland in Re-sponse to Climate Change: Effects of Measured versus Modeled Carbon Pools for Initializing the Rothamsted Carbon Model. Agriculture, Ecosystems and Environment, 140, 371-382.http://dx.doi.org/10.1016/j.agee.2010.12.018
[29] Byrne, K. and Kiely, G. (2012) Evaluation of Models (PaSim, RothC, CENTURY and DNDC) for Simulation of Grassland Carbon Cycling at Plot, Field and Regional Scale.
http://www.epa.ie/pubs/reports/research/land/STRIVE_20_Byrne_GrassCarbonCycling_web.pdf [30] CSO (Central Statistics Office) (2016) Agriculture-Area Yield and Production of Selected Crops for 2014.
http://www.cso.ie/quicktables/GetQuickTables.aspx?FileName=AQA04.asp&TableName=Area+Yield+and+Productio n+of+Selected+Crops
[31] Khalil, M.I., Kiely, G., O’Brien, P. and Müller, C. (2013) Organic Carbon Stocks in Agricultural Soils in Ireland Using Combined Empirical and GIS Approaches. Geoderma, 193-194, 222-235.
http://dx.doi.org/10.1016/j.geoderma.2012.10.005
[32] Abdalla, M., Jones, M., Ambus, P. and Williams, M. (2010) Emissions of N2O from Irish Arable Soils: Effects of
Till-age and Reduced N Input. Nutrient Cycling in Agroecosystems, 86, 53-65.
http://dx.doi.org/10.1007/s10705-009-9273-8
[33] Abdalla, M., Jones, M. and Williams. M. (2010) Simulation of N2O Fluxes from Irish Arable Soils: Effect of Climate
Change and Management. Biology and Fertility of Soils, 46, 247-260.http://dx.doi.org/10.1007/s00374-009-0424-5
[34] Davis, P.A., Clifton Browne, J., Saunders, M., Lanigan, G., Wright, E., Fortune, T., et al. (2010) Assessing the Effects of Agricultural Management Practices on Carbon Fluxes: Spatial Variation and the Need for Replicated Estimates of Net Ecosystem Exchange. Agricultural and Forest Meteorology, 150, 564-574.
http://dx.doi.org/10.1016/j.agrformet.2010.01.021
[35] Compton, J.E. and Boone, R.D. (2000) Long-Term Impacts of Agriculture on Soil Carbon and Nitrogen in New Eng-land Forests. Ecological Society of America, 81, 2314-2330.
http://dx.doi.org/10.1890/0012-9658(2000)081[2314:ltioao]2.0.co;2
[37] Khalil, M.I., Richards, M., Osborne, B., Williams, M. and Müller, C. (2013) Simulation and Sensitivity of Greenhouse Gas Emissions and SOC Stock to Arable Site Characteristics and Management Using the ECOSSE Model. Atmos-pheric Environment, 81, 616-624. http://dx.doi.org/10.1016/j.atmosenv.2013.09.038
[38] Smith, P., Martino, D., Cai, Z., Gwary, D., Janzen, H., Kumar, P., et al. (2007) Agriculture. In: Metz, B., Davidson, O.R., Bosch, P.R., Dave, R. and Meyer, L.A., Eds., Climate Change 2007: Mitigation. Contribution of Working Group III to the 4th Assessment Report of the Intergovernmental Panel on Climate Change, Cambridge University Press, Cambridge, 497-540.
[39] Li, C.S. (2000) Modeling Trace Gas Emissions from Agricultural Ecosystems. Nutrient Cycling in Agroecosystems, 58, 259-276. http://dx.doi.org/10.1023/A:1009859006242
[40] Li, C.S. (2007) Quantifying Greenhouse Gas Emissions from Soils: Scientific Basis and Modeling Approach. Soil Sci-ence and Plant Nutrition, 53, 344-352. http://dx.doi.org/10.1111/j.1747-0765.2007.00133.x
[41] Parton, W.J., Mosier, A.R., Ojima, D.S., Valentine, D.W., Schimel, D.S., Weier, K. and Kulmala, A.E. (1996) Gener-alized Model for N2 and N2O Production from Nitrification and Denitrification. Global Biogeochemical Cycles, 10,
401-412.http://dx.doi.org/10.1029/96GB01455
[42] Del Grosso, S.J., Ojima, D.S., Parton, W.J., Mosier, A.R., Petereson, G.A. and Schimel, D.S. (2002) Simulated Effects of Dryland Cropping Intensification on Soil Organic Matter and Greenhouse Gas Exchanges Using the DAYCENT Ecosystem Model. Environmental Pollution, 116, S75-S83. http://dx.doi.org/10.1016/s0269-7491(01)00260-3
[43] Del Grosso, S.J., Parton, W.J., Adler, P.R., Davis, S., Keogh, C. and Marx, E. (2012) DayCent Model Simulations for Estimating Soil Carbon Dynamics and Greenhouse Gas Fluxes from Agricultural Production Systems. Book Chapter, Elsevier Inc., New York, 241-250. http://dx.doi.org/10.1016/b978-0-12-386897-8.00014-0
[44] Smith, J.U. and Smith, P. (2010) A Worksheet to Compare Modelled with Measured Results (MODEVAL v2.0). School of Biological Sciences, University of Aberdeen, Aberdeen.
[45] Del Grosso, S.J., Mosier, A.R., Parton, W.J. and Ojima, D.S. (2005) DAYCENT Model Analysis of Past and Contem-porary Soil N2O and Net Greenhouse Gas Flux for Major Crops in the USA. Soil and Tillage Research, 83, 9-24.
http://dx.doi.org/10.1016/j.still.2005.02.007
[46] Chapuis-Lardy, L., Wrange, N., Metay, A., Chotte J.L. and Bernoux, M. (2007) Soils, a Sink for N2O? A Review. Global Change Biology, 13, 1-17. http://dx.doi.org/10.1111/j.1365-2486.2006.01280.x
[47] Kaiser, E.A. and Heinemeyer, O. (1996) Temporal Changes in N2O-Losses from Two Arable Soils. Plant and Soil, 181,
57-63. http://dx.doi.org/10.1007/BF00011292
[48] Flessa, H., Wild, U., Klemisch, M. and Pfadenhauer, J. (1998) Nitrous Oxide and Methane Fluxes from Organic Soils under Agriculture. European Journal of Soil Science, 49, 327-335. http://dx.doi.org/10.1046/j.1365-2389.1998.00156.x
[49] Kaiser, E.A., Kohrs, K., Kucke, M., Schnug, E., Heinemeyer, O. and Munch, J.C. (1998) Nitrous Oxide Release from Arable Soil: Importance of N Fertilization, Crops and Temporal Variation. Soil Biology and Biochemistry, 30, 1553- 1563. http://dx.doi.org/10.1016/S0038-0717(98)00036-4
[50] De Gryze, S., Wolf, A., Kaffka, S.R., Mitchell, J., Rolston, D.E., Temple, S.R., Lee, J. and Six, J. (2010) Simulating Greenhouse Gas Budgets of Four California Cropping Systems under Conventional and Alternative Management.
Ecological Applications, 20, 1805-1819. http://dx.doi.org/10.1890/09-0772.1
[51] Beheydt, D., Boeckx, P., Sleutel, S., Li, C. and Van Cleemput, O. (2007) Validation of DNDC for 22 Long-Term N2O
Field Emission Measurements. Atmospheric Environment, 41, 6196-6211.
http://dx.doi.org/10.1016/j.atmosenv.2007.04.003
[52] Parkin, T.B. (2008) Effect of Sampling Frequency on Estimates of Cumulative Nitrous Oxide Emissions. Journal of Environmental Quality, 37, 1390-1395. http://dx.doi.org/10.2134/jeq2007.0333
[53] Khalil, M.I., Smith, J.U., Abdalla, M., O’Brien, P., Smith, P. and Müller, C. (2012) Simulation of Greenhouse Gases and Organic Carbon in an Irish Arable Land Using the ECOSSE Model. Proceedings of the Agricultural Research Fo-rum Meeting, Tullamore, 12-13 March 2012, 110.
[54] Khalil, M.I., Van Cleemput, O., Rosenani, A.B. and Schmidhalter, U. (2007) Daytime, Temporal and Seasonal Varia-tions of N2O Emissions in an Upland Cropping System of the Humid Tropics. Communications in Soil Science and Plant Analysis, 38, 189-204. http://dx.doi.org/10.1080/00103620601094122
[55] Lim, B., Boileau, P., Bonduki, Y., van Amstel, A.R., Janssen, L.H.J.M., Oliveier, J.G.J. and Kroeze, C. (1999) Im-proving the Quality of National Greenhouse Gas Inventories. Environmental Science and Policy, 2, 335-346.
http://dx.doi.org/10.1016/S1462-9011(99)00023-4
[56] Mosier, A., Kroeze, C., Nevison, C., Oenema, O., Seitzinger, S. and van Cleemput, O. (1999) An Overview of the Re-vised 1996 IPCC Guidelines for National Greenhouse Gas Inventory Methodology for Nitrous Oxide from Agriculture.
[57] Clayton, H., McTaggart, I.P., Parker, J., Swan, L. and Smith, K.A. (1997) Nitrous Oxide Emission from Fertilised Grassland: A 2-Year Study of the Effects of N Fertiliser Form and Environmental Conditions. Biology and Fertility of Soils, 25, 252-260. http://dx.doi.org/10.1007/s003740050311
[58] Dietiker, D., Buchmann, N. and Eugster, W. (2010) Testing the Ability of the DNDC Model to Predict CO2 and Water
Vapour Fluxes of a Swiss Cropland Site. Agriculture, Ecosystems and Environment, 139, 396-401.
http://dx.doi.org/10.1016/j.agee.2010.09.002
[59] Raich, J.W. and Schelesinger, W.H. (1992) The Global Carbon Dioxide Flux in Soil Respiration and Its Relationship to Vegetation and Climate. Tellus, 44B, 81-99. http://dx.doi.org/10.1034/j.1600-0889.1992.t01-1-00001.x
[60] Pal, D. and Broadbent, F.E. (1975) Influence of Moisture on Rice Straw Decomposition in Soils. Soil Science Society of America Journal, 39, 59-63. http://dx.doi.org/10.2136/sssaj1975.03615995003900010018x
[61] Weihermüller, L., Huisman, J.A., Graf, A., Herbst, M. and Sequaris, J.-M. (2009) Multistep Outflow Experiments for the Simultaneous Determination of Soil Physical and CO2 Production Parameters. Vadose Zone Journal, 8, 772-782.
http://dx.doi.org/10.2136/vzj2008.0041
[62] Doran, J.W., Mielke, L.N. and Stamatiadis, S. (1988) Microbial Activity and N Cycling as Regulated by Soil Water- Filled Pore Space. In: Witney, B.D., Spoor, G., Soane, B.D. and Douglas, J.T., Eds., Tillage and Traffic in Crop Pro-duction: Proceedings of the 11th International Soil Tillage Research Organization, Vol. 1, International Soil Tillage Research Organization, Edinburgh, 49-54.
[63] Reichstein, M. and Beer, C. (2008) Soil Respiration across Scales: The Importance of a Model-Data Integration Framework for Data Interpretation. Journal of Plant Nutrition and Soil Science, 171, 344-354.
http://dx.doi.org/10.1002/jpln.200700075
[64] Paustian, K., Andrén, O., Janzen, H.H., Lal, R., Smith, P., Tian, G., et al. (1997) Agricultural Soils as a Sink to Miti-gate CO2 Emissions. Soil Use and Management, 13, 230-244. http://dx.doi.org/10.1111/j.1475-2743.1997.tb00594.x
[65] Davidson, E.A., Belk, E. and Boone, R.D. (1998) Soil Water Content and Temperature as Independent or Confounded Factors Controlling Soil Respiration in a Temperate Mixed Hardwood Forest. Global Change Biology, 4, 217-227.
http://dx.doi.org/10.1046/j.1365-2486.1998.00128.x
[66] Abdalla, M., Saunders, M., Hastings, A., Williams, M., Smith, P., Osborne, B., Lanigan, G. and Jones, M.B. (2013) Simulating the Impacts of Land Use in Northwest Europe on Net Ecosystem Exchange (NEE): The Role of Arable Ecosystems, Grasslands and Forest Plantations in Climate Change Mitigation. Science of the Total Environment, 465, 325-336. http://dx.doi.org/10.1016/j.scitotenv.2012.12.030
[67] Li, C.S., Frolking, S. and Butterbach-Bahl, K. (2005) Carbon Sequestration in Arable Soils Is Likely to Increase Ni-trous Oxide Emissions, Offsetting Reductions in Climate Radiative Forcing. Climatic Change, 72, 321-338.
http://dx.doi.org/10.1007/s10584-005-6791-5
[68] Bodelier, P.L.E. and Laanbroek, H.J. (2004) Nitrogen as a Regulatory Factor of Methane Oxidation in Soils and Sedi-ments. FEMS Microbiology and Ecology, 47, 265-277.http://dx.doi.org/10.1016/S0168-6496(03)00304-0
[69] Bronson, K.F. and Mosier, A.R. (1993) Nitrous Oxide Emission and Methane Consumption in Wheat and Corn Cropped Systems in Northeastern Colorado. In: Harper, L.A., Mosier, A.R., Duxbury J.M. and Rolston, D.E., Eds.,
Agricultural Ecosystem Effects on Trace Gases and Global Climate Change, ASA Special Publication No. 55, ASA, CSSA and SSSA, Madison, 133-144.
[70] Borken, W., Xu, Y.-J. and Beese, F. (2003) Conversion of Hardwood Forests to Spruce and Pine Plantations Strongly Reduced Soil Methane Sink in Germany. Global Change Biology, 9, 956-966.
Submit or recommend next manuscript to SCIRP and we will provide best service for you:
Accepting pre-submission inquiries through Email, Facebook, LinkedIn, Twitter, etc. A wide selection of journals (inclusive of 9 subjects, more than 200 journals) Providing 24-hour high-quality service
User-friendly online submission system Fair and swift peer-review system
Efficient typesetting and proofreading procedure
Display of the result of downloads and visits, as well as the number of cited articles Maximum dissemination of your research work