Performance with MIMO for the Downlink 3GPP LTE
Cellular Systems
Yaser Barayan
1, Ivica Kostanic
2,*, Kusay Rukieh
31Electrical and Computer Engineering Department, Florida Institute of Technology, Melbourne, FL 32901 USA 2Electrical and Computer Engineering Department, Faculty, Florida Institute of Technology, Melbourne, FL 32901 USA
3Computer Information Systems Department, Faculty, Florida Institute of Technology, Melbourne, FL 32901 USA *Corresponding Author: [email protected]
Copyright © 2014 Horizon Research Publishing All rights reserved.
Abstract
High spectrum efficiency is one of the goals
for 3GPP Long-term Evolution (LTE) cellular networks. This paper provides evaluation of the downlink (DL) transmission in LTE. The evaluation is performed for a regular hexagonal multi-cell deployment, universal frequency reuse scheme2x2 Multiple Input Multiple Output (MIMO) antenna configuration and varying packet scheduling algorithm. This study evaluates the advantages and benefits of combining several spectrum efficiency improvement techniques over multipath selective fading channel conditions and various bandwidth sizes (BW). The proposed paper compares MIMO improvements to Single Input Single Output (SISO) scenario in terms of cell and user throughputs. The evaluation is performed through a custom simulation package developed for this purpose. .
Keywords
LTE, OFDMA, Scheduling, AMC, MIMO
1. Introduction
High spectrum efficiency and system capacity are primary targets for both 3GPP LTE and LTE-Advanced. The LTE networks are designed with the capability of providing significantly higher data rates and spectrum efficiency when compared with Universal Mobile Telecommunication System (UMTS) and High Speed Downlink Packet Access (HSDPA) release 6[1].
In order to achieve the spectrum efficiency and throughput goals LTE networks utilize several modern techniques. One of the key techniques is Multiple Input – Multiple Output (MIMO) transmission. In MIMO, the air interface communication link uses multiple co-time and co-frequency data streams to improve the overall data throughput. At the receiver the streams are separable due to orthogonality between the channels created by the multiple transmit and receive antennas. In theory, there are significant benefits that can be gained thorough employing MIMO in LTE networks. They include improving downlink peak data rate, average
cell throughput, increasing spectral efficiency even without increasing the average transmit power or frequency bandwidth, decreasing the bit error rate (BER) and hence increasing the reliability of the system, reducing the multipath fading affects due to the increased diversity, and Increasing the cell coverage area [2].
MIMO is the one of the most attractive spectrum efficiency improvement approaches in systems with Orthogonal Frequency Division Multiplexing (OFDM). It is used in Wi-Fi technology, WiMax and 3GPP LTE cellular system. . In OFDM the available system bandwidth is subdivided into a set of orthogonal subcarriers.The bandwidth allocated to each subcarrier is narrower than the coherence bandwidth of the fading channel. In multiple user environment of the LTE downlink, the base station (eNodeB) scheduler manages assignment of the carriers to each individual user. This approach is commonly referred to as the OFDM Access of OFDMA. The OFDMA is well suited for wireless cellular environment due to its robustness to multipath fading, higher spectral efficiency and bandwidth scalability. In LTE the transmission to multiple user equipment terminals (UEs) is managed through allocation of multiple sub-channels (i.e. groups of subcarriers) denoted as physical resource blocks (PRBs).
(MIMO) systems may utilize the concept of beam-forming while employing multiple antennas at transmitter (TX) side and multiple antennas at receiver (RX) side to achieve higher capacity and better cell coverage. Many of the new wireless standards and technologies incorporate MIMO technology. The typical configuration scenario in a MIMO system is to have two antennas receive multiple data streams via different spatial paths, i.e. data streams are transmitted at the same frequency spread out in time. The receiver relies on signal processing to separate the two streams and recover the original data. MIMO configuration is not limited to two input and two outputs (2X2) but it can expand to different multipliers such as (4X4) MIMO and (8x8) MIMO. The two common variants of MIMO are MIMO Matrix A and MIMO Matrix B.
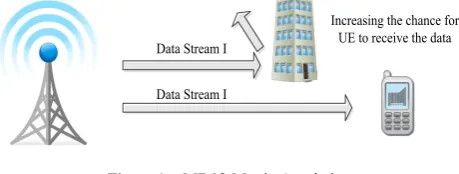
which consists of a single data stream transmitted over multiple paths spaced in time dimension to achieve orthogonality. At the receiver side, the data stream is recovered through diversity combining. MIMO matrix A approach performs best at poor wireless channel condition at the receiver end (due to its robustness in a low SINR value), therefore it effectively improves coverage at cell edge. Multipath in this case is used as an advantage by diversifying the signal path, and sends two copies of the signal using different routes. MIMO Matrix A is best deployed in suburban and rural environments where the SINR might be weaker at the cell edges. It is also applicable for higher speed mobility conditions, where the SINR might be reduced. In these scenarios MIMO Matrix A with a two antenna implementation can double the system link budget and significantly boosting the coverage area. The intent for MIMO Matrix A deployment is to overcome unfavorable wireless transmission condition. Figure 1 depicts MIMO matrix A configuration:
Data Stream I
Data Stream I
[image:2.595.61.291.315.402.2]Increasing the chance for UE to receive the data
Figure 1. MIMO Matrix A technique
[image:2.595.62.284.668.741.2]MIMO MATRIX B utilizes Spatial Multiplexing (SM) which spreads out the desired transmitted data over multiple encoded data streams. The streams are transmitted at the same time, within a same channel but on different transmit antenna (multiplexed in space dimension). This technique enables users to send multiple folds of data streams and hence increases the effective data rate for improved channel capacity. The only limit is the number of antennas that can be installed on the device. In theory, this Spatial Multiplexing (SM) can increase the data rates as a linear function of the number of antennas [1]. MIMO matrix B approach is suited better in conditions of high SINR value (i.e. bandwidth limited), where it improves channel capacity with the multiple data streams. The typical implementation of MIMO matrix B is urban environments where multipath is prevalent. Again Multipath is being used to improve the network data rate. MIMO Matrix B with a two antennas implementation (i.e. two transmit and two receive antennas) may double the throughput over a single antenna implementation case. Figure 2 depicts MIMO matrix B configuration:
Data Stream I
Data Stream II
Doubling of the data rate to UE
Figure 2. MIMO Matrix B technique
To summarize MIMO operation Matrix A is primarily used to improve coverage and Matrix B is used to offer capacity increase. In practical implementation for 4G access network, the system will dynamically switch between Matrix A and Matrix B via Adaptive MIMO. The decision on which approach is used depends on the specific user application, location, or link condition.
In 3GPP LTE network architecture, the eNodeB is the only node between the UE and the core network. Therefore, the eNodeB is responsible for the radio resource management (RRM) functions such as transmission power management, mobility management and radio resource scheduling [2]. Since the bandwidth of wireless communication system is extremely scarce and very expensive, the RRM is central to OFDMA. As a result the radio resource scheduling is a significant process in which the available limited resources are assigned to each active user efficiently and in agreement with the Quality of Service (QoS) requirements.
Various scheduling strategies have been implemented in OFDMA systems. For example, a maximum rate scheduling is demonstrated to enhance both system throughput and fairness in multicarrier OFDMA systems [3]. In [4]-[6] proposed proportional fair (PF) scheduling algorithm that exploits the multiuser diversity to achieve fairness among users without sacrificing the system throughput. Resent research [7]-[11] showed that if both a proper scheduling algorithm along with Adaptive Modulation and Coding (AMC) are utilized in radio resource allocation, substantial performance improvements maybe achieved. Although The LTE standard provides a very flexible radio interface, the allocation of the radio resources is left to the equipment manufacturers. So long as the operation of the scheduler is not standardized, there are many different implementations and one is always faced with the question on how well a particular implementation of a scheduler perform in a given set of circumstances.
One of the main duties of eNodeB is to allocate resources to different UEs based on their Quality of Service requirements (QoS). This process must be done in a robust and fair fashion. The other functions for the eNodeB are listed as:
• Radio bearer controls • Radio admission control • Radio mobility control
• Scheduling and dynamic allocation of resources to UEs in both uplink and downlink.
The study documented in this paper examines the relationship between data rate and scheduling algorithm while varying antenna configuration. Two types of antenna techniques are examined:
• SISO: only one transmits and received antenna used on both the eNodeB and the UEs.
• MIMO 2X2: Two different antennas are used on transmission side and two antennas are used on the receive side.
section II, the scheduling techniques in LTE are introduced, and different approaches that were tasted in the simulator are defined. Simulation setup and channel model are presented in details in section III. Simulation results are discussed in section IV and section V concludes the paper.
2. Scheduling techniques in LTE
In the Medium Access Control (MAC) layer of the eNodeB, the functionality of the scheduler is to distribute the radio resources among UEs served by a given cell. The throughput of each UE and the throughput of the entire cell area are affected by the methodology selected by the scheduling algorithm. Thus, there is a need to evaluate the efficiency of different scheduling methods prior to any practical deployment under most circumstances. The scheduling algorithm is indeed the core part that determines the overall system performance in terms of throughput and fairness. A complete and deep survey of various wireless networks scheduling algorithms are presented and discussed in [12].
In 3GPP LTE networks, there are three basic scheduling algorithm types. They can be easily compared on the basis of fairness and overall throughput. One of the simplest scheduling algorithms is a Round Robin (RR) scheduling. RR provides fairness and identical priority among all UEs within a cell. It assigns the radio resources in equal time slots and in an ordered manner. RR schedules resources fairly, without taking into consideration the channel state conditions experienced by different UEs. However, it is less efficient in providing a high data rate to UEs. It schedules resources from/ to UEs while the UEs are suffering from severe deep fading and its signal to noise ratio is quite poor [13].
An opportunistic scheduler such as the Maximum Rate (MR) scheduling algorithm, on the other hand, prioritizes UEs which have favorable channel state condition. In other words, this MR algorithm schedules the UEs that have higher signal to interference plus noise ratio (SINR) above the required SINR threshold whereas it does not schedule those UEs which experience severe channel fading. As a result, the MR scheduling algorithm provides higher capacity and throughput than any other kind of scheduling algorithms. However, it completely ignores fairness among UEs within a cell. It is well known in wireless cellular systems that UEs located in different distances have different fading conditions. Consequently, scheduling the UEs that have high SINR leads to unfair resource allocation amongst UEs [14].
A Proportional Fair scheduling algorithm (PF) provides balance between fairness and the overall system throughput. It was first presented in code-division multiple access high data-rates (CDMA-HDR) [15, 16], but is now used extensively in OFDMA based systems as well. The algorithm tries is provide fairness among UEs while maximizing the system capacity. This is achieved by means
of exploiting the multiuser diversity over temporally independent channel fluctuations.
The PF algorithm functions as follows: first, the eNodeB obtains the feedback of the instantaneous channel quality condition (CQI) for each UE 𝑘𝑘in time slot t in terms of a requested data rate𝑅𝑅𝑘𝑘,𝑛𝑛(𝑡𝑡). Then, it keeps track of the moving average throughput 𝑇𝑇𝑘𝑘,𝑛𝑛(𝑡𝑡) of each UE 𝑘𝑘 on every physical resource block (PRB) 𝑛𝑛 within a past window 𝑡𝑡𝑐𝑐length. The parameter 𝑡𝑡𝑐𝑐 controls the system latency, that is, if 𝑡𝑡𝑐𝑐 is large, the scheduler approaches MR algorithm; if 𝑡𝑡𝑐𝑐becomes small, the scheduler becomes RR algorithm. The scheduling mechanism gives a priority to the UE 𝑘𝑘∗ in the 𝑡𝑡𝑡𝑡ℎ time slot and PRB 𝑛𝑛 that satisfy the maximum relative channel quality condition:
[
]
[
]
βα
)
(
)
(
max
arg
, , ,.., 2 ,1
T
t
t
R
k
n k n k K k= ∗=
(1)• Ifα=1,β =1, (1) describes PF algorithm. • Ifα =1,β=0, it becomes MR algorithm. • Ifα =0,β =1, it denotes the RR algorithm. The eNodeB updates 𝑇𝑇𝑘𝑘,𝑛𝑛(𝑡𝑡) of the 𝑘𝑘𝑡𝑡ℎ UE in the 𝑡𝑡𝑡𝑡ℎ time slot using the exponential moving average filter given as:
( )
( )
( )
( )
,
.
1
1
,
1
1
1
1
, , , ,
≠
−
=
+
−
=
+
∗ ∗k
k
t
T
t
k
k
t
R
t
t
T
t
t
T
n k c n k c n k c n k
(2)The PF scheduling algorithm treats the PRBs independently, and then updates the system in every time slots.
3. System model
3.1. Simulator Overview
This section represents the enhanced version of the custom system level simulator used in this study. Figure 3 shows major functional blocks of the simulator. The system level simulator has a set of inputs parameters.
• Operating frequency band: represents the frequency band for urban propagation model.
• System Bandwidth: represents the BW allocated for 3GPP LTE system.
• TTI Duration: represents the transmit time interval which is 0.5msec for 6OFDM symbols.
• Frame Duration: represents the frame duration of the LTE channel which is 10msec.
Repeat for N UEs Set eNodBs at X,Y
Coordinations
Distribute Mobile Station Randomly
Match SISO or MIMO AMC based on SINR level Determine the serving eNodB
Calculate the Received Power
Calculate the SINR
Calculate the cumulative Throughput per cell area perform different Scheduling
[image:4.595.114.280.72.435.2]algorithms
Figure 3. System Level Simulator Overview
Figure 4. System Configuration Model
3.2. Simulation Setup
In this section, the system level simulation platform used for the downlink of 3GPP LTE cellular system is presented. The performance of basic packet scheduling algorithms along with (2x2) MIMO vs. SISO antenna configurations under universal frequency reuse and Omni-directional antenna is considered. Moreover, the network scenario consists of 19 cells with UEs that are randomly distributed
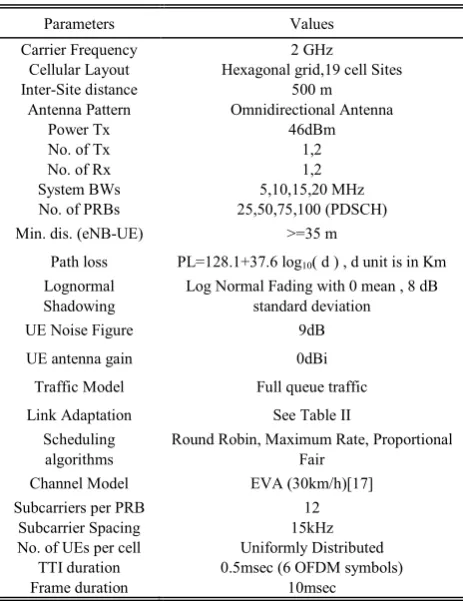
within the network. A carrier frequency of 2 GHz Frequency Division Duplex (FDD), and system bandwidths of 5, 10, 15, 20MHz are considered. For each cell, the radius is 500 meter as it is illustrated in Figure 4. The system bandwidths of 25, 50, 75, 100 PRBs are considered. In frequency domain, each PRB is grouped into 12 adjacent subcarriers and in time domain the duration is one transmit time interval (TTI). The power profile is considered consistent for all PRBs. The details of simulation parameters are summarized in Table I.
Table 1. Simulation Parameters
Parameters Values
Carrier Frequency Cellular Layout Inter-Site distance
Antenna Pattern Power Tx No. of Tx No. of Rx
2 GHz
Hexagonal grid,19 cell Sites 500 m
Omnidirectional Antenna 46dBm
1,2 1,2 System BWs
No. of PRBs 25,50,75,100 (PDSCH) 5,10,15,20 MHz
Min. dis. (eNB-UE) >=35 m
Path loss PL=128.1+37.6 log10( d ) , d unit is in Km
Lognormal
Shadowing Log Normal Fading with 0 mean , 8 dB standard deviation
UE Noise Figure 9dB
UE antenna gain 0dBi
Traffic Model Full queue traffic
Link Adaptation See Table II
Scheduling
algorithms Round Robin, Maximum Rate, Proportional Fair
Channel Model EVA (30km/h)[17]
Subcarriers per PRB Subcarrier Spacing No. of UEs per cell
TTI duration Frame duration
12 15kHz Uniformly Distributed 0.5msec (6 OFDM symbols)
10msec
LTE air interface supports link adaptation. The link adaptation overcomes the fluctuations of the wireless channel using Adaptive Modulation and coding (AMC). The AMC formats are standard in 3GPP LTE technology [18]. Each UE within the coverage area have different instantaneous SINR value (Signal to Interference Noise Ratio) and compare that value to the ACM mapping table II in order to determine the spectral efficiencyof that UE [19]. The AMC adapts modulation scheme and coding rate as follows:
Modulation scheme: if the SINR is high, higher-order modulation schemes with higher spectral efficiency are used, (e.g. 64QAM). In poor channel condition, lower-order modulation scheme such as QPSK is used due to its robustness against errors of the transmission but with lower spectral efficiency.
Coding Rate: For each modulation scheme, a particular coding rate is chosen depending on the channel condition. For higher SINR values higher code rate are used. Using the higher coding rate improves the user throughput.
-2000 -1500 -1000 -500 0 500 1000 1500 2000 -2500
-2000 -1500 -1000 -500 0 500 1000 1500 2000 2500
X axis [m]
Y
a
xi
s [
m
]
[image:4.595.316.548.205.506.2] [image:4.595.76.284.451.616.2]Table2. Adaptive Modulation And Coding Scheme
4bitCQI Modulation Scheme Coding Rate SINR (dB) SISO-Spectral Efficiency (Mbps/HZ) MIMO-Spectral Efficiency (Mbps/Hz)
0 Out of Range
1
QPSK
0.076 -7.27 0.1523 0.3046
2 0.12 -4.76 0.2344 0.4688
3 0.19 -2.06 0.377 0.754
4 0.3 0.61 0.6016 1.2032
5 0.44 2.81 0.877 1.754
6 0.59 4.69 1.1758 2.3516
7
16QAM
0.37 6.29 1.4766 2.9532
8 0.48 8.69 1.9141 3.8282
9 0.6 11.37 2.4063 4.8126
10
64QAM
0.45 13.11 2.7305 5.461
11 0.55 16.44 3.3223 6.6446
12 0.65 19.62 3.9023 7.8046
13 0.75 23.01 4.5234 9.0468
14 0.85 26.19 5.1152 10.2304
15 0.93 28.66 5.5547 11.1094
4. Simulation Results
This section presents simulation results of multiple test case studies which evaluate the performance of a different antenna configuration (SISO and MIMO) technologies with different frequency bandwidth sizes (i.e. 5MHZ, 10MHz, 15MHz,and 20MHZ) along with various scheduling algorithms in downlink LTE cellular system under extended vehicular A (EVA) channel model. The total throughput per cell is used as a measure of effectiveness of each LTE deployment strategy.
Figures5 and 6 provide the cumulative distribution functions (CDF) curve of cell’s scheduling probability versus total cell throughput for SISO vs. MIMO with BW of 5MHz. It is noted that the throughput which ranges from 6-12 Mbps in the MIMO case versus the SISO case which ranges from 3-6 Mbps. Twice the data rate is achieved using MIMO technology.
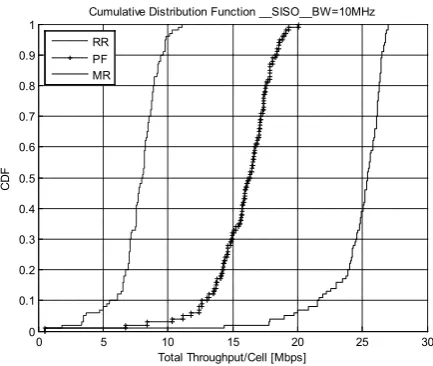
Figures 7 and 8 provide the (CDF) curve of cell’s scheduling probability versus total cell throughput for SISO vs. MIMO with BW of 10MHz. In this case, two parameters are changed simultaneously. The bandwidth increased to 10 MHz, and different antenna technology (SISO and MIMO) is utilized. It noted that the benefit of increasing both parameters is more significant. This trend keeps repeating throughout the different test scenarios. The throughput values points out to the improvements achieved using larger bandwidth and different antenna technology. The values range from 10-20 Mbps in the SISO case versus20-40 Mbps in MIMO case. Twice the data rate is achieved using MIMO technology.
Figures 9 and 10 provide the cumulative distribution
functions (CDF) curve of cell’s scheduling probability versus total cell throughput for SISO vs. MIMO with BW of 15MHz.
It is noted that the throughput which ranges from 50-90 Mbps in the MIMO case versus the SISO case which ranges from 25-45 Mbps. Twice the data rate is achieved using MIMO technology.
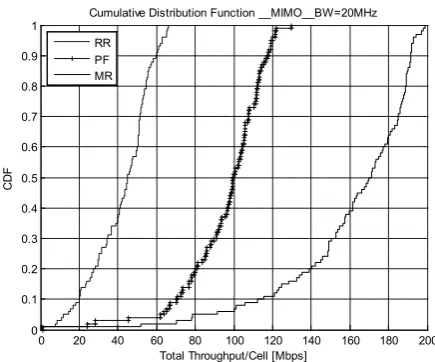
Figures 11 and 12 provide the cumulative distribution functions (CDF) curve of cell’s scheduling probability versus total cell throughput for SISO vs. MIMO with BW of 20MHz. It is noted that the throughput is doubled in the case of MIMO compare to SISO. It is noted that the throughput which ranges from 80-120 Mbps in the MIMO case versus the SISO case which ranges from 40-60 Mbps. Twice the data rate is achieved using MIMO technology.
Figure 5 and 11 show the improvement of the total throughput per cell when adding additional spectrum to the system while maintaining the same antenna technology.
Figure 5 and 12 show the massive improvement of the cell throughput when incorporating both MIMO technologies along with 20MHz of bandwidth. In this case both bandwidth size and antenna technology are changed.
Figure 5. Central cell Throughput for SISO with BW=5MHz
Figure 6. Central cell Throughput for MIMO with BW=5MHz
[image:6.595.69.287.287.476.2]Figure 7. Central cell Throughput for SISO with BW=10MHz
Figure 8. Central cell Throughput for MIMO with BW=10MHz
Figure 9. Central cell Throughput for SISO with BW=15MHz
Figure 10. Central cell Throughput for MIMO with BW=15MHz
0 1 2 3 4 5 6 7
0 0.1 0.2 0.3 0.4 0.5 0.6 0.7 0.8 0.9 1
Total Throughput/Cell [Mbps]
CDF
Cumulative Distribution Function __SISO__BW=5MHz
RR PF MR
0 2 4 6 8 10 12 14
0 0.1 0.2 0.3 0.4 0.5 0.6 0.7 0.8 0.9 1
Total Throughput/Cell [Mbps]
CDF
Cumulative Distribution Function __MIMO__BW=5MHz
RR PF MR
0 5 10 15 20 25 30
0 0.1 0.2 0.3 0.4 0.5 0.6 0.7 0.8 0.9 1
Total Throughput/Cell [Mbps]
CDF
Cumulative Distribution Function __SISO__BW=10MHz
RR PF MR
0 10 20 30 40 50 60
0 0.1 0.2 0.3 0.4 0.5 0.6 0.7 0.8 0.9 1
Total Throughput/Cell [Mbps]
CDF
Cumulative Distribution Function __MIMO__BW=10MHz
RR PF MR
0 10 20 30 40 50 60 70
0 0.1 0.2 0.3 0.4 0.5 0.6 0.7 0.8 0.9 1
Total Throughput/Cell [Mbps]
CDF
Cumulative Distribution Function __SISO__BW=15MHz
RR PF MR
0 20 40 60 80 100 120 140
0 0.1 0.2 0.3 0.4 0.5 0.6 0.7 0.8 0.9 1
Total Throughput/Cell [Mbps]
CDF
Cumulative Distribution Function __MIMO__BW=15MHz
[image:6.595.325.540.291.476.2] [image:6.595.321.540.509.691.2] [image:6.595.68.285.510.693.2]Figure 11. Central cell Throughput for SISO with BW=20MHz
Figure 12. Central cell Throughput for MIMO with BW=20MHz
5. Conclusions
In this paper, multiple performance scenarios of SISO and (2x2) MIMO in downlink LTE cellular network while varying bandwidth sizes and scheduling algorithms are evaluated through a custom built system level simulator. It is found that combining MIMO technique with different bandwidth sizes and various scheduling algorithms will improve the capacity of the system without adding additional infrastructure cost. In some cases, it is not feasible to add more bandwidth through the acquisition of new spectrum. MIMO can be used as an excellent alternative in these deployments. MIMO also can increase the capacity by increasing the number of antennas. 4X4 MIMO can be used to further increase the capacity. Not only does MIMO provide many advantages to increase system capacity throughput, but also it delivers better Quality of Service for the end user experience. Moreover, MIMO technology complements traditional technique, i.e. SISO, in LTE cellular system without the expenses associated with adding
additional spectrum or eNodeBs.
REFERENCES
[1] Long Term Evolution (LTE): A Technical Overview". Motorola. Retrieved July 3, 2010.
[2] Rukieh, Kusay, and Ivica Kostanic. "A Study of Mobile WiMAX Performance using Different Antenna Technologies."
[3] S. Hussain, “Dynamic Radio Resource Management in 3GPP LTE”, Blekinge Institute of Technology, January, 2009.
[4] L. C. Wang and W. J. Lin, "Throughput and fairness enhancement for OFDMA broadband wireless access systems using the maximum C/I scheduling," in Proc Vehicular Technology Conference, 2004, pp. 4696-4700. [5] I. Koutsopoulos and L. Tassiulas, "Channel state-adaptive
techniques for throughput enhancement in wireless broadband networks," in INFOCOM 2001, vol. 2, 2001, pp. 757-766.
[6] H. J. Zhu and R. H. Hafez, "Scheduling schemes for multimedia service in wireless OFDM systems," IEEE Wireless Communications, vol. 14, pp. 99-105, Oct. 2007. [7] N. Ruangchaijatupon and J. Yusheng, "Simple proportional
fairness scheduling for OFDMA frame-based wireless systems," in Proc. IEEE Wireless Communications and Networking Conference, 2008, pp. 1593-97.
[8] R. Almatarneh, M. H. Ahmed, and O. A. Dobre, "'Frequency-time scheduling algorithm for OFDMA systems," in Proc. IEEE Canadian Conference on Electrical and Computer Engineering, 2009, pp. 766-771.
[9] C. Y. Wong, R. S. Cheng, K. B. Letaief, and R. D. Murch, "Multiuser OFDM with adaptive subcarrier, bit, and power allocation," IEEE J. Select. Areas Commun., vol. 17, no. 10, pp. 1747-1758, Oct. 1999.
[10] S. Pietrzyk and G. J. M. Janssen, "Multiuser subcarrier allocation for QoS provision in the OFDMA systems," in Proc. VTC 2002, vol. 2, 2002, pp. 1077-1081.
[11] Y. J. Zhang and K. B. Letaief, "Multiuser adaptive subcarrier-and-bit allocation with adaptive cell selection for OFDM systems," IEEE Transactions on Wireless Communicaitons, 3(4):1566-1575, September 2004.
[12] 3GPP, TS 36.213: "Evolved Universal Terrestrial Radio Access (E-UTRA); Physical layer procedures”. Version 8.8.0 Rel.8, 2009.
[13] Yaxin Cao; Li, V.O.K.; "Scheduling algorithms in broadband wireless networks," Proceedings of the IEEE , vol.89, no.1, pp.76-87, Jan 2001.
[14] Hahne, E.L.; "Round-robin scheduling for max-min fairness in data networks," Selected Areas in Communications, IEEE Journal on vol.9, no.7, pp.1024-1039, Sep 1991.
[15] YuemingCai; Jiang Yu; Youyun Xu; MulinCai, "A comparision of packet scheduling algorithms for OFDMA
0 20 40 60 80 100 120
0 0.1 0.2 0.3 0.4 0.5 0.6 0.7 0.8 0.9 1
Total Throughput/Cell [Mbps]
CDF
Cumulative Distribution Function __SISO__BW=20MHz
RR PF MR
0 20 40 60 80 100 120 140 160 180 200 0
0.1 0.2 0.3 0.4 0.5 0.6 0.7 0.8 0.9 1
Total Throughput/Cell [Mbps]
CDF
Cumulative Distribution Function __MIMO__BW=20MHz
[image:7.595.67.285.292.473.2]systems," Signal Processing and Communication Systems, 2008. ICSPCS 2008. 2nd International Conference on, vol., no., pp.1-5, 15-17 Dec. 2008.
[16] Jalali, A.; Padovani, R.; Pankaj, R.; "Data throughput of CDMA-HDR a high efficiency-high data rate personal communication wireless system," Vehicular Technology Conference Proceedings, 2000. VTC 2000-Spring Tokyo. 2000 IEEE 51st , vol.3, no., pp.1854-1858 vol.3, 2000. [17] 3GPP TR 36.942 V10.2.0 "Evolved Universal Terrestrial
Radio Access (E-UTRA); Radio Frequency (RF) system scenarios".Release 10.
[18] Ericsson, Nokia, Motorola, and Rohde &Schwarz, “R4-070572: Proposal for LTE channel models,” www.3gpp.org, 3GPP TSG RAN WG4, meeting 43, kobe, Japan, May 2007.
[19] 3GPP TS 36.213 V10.1.0, Technical Specification Group Radio Access Network (E-UTRA); Physical layer procedures, (2011-04).