Voltage sags at Induction Motor and Power
System by PSCAD Software
Vibhavari R. Jadhav
PG Student [Power System], Dept. of EE, ZEAL DCOER, Pune, Maharashtra, India.
ABSTRACT: This paper will represent the PSCAD Design of voltage sags at starting of an Induction Motor and other faults which will be occurred in the power system. The sensitive solid state devices and other devices will more impact on the whole system. The power quality issues such as voltage sags, swells, flickering and other issues which are normally introduced in the Induction Motor, Transmission and Distribution system. In this paper, we will analyse the waveforms for the voltage sags at different faults such as line to line, line to ground, double line to ground faults and other faults. The performance of the PSCAD design will be helpful for the detection of various power quality issues which generated at the fault condition or starting of Induction Motor.
KEYWORDS: Faults; voltage sag; power quality; Induction motor; Fourier Transform (FT)
I. INTRODUCTION
Now days, the power quality is an important part of the consumers as well as utilities. If any power issues faced by the utilities or consumers, then there is need to taking care of an advanced appliances at the industries, consumers as well as the utility power station. For this purpose, many of the time the utility provides various operating systems for monitoring condition of the appliances at the consumer side. But the utility cost will be increased and also it changes the business structure of the utility as well as consumers.[10] As in the generation plant, if suddenly disturbances occurred in the system will impacts on the whole plant in the thousands of crores due to such events.
In [11] paper, the author has concentrated on the distribution feeder with single substation of an industry for analysis of voltage sags. In this , the loading effect at the starting of induction motor then voltage will be reduced for the duration 0.2 sec. As per the IEEE 1159-1995 standards, the voltage sag is the reduction in the RMS value of the supplied voltage 0.10 per unit to .90 per unit for epoch about 0.5 cycle to 1 minute.[1] Therefore, the severity of voltage sag events on the power system, their is need to implement the analysis method for it.
This paper describes that the PSCAD software which is more advanced technique for the detection and prediction of voltage sag events with its amplitude and frequency. This PSCAD design will provide the best performance of the system for the different faults. This method will not disturb to the system and provide the prediction of the nature of the events which can be used for the classified by Wavelet Transform.[6]
II.CAUSES OF VOLTAGE SAGS AND ITS IMPACT
The voltage sags will be introduced in the Induction motor at staring and its faulty condition of the motor in larger industry. In case of the power system (Transmission and Distribution system), the Line to Line fault, Double line to ground faults, Double line to Line faults and other faults which commonly occurred. These faults are introduced due to the lightning strokes, climatic conditions such as high wind flows, falling of tree branches on the power lines etc.[10] This abnormal conditions of the power system will cause the voltage sags in the system. This voltage sag events also occurred due to switching of larger machines, starting currents and inrush currents at transformer and other larger inductive loads etc. The voltage sag events will arises at critical condition of the overall system. The amplitude and frequency of the voltage sags will be more as the fault clearing time is more. Due to sudden load initiation on an Induction motor then there will be voltage sags introduced which has larger torque, higher speed but its voltage will be suddenly dropped But, the Motor is connected to the sensitive equipment and other equipments for the system operation, then such voltage sag events will adversely impact on it.[12]
the other feeder line faces the overloading and faulty line will, drops its voltage (i.e. voltage sag events introduced) There are different causes of the voltage sags such as mis-operations of solid state devices, tripping of circuit breakers, faults on the power conductors, unbalance conditions of the system.[2] In rainy season, enormous times of the lightning strokes, tree falling on the power line in the distribution and transmission substation which creates the line to ground faults and other faults. There are other causes of the voltage sags such as collision of animals, vehicles, and building activities.[5] This will influenced on the operation, system performance, production loss, and economical losses of an industry as well as utility.
III. CONVENTIONAL METHODS OF ANALYSIS OF VOLTAGE SAGS
The voltage sags which are produced in the motor and power system, it is observed and analysed by using the conventional methods such as power analyser, digital storage oscilloscope. It has more complexity to the whole system and also it acquires more capital cost. Conventionally, the operator continuously monitors the operation of the system and spends maximum time for the prediction of the events. Sometimes the operator will not able to capture the events easily as well as action will not take at the instant of the fault.
But, the operator has the no. of practices on the voltage sag events i.e. parameters of the system prediction for the fault then it can be overcome easily. So, the utility or any industrial owner will not invest much money for the protection of equipment from the voltage sags. Eventually, these equipment for the analysis voltage are also more costly. So, PSCAD design will be more effective for the analysis of the voltage sags.
IV. SIMULATION AND RESULTS
PSCAD design is very efficient methodology for the analysis of the various signals with good quality of time domain functions. As it can easily design any model of the multiphase system. In this paper, we will analyze the PSCAD design of an Induction Motor at starting and other fault conditions of the power system.
Fig.1. PSCAD Design of Induction Motor with 4-Bus System
Fig.1. shows PSCAD design of an Induction motor with four bus system such as Ea, Eb, Ec, Ed with different locations. As per the paper [4] IEEE 52-bus system can also be designed for the analysis.
Ea= RMS value of Voltage at bus 1, Eb= RMS value of Voltage at bus 2 Ec= RMS value of Voltage at bus 3 Ed= RMS value of Voltage at bus 4.
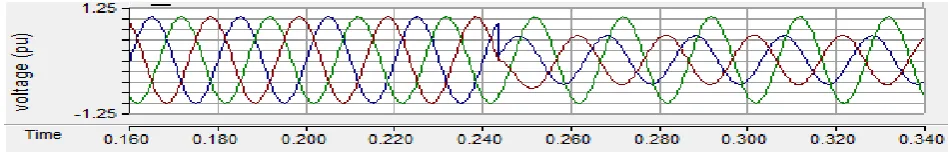
Here, we have considered the larger induction motor which is operated in the bus system. When we designing the induction motor we have considered the Slip- ring Induction Motor with rating about 12.47 kV, 1.9 MVA, 376.99 rad/sec. In an industries, slip ring induction motor is widely used because we can easily connect the load externally as per the requirement. So, in this model we have considered the slip ring induction motor with larger size. Here, PSCAD design will provide the waveforms of the instant when we run the design model of Induction motor. The following fig.3 shows the waveforms generated from the above model. In this waveform, we can seen the voltage
R=0
#1 #2
12 [MVA] 115[kV] / 12.47[kV]
BUS1 TLine2
T #1 #2
1.0 [MVA] 12.47 [kV] / 1.0 [kV]
BUS3
BUS2
#1 #2
1.0 [MVA] 12.47 [kV] / 0.48[kV]
Eb Ea TLine1T P+ jQ Rro
tor +Rrotor +
Rro tor + 0.0 WIN A B Ctrl Ctrl = 1 Tload 1.8 DIST TIN 0 Rrotor External rotor res is tance
sags i.e. 0.10 p.u. to 0.90 p.u. reduction in voltage from 0.2 seconds to 0.3 seconds
Fig.2. Waveforms for the Induction Motor at starting
In this paper, we have also analyzed the voltage sags occurred due to other faults in the induction motor. Due to climatic conditions or environmental factors there is a short circuit between the live conductors on an overhead line will cause the line to line fault. These faults might be because of the human being or living thing. Here, we also designed the PSCAD design for line to line faults. We have created the faults on the bus system and in response to it, we also observes voltage sag waveforms. The following fig.3 and fig.4 gives PSCAD design for the line to line faults and its waveforms. Here, we also consider the 4 bus system with different locations. The fault duration on this model is about 0.1 sec. by Time Fault Logic box.
Fig.3. PSCAD Design for the Line to Line faults
Fig.4. Waveforms of Line to Line faults
R=0
#1 #2
12 [MVA] 115[kV] / 12.47[kV]
BUS1 TLine2
T #1 #2
1.0 [MVA] 12.47 [kV] / 0.48[kV]
BUS3
BUS2
#1 #2
1.0 [MVA] 12.47[kV] / 0.48[kV]
BUS4
P+
jQ
TLine1 T
P+
jQ
CA
Tim ed Fault Logic
Ed
Ec
Ea
Eb
P+
Similarly, we can design the PSCAD design for the different faults which creates the voltage sags events. The voltage sag analysis in the faults such as double line to ground fault is also more important now days because of their severity in the bus system. It also shows the performance and operation of the power system for the variety of the faults. The following fig.5.shows the Double line to ground faults and its waveform. This design model provide the overview of 4 bus system for the detection of voltage sags introduced at bus sytems. The following fig.7 also shows the voltage sag magnitude (which is reduced) and the duration about 0.24 sec. to 0.34 sec. according to the IEEE standard definition of voltage sags.
Fig 5. PSCAD Design for the Double Line to ground Faults.
Fig.6. Waveforms of the Double line to ground Faults
Fig.7. PSCAD design for the Line to ground Faults
Fig.8 Waveforms of the Line to ground faults
Advantages of PSCAD
In this paper, most of the important faults created on the normal bus system and the PSCAD Design will generate the waveforms of the faults with voltage sags. From this, the PSCAD design software is the more efficient for the designing any network and analysis the desired parameters, performance of the system. It provides the time domain information of the above mentioned bus system. As we know, here, PSCAD design used for the analysis of the voltage sags and faults. The main advantage of this software it will also provide the data sheets from that we can easily processed for the analysis signals. The outputs of this PSCAD design can be used for advanced analysis and detection of particular voltage sags. There are different methods such as short time Fourier transform, Discrete Fourier Transform and Wavelet transform for the advanced classification and detection any fault or signals.[7]
V.DETECTION METHODS OF VOLTAGE SAGS
The voltage sags are distinguished by PSCAD design for the analysis. The datasheet from this design which will be used for the detection and analysis of non stationary signals. In early days, the Fourier transform and Short time Fourier Transform used as the detection and analysis methods.[6] But it also has disadvantages such that it is not applicable for the non stationary signals or transients.[8] Also, the Discrete Fourier transform also can be used but it will loose the signal at the time of sampling. From the studies, we have prepared the summary of detection methods for the classification of voltage sags as shown in Table1.
R=0
#1 #2
12 [MVA] 115[kV] / 12.47[kV]
BUS1 TLine2
T #1 #2
1.0 [MVA] 12.47 [kV] / 0.48[kV]
BUS3
BUS2
#1 #2
1.0 [MVA] 12.47[kV] / 0.48[kV]
BUS4
P+
jQ
TLine1 T
P+
jQ
C->G
Tim ed Fault Logic
Ed
Ec
Ea
Eb
P+
T
able 1. Detection methods of voltage sagsSr. No.
Methods for analysis Application Drawbacks
1 Fourier Transform Used for stationary signals Poor results in Time domain 2 Short Time Fourier
Transform
Used for amplitude and location of signals Not efficient for non stationary
3 Discrete Fourier Transform
Efficient for harmonics analysis Can’t detect Sudden change in signals
4 Wavelet Transform Used for analysis of Non stationary signals Complexity
The above mentioned methodology will provides the information of the signals in frequency domain. But the Wavelet Transform [9] which is more efficient method for the detection and analysis of the flickering, swell, voltage sags and other power quality issues.
VI.CONCLUSION
From this paper, the PSCAD design is more suitable for the analysis of the fault occurred in the system and starting of Induction motor. Here, we can was easily design the PSCAD model for the detection of the voltage sags with its amplitude and frequency for desired conditions and parameters. So, we can predict and detect the voltage sags for different faults which impacts on the power system equipments. From this paper, we can conclude that PSCAD design model will be helpful for the analysis of power quality issues compared to the conventional methods.
REFERENCES [1] IEEE Std. 1159-1995, “Recommended Practice for Monitoring Electric Power Quality”
[2] Mladen Kezunovic, Yuan Liao, “A new method for classification and characterization of voltage sags” IEEE Transactions, March, 2001 [3] Djokic, S.Z.; Stockman, K.; Milanovic, J.V.; Desmet, J.J.M.; Belmans, R., "Sensitivity of AC adjustable speed drives to voltage sags and short
interruptions" Power Delivery, IEEE Transactions on vol.20, no.1, pp.494,505, Jan. 2005
[4] Lipin Chen; Xianyong Xiao, "Voltage sags frequency assessment considering the coordination of protection system," Harmonics and Quality of Power (ICHQP), 2012 IEEE 15th International Conference on vol., no., pp.932,935, 17-20 June 2012
[5] Po-Tai Cheng; Chian-Chung Huang; Chun-Chiang Pan; Bhattacharya, S., "Design and implementation of a series voltage sag compensator under practical utility conditions," Industry Applications, IEEE Transactions on vol.39, no.3, pp.844,853, May-June 2003
[6] Moin Siddiqui, K.; Giri, V.K., "Broken rotor bar fault detection in induction motors using Wavelet Transform," Computing, Electronics and Electrical Technologies (ICCEET), 2012 , pp.1,6, 21-22 March 2012
[7] Ahmed, R.; El Sayed, M.; Gadsden, S.A.; Jimi Tjong; Habibi, S., "Automotive Internal-Combustion-Engine Fault Detection and Classification Using Artificial Neural Network Techniques," Vehicular Technology, IEEE Transactions on vol.64, no.1, pp.21,33, Jan. 2015
[8] S.A. Deokar ,L.M. Waghmare “Integrated DWT–FFT approach for detection and classification of power quality disturbances”, Electrical Power and Energy System, May, 2014
[9] Julio Barros , Ramón I. Diego, Matilde de Apráiz “Applications of wavelets in electric power quality: Voltage events” Electrical Power and Energy System, 6th March 2012.
[10] Dugan RC, Mc Granaghan MF, Santoso S, Beaty HW. “Electrical power systems quality”. 2nd ed. New York (USA): The McGraw-Hill; 2004.
[11] Kang Chia Yang, Hushairi HJ Zen, “Simulating Voltage Sag Using PSCAD Software” International Journal of Electrical, Robotics, Electronics and Communications Engineering Vol:7 No:10, 2013
[12] Ding Ning Suo Juan Wang Jianwei Voltage Sag Disturbance Detection Based on RMS Voltage Method IEEE Transaction, 2009
BIOGRAPHY