Automatic Text Categorization by Unsupervised Learning
Youngjoong Ko
Department of Computer Science, Sogang University 1 Sinsu-dong, Mapo-gu
Seoul, 121-742, Korea [email protected],
Jungyun Seo
Department of Computer Science, Sogang University
1 Sinsu-dong, Mapo-gu Seoul, 121-742, Korea [email protected]
Abstract
The goal of text categorization is to classify documents into a certain number of pre-defined categories. The previous works in this area have used a large number of labeled training documents for supervised learning. One problem is that it is difficult to create the labeled training documents. While it is easy to collect the unlabeled documents, it is not so easy to manually categorize them for creating training documents. In this paper, we propose an unsupervised learning method to overcome these difficulties. The proposed method divides the documents into sentences, and categorizes each sentence using keyword lists of each category and sentence similarity measure. And then, it uses the categorized sentences for training. The proposed method shows a similar degree of performance, compared with the traditional supervised learning methods. Therefore, this method can be used in areas where low-cost text categorization is needed. It also can be used for creating training documents.
Introduction
With the rapid growth of the internet, the availability of on-line text information has been considerably increased. As a result, text categorization has become one of the key techniques for handling and organizing text data. Automatic text categorization in the previous works is a supervised learning task, defined as assigning category labels (pre-defined) to text documents based on the likelihood suggested by a training set of labeled documents. However, the previous learning algorithms have some
problems. One of them is that they require a large, often prohibitive, number of labeled training documents for the accurate learning. Since the application area of automatic text categorization has diversified from newswire articles and web pages to electronic mails and newsgroup postings, it is a difficult task to create training data for each application area (Nigam K. et al., 1998).
In this paper, we propose a new automatic text categorization method based on unsupervised learning. Without creating training documents by hand, it automatically creates training sentence sets using keyword lists of each category. And then, it uses them for training and classifies text documents. The proposed method can provide basic data for creating training documents from collected documents, and can be used in an application area to classify text documents in low cost. We use the χ2
statistic (Yang Y. et al., 1998) as a feature selection method and the naive Bayes classifier (McCallum A. et al., 1998) as a statistical text classifier. The naive Bayes classifier is one of the statistical text classifiers that use word frequencies as features. Other examples include k-nearest-neighbor (Yang Y. et al., 1994), TFIDF/Roccio (Lewis D.D. et al., 1996), support vector machines (Joachims T. et al., 1998) and decision tree (Lewis D.D. et al., 1994).
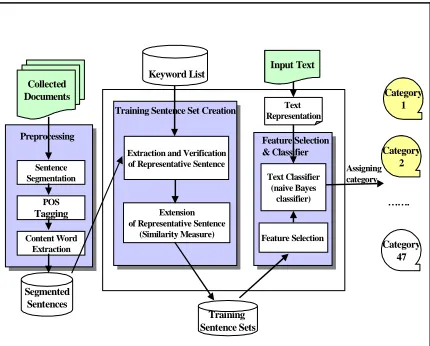
Figure1: Architecture for the proposed system
1.1
PreprocessingFirst, the html tags and special characters in the collected documents are removed. And then, the contents of the documents are segmented into sentences. We extract content words for each sentence using only nouns. In Korean, there are active-predicative common nouns which become verbs when they are combined with verb-derivational suffixes (e.g., ha-ta ‘do’, toy-ta ‘become’, etc.). There are also stative-predicative common nouns which become adjectives when they are combined with adjective-derivational suffixes such as ha. These derived verbs and adjectives are productive in Korean, and they are classified as nouns according to the Korean POS tagger. Other verbs and adjectives are not informative in many cases.
1.2
Creating t
raining sentence setsBecause the proposed system does not have training documents, training sentence sets for each category corresponding to the training documents have to be created. We define keywords for each category by hand, which contain special features of each category sufficiently. To choose these keywords, we first regard category names and their synonyms as keywords. And we include several words that have a definite meaning of each category. The average number of keywords for each category is 3. (Total 141 keywords for 47 categories) Table 1 lists the examples of keywords for each category.
Table 1: Examples of keywords for each category
Category Keywords
ye-hayng (trip), kwan-kwang (sightseeing)
ye-hayng (trip), kwan-kwang (sightseeing)
Um-ak(music) Um-ak (music)
Cong-kyo (religion)
Cong-kyo (religion), chen-cwu-kyo(Catholicism)
ki-tok-kyo(Christianity), pwul-kyo(Buddhism) Pang-song
(broadcasting)
Pang-song (broadcasting), TV, thal-ley-pi-cyen(television), la-ti-o(radio)
Next, the sentences which contain pre-defined keywords of each category in their content words are chosen as the initial representative sentences. The remaining sentences are called unclassified sentences. We scale up the representative sentence sets by assigning the unclassified sentences to their related category. This assignment has been done through measuring similarities of the unclassified sentences to the representative sentences. We will elaborate this process in the next two subsections.
1.2.1 Extracting and verifying representative sentences
We define the representative sentence as what contains pre-defined keywords of the category in its content words. But there exist error sentences in the representative sentences. They do not have special features of a category even though they contain the keywords of the category. To remove such error sentences, we can rank the representative sentences by computing the weight of each sentence as follows:
1) Word weights are computed using Term Frequency (TF) and Inverse Category Frequency (ICF) (Cho K. et al., 1997).
: The within-category word frequency(TFij),
(1) category th
in the
occurs words
times of number the
j
t ij
TF = i
; In Information Retrival, Inverse Document Frequency (IDF) are used generally. But a sentence is a processing unit in the proposed method. Therefore, the document frequency cannot be counted. Also, since ICF was defined by Cho K. et al. (1997)
Collected Documents
Preprocessing
Sentence Segmentation
Content Word Extraction
POS
Tagging
Keyword List
Extraction and Verification of Representative Sentence
Extension of Representative Sentence
(Similarity Measure)
Training Sentence Sets
Input Text
Segmented Sentences
Text Representation
Category 1
Category 2
Category 47 …….
Assigning category Text Classifier
(naive Bayes classifier)
Feature Selection
Training Sentence Set Creation
and its efficiency was verified, we use it in the proposed method. ICF is computed as follows:
(2) ) log( ) log(
ICFi = M − CFi
where CFi is the number of categories that contain ti, and M is the total number of categories.
< The combination (TFICF) of the above ①
and ②, i.e., weight wij of word ti in jth category is computed as follows:
(3) ) ) log( ) log( (
i CF M
ij TF
i ICF ij TF ij w
− ×
= × =
2) Using word weights (wij) computed in 1), a sentence weight (Wij) in jth category are computed as follows:
1 2 ... (4)
N w w
w
Wij = j+ j+ + Nj
where N is the total number of words in a sentence.
3) The representative sentences of each category are sorted in the decreasing order of weight, which was computed in 2). And then, the top 70% of the representative sentences are selected and used in our experiment. It is decided empirically.
1.2.2 Extending representative sentence sets
To extend the representative sentence sets, the unclassified sentences are classified into their related category through measuring similarities of the unclassified sentences to the representative sentences.
(1)Measurement of word and sentence
similarities
As similar words tend to appear in similar contexts, we compute the similarity by using contextual information (Kim H. et al., 1999; Karov Y. et al., 1999). In this paper, words and sentences play complementary roles. That is, a sentence is represented by the set of words it contains, and a word by the set of sentences in which it appears. Sentences are similar to the extent that they contain similar words, and words are similar to the extent that they appear in similar sentences. This definition is circular.
Thus, it is applied iteratively using two matrices as shown in Figure 2. In this paper, we set the number of iterations as 3, as is recommended by Karov Y. et al. (1999).
y u
o JyuoK
u u o JuuoK
Figure 2: Iterative computation of word and sentence similarities
In Figure 2, each category has a word similarity matrix WSMn and a sentence similarity
matrix SSMn. In each iteration n, we update
WSMn, whose rows and columns are labeled by
all content words encountered in the representative sentences of each category and input unclassified sentences. In that matrix, the cell (i,j) holds a value between 0 and 1, indicating the extent to which the ith word is contextually similar to the jth word. Also, we keep and update a SSMn, which holds similarities
among sentences. The rows of SSMn correspond
to the unclassified sentences and the columns to the representative sentences. In this paper, the number of input sentences of row and column in SSM is limited to 200, considering execution time and memory allocation.
To compute the similarities, we initialize WSMn to the identity matrix. That is, each word
is fully similar (1) to itself and completely dissimilar (0) to other words. The following steps are iterated until the changes in the similarity values are small enough.
1. Update the sentence similarity matrix SSMn,
using the word similarity matrix WSMn.
2. Update the word similarity matrix WSMn,
using the sentence similarity matrix SSMn.
(2)Affinity formulae
is a real number between 0 and 1. It reflects the contextual relationships between W and the words of the sentence. If W belongs to a sentence S, its affinity to S is 1. If W is totally unrelated to S, the affinity is close to 0. If W is contextually similar to the words of S, its affinity to S is between 0 and 1. In a similar manner, a sentence S has some affinity to every word, reflecting the similarity of S to the sentences involving that word.
Affinity formulae are defined as follows (Karov Y. et al., 1999). In these formulae, W ∈ S means that a word belongs to a sentence:
(6)
In the above formulae, n denotes the iteration number, and the similarity values are defined by WSMn and SSMn. Every word has some affinity
to the sentence, and the sentence can be represented by a vector indicating the affinity of each word to it.
(3)Similarity formulae
The similarity of W1 to W2 is the average affinity
of the sentences that include W1 to W2, and the
similarity of a sentence S1 to S2 is a weighted
average of the affinity of the words in S1 to S2.
Similarity formulae are defined as follows (Karov Y. et al., 1999):
The weights in Formula 7 are computed following the methodology in the next section. The sum of weights in Formula 8, which is a reciprocal number of sentences that contain W1, is 1. These values are used to update the corresponding entries of WSMn and SSMn.
(4) Word weights
In Formula 7, the weight of a word is a product of three factors. It excludes the words that are expected to be given unreliable similarity values.
The weights are not changed in their process of iterations.
1.Global frequency: Frequent words in total sentences are less informative of sense and of sentence similarity. For example, a word like ‘phil-yo(necessity)’ frequently appears in any sentence. The formula is as follows (Karov Y. et al., 1999):
highest frequencies in total sentences.
2.Log-likelihood factor: In general, the words that are indicative of the sense appear in representative sentences more frequently than in total sentences. The log-likelihood factor captures this tendency. It is computed as follows (Karov Y. et al., 1999):
(10)
frequency of Wi in the total sentences, and
Pr(Wi|W) from the frequency of Wi in
representative sentences. To avoid poor estimation for words with a low count in representative sentences, we multiply the log-likelihood by (11) where count(Wi) is the
number of occurrences of Wi in representative
sentences. For the words which do not appear in representative sentences, we assign weight (1.0) to them. And the other words are assigned weight that adds 1.0 to computed value:
The total weight of a word is the product of the above factors, each normalized by the sum of factors of the words in a sentence as follows (Karov Y. et al., 1999):
In (12), factor(Wi, S) is the weight before normalization.
(5) Assigning unclassified sentences to a category
We first computed similarities of the unclassified sentences to the representative sentences. And then, we decided a similarity value of each unclassified sentence for each category using two alternate ways.
In (13) and (14), i) X is an unclassified sentence, ii) is a category set, and iii) is a representative sentence set of category ci.
Each unclassified sentence is assigned to a category which has a maximum similarity value. But there exist unclassified sentences which do not belong to any category. To remove these unclassified sentences, we set up a threshold value using normal distribution of similarity values as follows:
standard deviation of similarity values, and iv) θ is a numerical value corresponding to threshold(%) in normal distribution table.
1.3
Feature selection and text classifier1.3.1 Feature Selection
The size of the vocabulary used in our experiment is selected by ranking words
according to their χ2
statistic with respect to the category. Using the two-way contingency table of a word t and a category c − i) A is the number of times t and c co-occur, ii) B is the number of times t occurs without c, iii) C is the number of times c occurs without t, iv) D is the number of times neither c nor t occurs, and vi) N is the total number of sentences − the word-goodness measure is defined as follows (Yang Y. et al., 1997): global feature selection, we combine the category-specific scores of a word as follows:
() max{ 2(, )} (17)
1.3.2 Text classifier
The method that we use for classifying documents is naive Bayes, with minor modifications based on Kullback-Leibler Divergence (Craven M. et al., 1999). The basic idea in naive Bayes approaches is to use the joint probabilities of words and categories to estimate the probabilities of categories given a document. Given a document d for classification, we calculate the probabilities of each category c as follows:
In the above formula, i) n is the number of words in d, ii) N(ti|d) is the frequency of word ti in document d, iii) T is the size of the vocabulary, and iv) ti is the ith word in the vocabulary. Pr(ti|c) thus represents the probability that a randomly drawn word from a randomly drawn document in category c will be the word ti. Pr(ti|d) represents the proportion of words in document d that are word ti. Each probability is estimated by formulae (19) and (20), which are called the expected likelihood
{
c c cm}
C= 1, 2,...,
{
n}
c S S S
estimator (Li H. et al., 1997). The category predicted by the method for a given document is simply the category with the greatest score. This method performs exactly the same classifications as naive Bayes does, but produces classification scores that are less extreme.
(20)
0
5 . 0 ) , (
5 . 0
Pr
(19)
5 . 0 ) , (
5 . 0 ) , ( )
| Pr(
0 if
0 if
1 1
× + +
=
× + + =
= ≠
∑
∑
= =
,d) i N(t
,d) i N(t
d c
T
j
d j
i
i T
j
c j
i i
T d
t N
,d) N(t |d)
(t
T c
t N
c t N c
t
2
Evaluation of experiment2.1
Performance measuresIn this paper, a document is assigned to only one category. We use the standard definition of recall, precision, and F1 measure as performance
measures. For evaluating performance average across categories, we use the micro-averaging method. F1 measure is defined by the following
formula (Yang Y. et al., 1997):
1( , ) 2 (21)
p r
rp p r F
+ =
where r represents recall and p precision. It balances recall and precision in a way that gives them equal weight.
2.2
Experiment settingsWe used total 47 categories in our experiment. They consist of 2,286 documents to be collected in web. We did not use tag information of web documents. And a so-called bag of words or unigram representation was used. Table 2 shows the settings of experiment data in detail.
Table 2: Setting experiment data
# of doc.
# of sen.
avg # of doc. in a cat.
avg # of sen. in a doc. Training
Set
1,383
(60%) 67,506 29.4 48.8
Test Set 903
(40%) 56,446 19.2 62.5
2.3
Primary results2.3.1 Results of the different combinations of similarity value decisions and thresholds
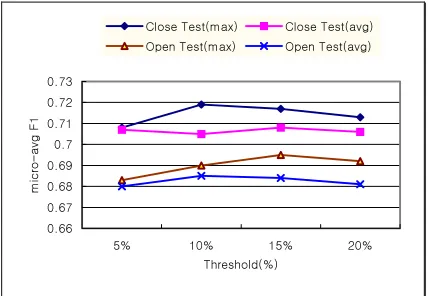
We evaluated our method according to the different combinations of similarity value decisions and thresholds in section 1.2.2. We used thresholds of top 5%, top 10%, top 15%, top20% in formula (15), and tested the two options, average and maximum in formulae (13) and (14). We limited our vocabulary to 2,000 words in this experiment.
[Yaa [Yab [Yac [Yad [Yb [Yb\ [Yb] [Yb^
`P \[P \`P ][P
SPT
X¡
q\
n S£T n S¡T z S£T z S¡T
Figure 3: Results of the different combinations of similarity value decisions and thresholds
Figure 3 shows results according to the two options in each threshold. Here, the result using maximum was better than that using average with regrad to all thresholds. The results of top 10% and top 15% were best. Therefore, we used the maximum in the decision of similarity value and top 15% in threshold in our experiments.
2.3.2 The proposed system vs. the system by supervised learning
RPW RPWTW RPWW RPWYW RPX RPXTW RPXW RPXYW RPY RPYTW RPYW RPYYW RPZ
URR WRR YRR SRRR SWRR TRRR URRR VRRR WRRR XRRR YRRR ZRRR [RRR SRRRR
x u
X¡
q\
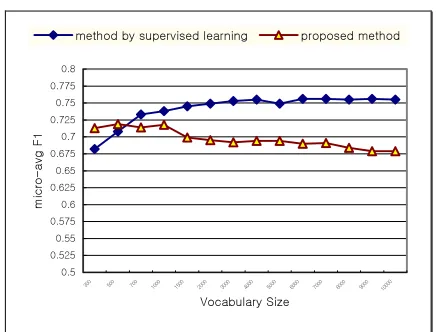
Figure 4: Comparison of the proposed system and the system by supervised learning
Figure 4 displays the performance curves for the proposed system and the system by supervised learning. The best F1 score of the proposed
system is 71.8% and that of the system by supervised learning is 75.6%. Therefore, the difference between them is only 3.8%.
Conclusion
This paper has described a new automatic text categorization method. This method automatically created training sets using keyword lists of each category and used them for training. And then, it classified text documents. This could be a significant method in text learning because of the high cost of hand-labeling training documents and the availability of huge volumes of unlabeled documents. The experiment results showed that with respect to performance, the difference between the proposed method and the method by supervised learning is insignificant. Therefore, this method can be used in areas where low-cost text categorization is required, and can be used for creating training data.
This study awaits further research. First, a more scientific approach for defining keyword lists should be investigated. Next, if we use a word sense disambiguation system in the extraction step of representative sentences, we would be able to achieve a better performance.
Acknowledgments
This work was supported by KOSEF under Grant No. 97-0102-03-01-3. We wish to thank Jeoung-seok Kim for his valuable comments to the earlier version of this paper.
References
Cho K. and Kim J. (1997) Automatic Text Categorization on Hierarchical Category Structure by using ICF(Inverted Category Frequency) Weighting. In Proceedings of KISS conference, pp.507-510.
Craven M., DiPasquo D., Freitag D., McCallum A., Mitchell T., Nigam K. and Slattery S. (1999) Learning to Construct Knowledge Bases from the World Wide Web. to appear in Artificial
Intelligence.
Joachims T. (1998) Text Categorization with Support Vector Machines: Learning with Many Relevant Features. In European Conference on Machine
Learning(ECML).
Karov Y. and Edelman S. (1998) Similarity-based Word Sense Disambiguation. Computational
Linguistics, Vol 24, No 1, pp. 41-60.
Kim H., KoY., Park S. and Seo J. (1999) Informal Requirements Analysis Supporting System for Human Engineer. In Proceedings of Conference on
IEEE-SMC99.Vol 3, pp.1013-1018.
Lewis D.D. and Ringuette M. (1994) A comparison of Two Learning Algorithms for Text categorization.
In Proceeding of the 3rd
Annual Symposium on Document Analysis and Information Retrieval.
Lewis D.D., Schapire R.E., Callan J.P. and Papka R.(1996) Training Algorithms for Linear Text
Classifiers. In Proceedings of the 19th
International Conference on Research and Development in Information Retrieval (SIGIR’96), pp. 289-297.
Li H. and Yamanishi K. (1997) Document Classification Using a Finite Mixture Model. The
Association for Computational Linguistics, ACL ’97.
McCallum A. and Nigram K. (1998) A comparison of Event Models for Naive Bayes Text
Classification. AAAI ’98 workshop on Learning for
Text Categorization.
Nigam K., McCallum A., Thrun S. and Mitchell T. (1998) Learning to Classify Text from Labeled and
Unlabeled Documents. In Proceedings of 15th
National Conference on Artificial Intelligence (AAAI-98).
Yang Y. (1999) An evaluation of statistical approaches to text categorization. Information
Retrieval Journal, May.
Yang Y. (1994) Expert netword: Effective and efficient learning from human decisions in text
categorizatin and retrieval. In 17th
Annual International ACM SIGIR Conference on Research and Development in Information Retrieval (SIGIR’94), pp. 13-22.
Yang Y. and Pederson J.O. (1997) A comparative study on feature selection in text categorization. In