Top-K Subgraph Matching Query in A Large Graph
Lei Zou
1 ∗Lei Chen
2Yansheng Lu
11
Huazhong Univ.of Sci.
&
Tech., Wuhan, China,
{
zoulei,lys
}
@mail.hust.edu.cn
2Hong Kong Univ.of Sci.
&
Tech., Hong Kong, China, [email protected]
Abstract
Recently, due to its wide applications, subgraph search has at-tracted a lot of attention from database and data mining commu-nity. Sub-graph search is defined as follows: given a query graph
Q, we report all data graphs containingQin the database.
How-ever, there is little work about sub-graph search in a single large graph, which has been used in many applications, such as biolog-ical network and social network.
In this paper, we address top-k sub-graph matching query
prob-lem, which is defined as follows: given a query graphQ, we
lo-cate top-k matchings ofQin a large data graphGaccording to
a score function. The score function is defined as the sum of the
pairwise similarity between a vertex inQand its matching vertex
inG. Specifically, we first design a balanced tree (that is G-Tree)
to index the large data graph. Then, based on G-Tree, we propose
an efficient query algorithm (that isRankedMatching algorithm).
Our extensive experiment results show that, due to efficiency of pruning strategy, given a query with up to 20 vertices, we can locate the top-100 matchings in less than 10 seconds in a large data graph with 100K vertices. Furthermore, our approach out-performs the alternative method by orders of magnitude.
1.
Introduction
Graph is an important data structure in computer science, which can model objects asverticesand their pairwise relationships as
edges. Graph database finds many applications in chem-informatics
[22], or pattern recognition [4] and complex network [24]. Basi-cally, graph databases can be divided into two categories [13]:
First, graph-transaction setting. There is a large set of rel-atively small graphs (<300 vertices)(calledtransactions) in the database, such as compound structures and graph patterns. Re-cently, a lot of important work about sub-graph search has been conducted in the graph-transaction database [19, 23, 11, 25, 9, 6,
∗
The work was done when the first author visited Hong Kong Uni-versity of Science and Technology as a visiting scholar.
Permission to make digital or hard copies of all or part of this work for personal or classroom use is granted without fee provided that copies are not made or distributed for profit or commercial advantage and that copies bear this notice and the full citation on the first page. To copy otherwise, to republish, to post on servers or to redistribute to lists, requires prior specific permission and/or a fee.
Copyright 200X ACM X-XXXXX-XX-X/XX/XX ...$5.00.
3].
Second,single-graph setting. Different from the first category, there is only one graph in the database, however, the size of graph is very large (>10K vertices), such as biological network [14], social network [21] and WWW [1]. There are many interesting problems in this category, such as community detection [2] and frequent sub-graph mining [13] and connectivity [20].
Among of these graph-based problems, (sub)graph matching [8] is one of fundamental problems with many practical applica-tions, such as compound search [10] [22], pattern recognition [4]. On the other hand, as we know, sub-graph isomorphism is NP-complete [8]. In fact, it is exact the intrinsical hardness and popu-lar applications that motivate people to design practical algorithms for graph matching problems, such as [19, 23, 11, 25, 9, 6, 3]
1.1
Motivation
In this paper, we propose a novel sub-graph matching query in single-graph database, calledTop-K Subgraph Matching Query. Given a query graphQ, we report the top-k matching positions in the large graphGwith the k largest “scores”. Before the formal definition in Section 1.2, let us consider some motivating examples as follows.
Recently, in life science, due to rapid advances in experimental designs, biologists can obtain a large amount of data describing biological interactions at a genome scale. We can model these interaction networks as large graphs, such as proteprotein in-teraction networks (PPI) [17], metabolic networks [14] and so on. Vertices and edges are used to represent biological entities and interactions between them. As a motivation example for our prob-lem, let us consider the following scenario: A scientist working on an unwell-studied species has constructed a small portion of a pro-tein pathway complexQbased on analysis of various experimental data. The scientist is interested in predicting more biological ac-tivity about the unwell-studied species. This task can be expressed as locating some “similar” matchings ofQin a large PPI network Gabout a well-studied species. For each matching, we can com-pute its scores. We only report top-k matchings. The score of a matching is defined as the sum of the pairwise similarity between a vertex (this is a protein) inQand its matching vertex inG. We can evaluate the similarity between two vertices in terms of the protein sequence similarity [18]. Most existing approaches always assume that the query pathway complex is a path or tree, or relax matching definitions (not sub-graph isomorphism, only consider-ing pairwise vertex distances)[24]. Furthermore, it is difficult for these methods to work on a very large data graph.
Actually, top-k sub-graph matching query problem has many other applications, such as social network. Assume that an official
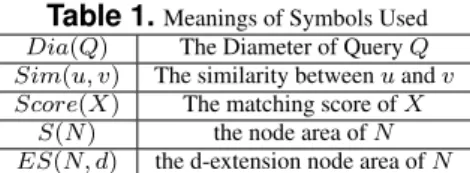
Table 1.Meanings of Symbols Used
Dia(Q) The Diameter of QueryQ Sim(u, v) The similarity betweenuandv Score(X) The matching score ofX
S(N) the node area ofN ES(N, d) the d-extension node area ofN
security department has built a large social network. Each ver-tex corresponds to a dangerous individual, and each edge denotes the interaction between two corresponding individuals, as shown in Figure 1. Some personal characters about a danger individual are recorded, such as appearance, accent and so on. In order to find a terrorist group, through a long time detection, polices have obtained some personal characters about 4 terrorists (such as ap-pearance and so on), and the interactions among them. Then, they draw a query graphQin Figure 1. Qis not always a complete graph, since the interactions among members in the terrorist group are always well pre-defined. Some members have no interaction with others, even though they are in the same terrorist group. In Figure 1, the vertex color is used to denote the personal character. Similarity between personal characters is denoted by the similar-ity between the vertex colors. In order to locate the terrorist group in the network, we want to find 4 matching vertices (individuals) inG, which are similar with vertices inQrespectively. Further-more, the interaction among them are the same with that inQ. Though vertex 1 in Figure 1 is similar with one query vertex, it is eliminated due to no interactions with other suspects. The ver-tices(5,9,12,14)is a matching ofQinG. There may exist many matchings ofQin the network. Polices should pay more attention to top-k “good” matchings.
Figure 1. Terrorist Network
1.2
Problem Definition
First, we briefly review the terminologies that we will use in this paper. Table 1 lists commonly used symbols in this paper.
DEFINITION 1.1. Graph. A graph G is defined as G = (V, E), where V is the set of vertices, and E is a set of vertex pairs.
In this paper, we use graphs to model a large network, such as protein-protein interaction network (PPI), social network and WWW. Notice that, different from graph-transaction databases, vertices have no category labels. They correspond to different ob-jects. For example, in PPI, each vertex corresponds to a protein and the edge corresponds to the interaction between two proteins. In social network, we always use a vertex to denote an individual and an edge to denote the interaction between each other.
DEFINITION 1.2. Graph Isomorphism. Assume that we have
two graphs Q < V1, E1 >and G < V2, E2 >. GraphQ is
isomorphism to graphG, iff1 there exists at least one bijective
1iff: if and only if
functionf:V1→V2such that for any edgeuv∈E1, there is an
edgef(u)f(v)∈E2.
DEFINITION 1.3. Sub-Graph Isomorphism. Assume that we
have two graphsQ < V1, E1 >andG < V2,E2 >. If there
exists at least one sub-graphX in graphG, graphQis
isomor-phism toXunder the bijective functionf, graphQis sub-graph
isomorphism to graphG.
As mentioned above, a vertex in a graph corresponds to an ob-ject. For a vertexuin queryQand a vertexvin data graphG, we useSim(u, v)to evaluate the similarity between two objects associated with verticesuandv. Sim(u, v)depends on differ-ent applications. In the PPI example of Section 1.1,Sim(u, v)is defined as the similarity between two corresponding proteins. In terrorist network example,Sim(u, v)is defined as the similarity between two corresponding individual characters.
How to evaluateSim(u, v)is not focus of this paper, which depends on different applications. In our problem,Sim(u, v)for any pair(u, v)is also the input of the algorithm, whereuandv are two vertices in queryQand data graphGrespectively. Given a vertexuin queryQ, a vertexvin the graphGcan be a matching vertex touiffSim(u, v)≥γ, whereγis user specified parameter. Therefore, we have the following definition.
DEFINITION 1.4. Sub-Graph Matching. Assume that we have
two graphsQ < V1,E1>andG < V2,E2>.Qis isomorphism
to X under some bijective functionf, whereX is a sub-graph
ofG. We callX asub-graph matching(matching for short) of
Qin graphG, iff, for any vertexuinQ, Sim(u, f(u)) ≥ γ.
Furthermore, the vertexf(u)inGis called thematching vertex
w.r.t2vertexuin queryQ.
It is clear that, given a query graphQ, there may exist many match-ings ofQin the large data graph. For each matchingX, we define the matching scoreScore(X)as follows:
DEFINITION 1.5. Matching Score. Given a query graphQ
and a large data graphG,Xis amatchingof Qin graphG. The
score of Xis defined as
Score(X) =P|V(Q)|
i=1 Sim(vi, f(vi)) (1)
, where|V(Q)|is the number of vertices inQ.
We would like to point out that matching score function also depends on different applications. In fact, our algorithm proposed in this paper holds for any monotone aggregatematching score function. For the clear presentation, we use sum function asScore(X)
in this paper. Ourtop-k subgraph matchingquery is defined as fol-lows:
DEFINITION 1.6. (Problem Definition)Top-K Subgraph
Match-ing Query(top-k matching for short). Given a query graphQ, a
large data graphGandSim(u, v)for any vertex pair(u, v)(u
andvare two vertices inQandGrespectively), we want to locate
kmatchingsXiinG, i=1...k, whose matching scores are the first
klargest.
Furthermore, in our problem,|V(Q)|< log|V(G)|, namely, query Qis a small graph compared with the data graphG.
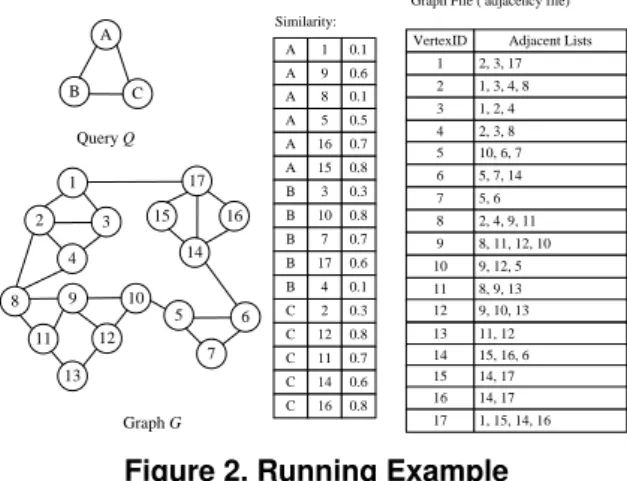
Example 1(Running Example). Given a query graphQand a large data graphGin Figure 2, we want to locate Top-2 match-ings. The vertex similarity threshold isγ= 0.1. In Figure 2, we only report all vertex pairs whose similarities are no less thanγ.
A B C Query Q A 1 0.1 Similarity: 1 2 3 4 17 15 16 14 13 8 9 10 12 11 5 6 7 Graph G A 9 0.6 A 5 0.5 A 16 0.7 A 15 0.8 B 3 0.3 B 10 0.8 B 7 0.7 B 17 0.6 C 2 0.3 C 12 0.8 C 11 0.7 C 14 0.6 B 4 0.1 A 8 0.1
VertexID Adjacent Lists 1 2, 3, 17 2 1, 3, 4, 8 3 1, 2, 4 4 2, 3, 8 5 10, 6, 7 6 5, 7, 14 7 5, 6 8 2, 4, 9, 11 9 8, 11, 12, 10 10 9, 12, 5 11 8, 9, 13 12 9, 10, 13 13 11, 12 14 15, 16, 6 15 14, 17 16 14, 17 17 1, 15, 14, 16 Graph File ( adjacency file)
C 16 0.8
Figure 2. Running Example
Notice that, each vertex in queryQand data graphG corre-sponds to one object. ‘A’ and ‘1’ in Figure 2 are vertex ID, not vertex labels.
1.3
Our Approaches
In this problem, we have to face sub-graph isomorphism during query processing, known to be NP-complete. Obviously, for any matchingXofQin the data graphG,Xis located into a local area with diameter≤Dia(Q)inG, whereDia(Q)is the diameter of queryQ. We can check the local area around each vertex inGby sub-graph isomorphism until we find all matchings ofQinG. In order to reduce the number of sub-graph isomorphism checking, we can apply feature-based pruning strategy. If a feature (that is
sub-structure) of a queryQdoes not exist in some local area ofG,
the local area cannot contain any matching of Q, namely, the
lo-cal area can be pruned safely.Feature-based pruning is a popular
method in sub-graph search problem [19, 23, 25, 3]. However, in our problem, given a queryQ, the matchings ofQexist in most local areas of the data graphG, especially when|Q|is small. It means that we can prune few local areas inG. The underlying rea-son is that all vertices in our problem are non-labeled. Therefore, feature-based pruning cannot work well in the problem.
In this paper, we adopt another kind of pruning strategy, that
isscore-upper boundpruning:for a local area in the data graph
G, if there exist no matching whose score can be in top-k
match-ing scores, the local area can be filtered out safely. The efficiency
of score-upper bound pruning is derived from clusters in the large graph. In many graph clusters, matching scores are small. Since, in these clusters, there exit few vertices having similar characters to that in queryQ. In summary, we made the following contribu-tions in this paper:
1. We propose a novel sub-graph search problem in a single large graph, which locates and reports top-k matchings. 2. We design a height-balanced tree,G-Tree, to index a large
graph.
3. Based on G-Tree index, to answertop-k matchingquery, we proposeRankedMatchingalgorithm.
4. Extensive experiments on two real data sets evaluate the ef-ficiency of our methods.
The remainder of the paper is organized as follows: Related work is discussed in Section 2. We design G-tree index and pro-pose novelRanked Matchingalgorithms in Section 3. We evaluate
our method in the extensive experiments in Section 4. Finally, We conclude the paper in Section 5.
2.
Related Work
Recently, there is increasing research interest in graph databases. Here, we make a brief review of the related work, which can be categorized into three groups: 1) sub-graph search in graph-transaction database; 2) pathway search in the biological network; 3) graph cluster and community detection.
Sub-graph search in graph-transaction database.Given a query graphQ, we need to report all data graphs containingQin the database [19, 23, 11, 25, 9, 6, 3]. The popular pruning strategy in sub-graph search problem is feature-based pruning: If a feature (that is sub-structure) of queryQdoes not exits in some data graph Gi,Gican be filtered out safely. The straightforward method of extending the strategy to our problem is that, if a local area of the large graphGdoes not consist a feature of query, the local area can be pruned. However, it has no good pruning power. The underly-ing reason is that all vertices in our problem has no categorical labels.
Pathway search in the biological network. Given a pathway complex Q, we want to find a sub-structure X in the biologi-cal network that is most similar toQ. In the recent work [24], authors propose GraphM atchalgorithm. The matching defi-nition in [24] replaces sub-graph isomorphism by pair-wise ver-tex distance, which is different from ours. In experiments, we chooseGraphM atchas an alternative method for comparison. GraphM atchcan work well in biological network (about 5K ver-tices), but it can not work on a very large graph (100K vertices).
Graph cluster and community detectionThe goal of community detection is to cluster the vertices in the large graph into groups that share common characteristics. Many graph partition and clus-tering algorithms have been proposed in the literature, such as spectral clustering [15], METIS [12] and so on. In fact, the prun-ing effect of our method benefits from “community” and “graph clusters”, which is discussed in Section 3.2.
3.
Ranked Matching Algorithm
In this section, we design G-Tree to index a large data graph in Section 3.1. Then, based on G-Tree, we proposeRMalgorithm for top-k matching query problem in Section 3.2. Advanced RM
algorithm is proposed in Section 3.3.
3.1
G-Tree Structure
Many real large graphs alway display thehierarchical topol-ogy[16], such as PPI, social network and WWW. In these large graphs, there exist many clusters. The vertices in a cluster are highly connected, and they have only a few or no neighbors out-side this cluster. In PPI, these clusters always correspond to dif-ferent functional groups. In friendship network, they denote the communities with shared interests. Iteratively, small clusters are also densely interconnected, which form larger clusters. Inspired by thehierarchical topologyin the real large graphs, we propose a G-Tree index as follows.
DEFINITION 3.1. G-Tree. Given a large data graphG, G-Tree index is a height balanced tree, where:
1. Each nodeNin G-Tree corresponds to a set of vertices in
graph G. The set of vertices is calledNode Areaw.r.t node
N, denoted asS(N). In the same level of G-Tree, all node
2. Given an intermediate nodeNand one of its childrenMin
G-Tree,S(M)is a subset ofS(N).
3. Each node has at leastmchildren unless it is root,m >2.
Each node has at mostMchildren and(M2+1) ≥m.
In this paper, for presentation convenience, we preservenode
for G-Tree andvertexfor the data graph and query graph. The G-tree index for the running example is illustrated in Figure 3.
Tree ConstructionThe straightforward approach to build G-Tree is to perform insertion sequentially. Here, we discuss G-Tree con-struction in up-bottom fashion. We can use graph partition algo-rithm, such as METIS [12], on the data graph to obtain nodes in the first level. Iteratively, for each node, we obtain its child nodes by graph partition. We terminate the above process when each leaf node area can be stored in a disk page.
Vertexes: 1 ~ 17
Vertexes: 1 ~ 4, 8 ~ 13 Vertexes: 5~7 , 14~17
Vertexes: 1 ~ 4 Vertexes: 8 ~ 13 Vertexes: 5 ~ 7 Vertexes: 14 ~ 17 Root R
N1 N2
N3 N4 N5 N6
Figure 3. G-Tree
Insertion and Split To insert a vertexv, an insertion operation begins at the root of G-Tree and iteratively chooses a child node until it reaches a leaf node. The main challenge of insertion is the criterion for choosing a child node. In order to handle the problem, we propose theCluster Coefficientin Definition 3.2. We always finds a child nodeNithat maximizes the cluster coefficient Cluster(v∪Ni)among allNi.
DEFINITION 3.2. Cluster Coefficient.
Cluster(N) = |AllEdges(N)| − |OutEdges(N)| |AllEdges(N)|
, where|OutEdges(N)|is the number of out edges linking
ver-tices in S(N) to vertices out ofS(N). |AllEdges(N)|is the
number of all edges adjacent to vertices inS(N).
Analogous to other balanced tree, such as R-tree, for a node N, we need to splitN into two nodes if the number of children is larger thanM, whereM is maximal fanout. We perform graph partition onNin order to obtain new nodesN1andN2. Splitting may cause the parent node to split as well and this procedure may repeat all the way up to the root.
Deletion and MergeTo delete a vertexvfrom the graphG, we find the leaf node inG-Treewherevis stored. For any nodeN along the path, we deletevfrom node areaS(N). After deletion, if nodeN has less thanmchildren, wheremis minimal fanout
ofG-Tree, we mergeN into anotherNiin the same level. The
criterion for choosingNiis to maximizeCluster(Ni∪N)among allNi. The procedure may propagate up to the root.
3.2
RM Algorithm
The large search space is the challenge to the top-k matching query problem. According to analysis in Section 1.3, we adopt the
score upper-boundpruning strategy in this paper. First, we discuss
the topological relationships between a matching and anode area
(defined in Definition 3.1) in G-Tree as follows.
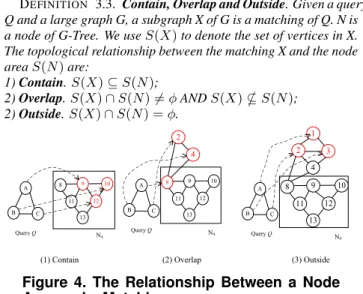
DEFINITION 3.3. Contain, Overlap and Outside. Given a query Q and a large graph G, a subgraph X of G is a matching of Q. N is
a node of G-Tree. We useS(X)to denote the set of vertices in X.
The topological relationship between the matching X and the node
areaS(N)are: 1)Contain.S(X)⊆S(N); 2)Overlap.S(X)∩S(N)=6 φANDS(X)*S(N); 2)Outside.S(X)∩S(N) =φ. 13 8 9 10 12 11 A B C Query Q A B C Query Q 13 8 9 10 12 11 A B C Query Q N4 N4
(1) Contain (2) Overlap (3) Outside
1 2 3 4 13 8 9 10 12 11 N4 2 4
Figure 4. The Relationship Between a Node Area and a Matching
Figure 4 shows the examples aboutcontain,overlapandoutside.
DEFINITION 3.4. Boundary Vertex. Given a large graphG
and a nodeN in G-tree for graphG, for a vertexvin node area
S(N), if there exists at least one neighbor vertex that is not in
S(N),vis aBoundary Vertexw.r.tS(N).
DEFINITION 3.5. d-Extension Node Area. Given a nodeN
in G-Tree, a vertexvis a boundary vertex w.r.tS(N).N(v, d) =
∪{vj|the distance betweenvj and vis no larger than d}. We
assume that there arem boundary verticesvi inS(N). Thed
-Extension Node Area is denoted asES(N, d) = (Si=m
i=1 N(vi, d)) S S(N). 1 2 3 4 17 8 N3 1-Extension N3
Figure 5.d-Extension Node Area
Figure 5 shows 1-ExtensionN3(that isES(N3,1)) in the running example.
THEOREM 3.1. Given a query graphQand a large graphG,
X is a matching ofQinG. For a node areaS(N), ifX is
con-tained inS(N)or overlapped withS(N),X must be contained
inES(N, Dia(Q)), whereDia(Q)is theQ’s diameter.
Given a query graphQwithnvertices and Extension node area ES(N, Dia(Q)),Xis a matching contained inES(N, Dia(Q)). To evaluate the upper bound ofScore(X), we work as follows. For each vertexuiin query graphQ, we find all candidate match-ing verticesvij inES(N), wherej = 1...m. Then we define Sim(ui, ES(N, Dia(Q))) = M ax(Sim(ui, vij)). According to Definition 1.4, ifSim(ui, ES(N, Dia(Q)))< γ, it is clear to know that there exists no matching X contained inES(N, Dia(Q)). It means that the nodeN in G-Tree can be pruned safely. Other-wise, we use the following theorem to evaluate the upper bound of Score(X).
THEOREM 3.2. Given a query graph Q with n verticesui, X is
a matching ofQcontained in or overlapped with node areaS(N).
We defineU pScore(Q, N)=Pi=n
i=1Sim(ui, ES(N,|Dia(Q)|)).
U pScore(Q, N)is the upper bound ofScore(X).
Given a queryQin Figure 2 and a nodeN3of G-Tree in Fig-ure 3,U pScore(Q, N3)=Sim(A, ES(N3, Dia(Q)))+Sim(B,
ES(N3, Dia(Q)))+Sim(C, ES(N3, Dia(Q)))=0.1 + 0.6 + 0.3 = 1.0.
The pseudo-code forRMalgorithm is given in Algorithm 1. All child nodesNiof root are inserted into the max-heapHin non-ascending order ofU pScore(Q, Ni)(Line 1). Initially, we setβ =−∞(Line 2). If the heap headN is a leaf node, we remove
Nfrom the heap and perform sub-graph isomorphism to find all matchings ofQin ES(N, Dia(Q)). They are inserted into the max-heapRin non-ascending of their matching scores. We update βto be the k-th largest matching score inR(Lines 7-10). If the heap headNis non-leaf node, we removeN from the heap and insert all its child nodesCiinto the heap in non-ascending order of U pScore(Q, Ci)(Lines 12-13). RM algorithm terminates when βis not larger thanU pScore(Q, N), whereN is the heapH’s head. (Line 5)
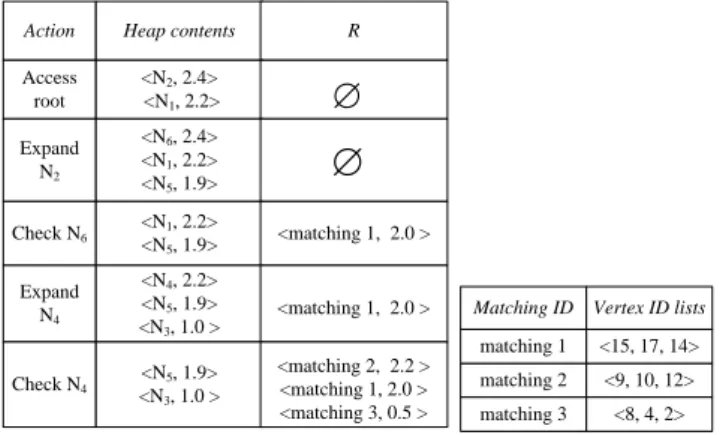
Action Heap contents R
Access root <N2, 2.4> <N1, 2.2> Expand N2 <N6, 2.4> <N1, 2.2> <N5, 1.9>
∅
matching 2 <9, 10, 12> matching 3 <8, 4, 2> matching 1 <15, 17, 14> Matching ID Vertex ID lists Check N6 <N1, 2.2> <N5, 1.9> <matching 1, 2.0 > Expand N4 <N4, 2.2> <N5, 1.9> <N3, 1.0 > <matching 1, 2.0 > Check N4 <N5, 1.9> <N3, 1.0 > <matching 2, 2.2 > <matching 1, 2.0 > <matching 3, 0.5 >∅
Figure 6. Heap Content
In the running example, we first access the root and insert all its child nodes into the max-heapH, as shown in Figure 6. Since U pSocre(Q, N2) = 2.4 > U pSocre(Q, N1) = 2.2,N2is be-foreN1in the heap.N2is heap head, therefore, we “expand”N2.
N5 andN6 are children ofN2, which are inserted into the heap.
N6 is the next expanded node. SinceN6 is a leaf node, we re-moveN6 from the heap and perform sub-graph isomorphism to find all matchings ofQinES(N6, Dia(Q)). We findmatching 1 inES(N6, Dia(Q))with score 2.0, which is inserted into the result setR. Now,N1is heap node. N1’s children, that areN3 andN4, are inserted into the heap. Next, sinceN4is a leaf node, we removeN4from the heap and perform sub-graph isomorphism to find all matchings inES(N4, Dia(Q)), that arematching2 andmatching3. We keep the thresholdβto be the k-th largest matching score by now (k=2 in the running example). Now,β= 2.0 > U pSocre(Q, N5) = 1.9, whereN5 is the heap head. It indicates that all left nodes can be pruned safely. We report top-2 matchings in the heap R(that are matching 2 and 1) and the algorithm terminates.
THEOREM 3.3. (Algorithm Correctness) RM algorithm can re-port the correct top-K matchings.
Algorithm 1 RankedMatching (RMfor short)
Require: Input: queryQ, a large graphGand G-Tree indexT. Output: Top-k matchings ofQinG
1: Insert all child nodesNiofT’srootinto the max-heapHaccording toU pScore(Q, ES(Ni, Dia(Q))).
2: Setβ=−∞. 3: while|H|>0do
4: the head of heapHis nodeN. 5: ifβ > U pScore(Q, N)then
6: Break
7: ifNis a leaf nodethen
8: Remove N from the heapH and find all matchings ofQin
ES(N, Dia(Q))by sub-graph isomorphism.
9: The matchings are inserted into the max-heapRin descending order of their matching scores.
10: Updateβto be the k-th largest matching score. 11: else
12: RemoveNfrom the heapH
13: For all child nodesCiofN, they are inserted into max-heapH in descending order ofU pScore(Ci)
14: Report the top-k matchings inC.
Proof.(sketch) It is straightforward to know that, if we assess ev-ery leaf node by sub-graph isomorphism, we can find the correct top-k matchings. If the algorithm terminates when|H|= 0(Line 3), it means that each leaf node has been checked. Therefore, the algorithm can report the correct top-k answers. If the algorithm terminates whenβ > U pScore(Q, N) (Line 6), it means that, for un-assessed leaf nodes, there exits no matching whose score is larger thanβ(βis the k-th largest matching score by far). It in-dicates that we have found the correct top-k matchings. Therefore we prove the correctness of RM algorithm.2
THEOREM 3.4. Given a top-k queryQ, for any leaf nodeL, the sufficient and necessary condition for performing sub-graph
isomorphism betweenQandES(L, Dia(Q))is thatU pScore(Q, L)
≥β∗, whereβ∗is the k-th largest matching score in the final
re-sults.
Proof.(sketch) 1)sufficient condition. If there exists a leaf node L that has not been checked by sub-graph isomorphism so far, whereU pScore(Q, L) ≥β∗, there must existLor its ancestor in the heapH according toRM algorithm. It is clear to know β∗ ≥ β (β is the k-th largest matching score by far). Since U pScore(Q, L)≥β∗,U pScore(Q, L)≥β. It means that the algorithm cannot terminate, according to Line 5. Therefore, for any leaf nodeL, ifU pScore(Q, L)≥β∗, it must be checked by sub-graph isomorphism before algorithm termination.
2)necessary condition. Assume that there exits a leaf nodeL0,
whereU pScore(Q, L0) < β∗, andL0 needs to be checked by sub-graph isomorphism before algorithm termination. SinceL0 needs to be checked, it means thatL0is the recent heap head and U pScore(Q, L0) > β. SinceU pScore(Q, L0) < β∗andL0 is the recent heap head, it means that we cannot find any matching with score≥β∗in un-accessed leaf nodes. It also indicates that the final k-th largest matching score< β∗, which leads to con-tradiction (β∗is the final k-th largest matching score). Therefore, there exits no leaf nodeL0, whereU pScore(Q, L0)< β∗, andL0 needs to be checked by sub-graph isomorphism.
In conclusion, we prove the correctness of Theorem 3.4.2
Pruning Effect Discussion. To evaluate the pruning effect of RM algorithm, we define theassess ratioto be the ratio of the
number of assessed leaf nodes to the total number of leaf nodes in G-Tree. Theorem 3.4 shows the underlying reason thatRM algo-rithm can obtain good pruning power. In fact, each leaf node corre-sponds to a cluster in the large data graph. Different clusters (leaf nodes) have different characteristics. For example, in PPI network, these clusters correspond to different functional groups. There-fore, given a queryQ, for most leaf nodesL,U pScore(Q, L)is small, sinceQandLhave no common characteristics. According to Theorem 3.4, these leaf nodes will not be assessed due to small U pScore(Q, L). In experiments, we will evaluate our method by two important real Datasets: S.cerevisiae and DBLP dataset. Ex-tensive results confirm our intuition about pruning effect.
However, whenDia(Q)is large, we always obtain a large ex-tension node areaES(N, Dia(Q))during query processing. It means that we will spend more time to perform sub-graph isomor-phism. In order to handel the problem, we propose the advanced RM algorithm in the following section.
3.3
Advanced RM algorithm
The pseudo-code of AdvancedRMalgorithm is shown in Al-gorithm 3.3. We partition the queryQintompartsQi(Line 1), andM ax(Dia(Qi)) < θ(we discuss settingθlater). For each query partQi, we maintain a max-heapRito store all matchings ofQithat have been founded by now. The algorithm is iterated from n=1 (Line 7∼12). In each iteration step, for eachQi, we call functionSub RM(Qi, n, Hi, Ri)to return the correct
top-nmatchings ofQi in the max-heapRi(Line 9∼10)(Sub RM function is analogous toRM algorithm). Then, for the firstn matchings ofQiin eachRi, we check whether there exist some matchings that can be assembled into a matching ofQ. These assembled matchings ofQare inserted into a max-heapR(Line 11). We setβto be thek-th largest matching score ofQinR by now, and setβito be then-th largest matching score ofQiin Riby now (Line 12). Ifβ >Pi=m
i=1 βi, the iteration terminates (Line 7). The algorithm report the top-k matchings inR(Line 13). The algorithm correctness can derived from the correctness ofRMandT Aalgorithm [7]. Due to space limited, we omit the proof. Notice that re-calling functionSub RMat thenth iteration only needs to compute thenth largest matching ofQi, and it does not re-compute the first (n-1) largest matchings ofQi.
Algorithm 2 AdvancedRankedMatching (ARMfor short)
Require: Input: queryQ, a large graphGand G-Tree indexT. Output: Top-k matching ofQinG.
1: PartitionQintompartsQ1...Qm, and eachDia(Qi)< θ. 2: set n=0
3: Setβand allβito be -∞. 4: Set max-heapsRandRito beφ. 5: foreachQido
6: Insert all child nodesNiof T’s root into the max-heapHiaccording toU pScore(Qi, ES(Ni, Dia(Qi))). 7: whileβ <Pi=m i=1 βido 8: n=n+1 9: foreachQido 10: CallSub RM(Qi, n, Hi, Ri)
11: For the firstnmatchings in eachRi, check whether there exist some matchings that can be assembled into a matching ofQ. These matchings ofQare inserted into a max-heapR.
12: setβto be thek-th largest matching score ofQinRby now, set
βito be then-th largest matching score ofQiinRiby now. 13: Report top-k matchings ofQin the max-heapR.
Discussion aboutθ.Sub-graph isomorphism in Line 7 of function
Sub RMin Algorithm 3.3 dominates the algorithm performance. It is straightforward to know|ES(N, Dia(Qi))| ≈O(degree|Dia(Qi)|), whereN is an arbitrary leaf node anddegreeis the average ver-tex degree in the data graph. In the worst case, the time com-plexity of sub-graph isomorphism algorithm in Line 7 in func-tionSub RMisO(|V(Qi)|2∗ |
ES(N, Dia(Qi))|!)[5]. There-fore, according to Line 7 of functionSub RM, we should make θ=M ax(|Dia(Qi)|)as small as possible. However, on the other hand, lessθmeans more query partsQi, which leads to more cost in Line 11 of Algorithm 3.3. It is difficult to quantify the trade-off aboutθfrom theoretical analysis. Nonetheless, we still have some guidelines aboutθ. Since, for any state art of sub-graph isomor-phism algorithm, it cannot work well when|ES(N, Dia(Qi))|> 1000 [5]. Our experiment study also confirms that. Therefore, we maximizeθwhenM ax(|ES(N, Dia(Qi))|)<1000.
Assembling matchings ofQi. Assume that a queryQis parti-tioned intompartsQi, i=1...m. The edges connecting theseQi are called “cut” edges. In Line 11 of Advanced RM algorithm, if 1) for each max-heapRi, there is a matchingXiofQi, and 2) for each cut edge inQ, there exists a edge connecting corresponding Xiin the data graphG, and 3)Xi∩Xj =φ,i6=j, then these matchingXican be assembled into a matchingXofQ.
Sub RM(Qi, n, Hi, Ri)
1: while|Hi|>0do
2: the head of heapHiis nodeNi.
3: setβito be the n-th largest matching score ofQiinRiby now.
4: ifβi> U pScore(Qi, Ni)then
5: Break
6: ifNiis a leaf nodethen
7: RemoveNifrom the heapHiand find all matchings of QiinES(Ni, Dia(Qi))by sub-graph isomorphism. 8: The matchings are inserted into the max-heapRiin
de-scending order of their matching scores. 9: else
10: RemoveNifrom the heapHi
11: For all child nodesCiofNi, they are inserted into max-heapHin descending order ofU pScore(Ci)
4.
Experiments
In this section, we report our experiment results to evaluate our methods in two real data sets. All experiments are implemented by standard C++ with STL library support and compiled by Visual Studio 2003 in a P4 1.7GHz machine of 1G RAM running Win-dows XP. To our best knowledge, there is no existing algorithm on top-k matching problem proposed in this paper. The most related and recent work is GraphM atch[24]. In fact, there are some differences between each other. First,GraphM atchrelaxes sub-graph isomorphism matching by only considering pair-wise ver-tex distance. Second,GraphM atchallows existing un-matching vertices in queryQand indel vertices in the matching ofQin the data graph. In experiments, to enable performance comparison, we set parameterindel=0 (not allowing indel vertices) and set a big penalty value for each un-matching vertex inQ(not allow-ing un-matchallow-ing vertices inQin top-k matchings). We download
GraphMatchfromhttp://faculty.cs.tamu.edu/shsze/graphmatch.
Furthermore, we design a TA variation algorithm for top-k match-ing query problem, calledTA-matching. Given a queryQ, for each vertexuin Q, we rank the verticesvj in data graphGin
non-ascending order ofSim(ui, vj)to form the listLi. Similar with TA-algorithm [7], we scan all listsLiin parallel. For each en-countered vertexvj, we perform sub-graph isomorphism between Qand the local area aroundvj in the data graphG. The algo-rithm continues until all left vertices cannot form a top-k matching (analogy to TA algorithm). TA-matching has a significant limita-tion: estimation about the upper bound of the left matching scores is not tight.
DatasetsWe use two real datasets, that are DBLP and protein in-teraction network of S.cerevisiae.
1) DBLP Dataset: We construct a co-author network G: every
author is denoted as a vertex inG; and the edge is introduced when the corresponding two authors have at least one co-authored paper. We consider about 100 important conferences in differ-ent areas to constructG. On the whole, there are about 100K vertices and about 400K edges inG. We describe each vertex (a author) by a paper title string title, combining the titles of all papers that he or she published. To generate a queryQ, we randomly extract a sub-graph fromGwith the pre-defined vertex number. To evaluate the vertex similaritySim(m, n)in Defini-tion 1.5, we define it by the similarity between paper title strings of two corresponding authors. To be specific, for two verticesn andmin queryQand the co-author networkGrespectively, we defineSim(n, m) = |n.title|n.title∩m.title| |, where|n.title∩m.title|is the number of common words inn.titleandm.title. Obviously,
0≤Sim(n, m)≤1.
2) S.cerevisiae Dataset: We download it from DIP3and represent
it by an undirected graphGin which each vertex represents a pro-tein and each edge represents interactions between two propro-teins. There are about 4934 vertices and 17346 edges inG. Similar with [24], for two verticesnandmin queryQand the data graphG, we defineSim(n, m)to be as the minus-log E-value between two corresponding protein sequence. To generate a synthetic query, we randomly extract a sub-graph fromG. Then, each vertex in the sub-graph is perturbed by pre-specified amount of point mutations in its corresponding protein sequences.
All experiment results in this section are the average results of 100 queries. 1K 2K 3K 4K 5K 0 5 10 15
Data Graph Size
Total Response Time (seconds)
RM TA−matching GraphMatch
(a) Response Time in Top-100 Query,
|Dia|= 5,|Q| = 10,γ = 0.0, in S.cerevisiae dataset 20K 40K 60K 80K 100K 100 101 102
Data Graph Size
Total Response Time (seconds)
RM TA−matching GraphMatch
(b) Response Time in Top-100 Query,
|Dia|= 5,|Q|= 20,γ= 0.5, in DBLP dataset
Figure 7. Scalability Test
Scalability StudyWe test scalability of our methods in Figure 7 on both datasets, and compare them withGraphMatch. It is diffi-cult forGraphMatchto work when the data graph has more than 60K vertices. Our methods have good scalability.
Performance StudySince there are only about 5,000 vertices in
3http://dip.doe-mbi.ucla.edu
S.cerevisiae network, in order to test the performance ofRM al-gorithm in a large graph, we only report the experiment results in DBLP dataset as follows. The default vertex cardinality of the data graphGis 100K in the following experiments. We only evaluate RM algorithm and TA-matching algorithm proposed in the paper, since it is difficult forGraphM atchto work on the large graph with 100K vertices.
Iteratively, we build the G-Tree by running graph partition al-gorithm METIS [12] on the data graphG. We set the fanout of G-tree to be 50. First, we fix the diameter of queryQto be 5 and thresholdγ=0.5 (γis defined in Definition 1.5), and vary the size ofQ(that is number of vertices inQ) from 10 to 25. Total response time about top-100 queries is shown in Figure 8(a). We also eval-uate the pruning effects of G-Tree in Figure 8(b) by assess ratio in RM algorithm. Assess ratio is defined as the ratio of the num-ber of assessed leaf nodes in RM algorithm to the total numnum-ber of leaf nodes in G-Tree. RM algorithm only performs expensive sub-graph isomorphism when it assesses the leaf nodes. Therefore, less assess ratio indicates faster response time. RM algorithm out-performsT A-matching algorithm in Figure 8(a). Observed from Figure 8(a), we find that the query response time in RM algorithm decreases with increasing query size. The underlying reason is that, when the query graph is large, G-tree provides more efficient pruning effect, as shown in Figure 8(b). Notice that, the trend of response time for RM algorithm in Figure 8 happens when we fix Dia(Q). If the query diameter increases with the query size, the response time will increase. We evaluate RM performance with regard to the query diameter as follows.
10 15 20 25 0 10 20 30 40 50 60 Query Size
Total Response Time (seconds)
RM TA−matching
(a) Response Time in Top-100 Query,
|Dia|= 5,γ= 0.5 10 15 20 25 0 0.5 1 1.5 2 2.5 3 Query Size Assess Ratio (%) RM
(b)Assess Ratio in RM algorithm in Top-100 Query,|Dia|= 5,γ= 0.5
Figure 8. Varying Query Size
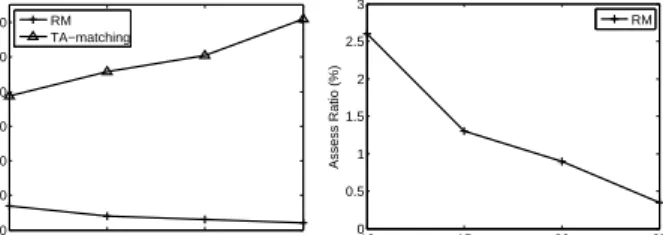
We fix the query size to be 20 andγ=0.5 and vary the diam-eter of query from 2 to 10. Figure 9(a) reports the response time and pruning effect of G-tree. The clear trend is that the response time increases with increasing query diameter. WhenRM algo-rithm assesses a leaf nodeN, it is clear to know that we obtain a large extend node areaES(N, Dia(Q))whenDia(Q)is large. It means that we will spend more time to perform sub-graph iso-morphism betweenQandES(N, Dia(Q)). There is the similar problem in TA-matching algorithm.
To address large query diameter problem, we propose the Ad-vanced RM algorithm in Section 3.3. We evaluate the AdAd-vanced RM algorithm in Figure 10. We fix the query size to be 20 and vary the query diameter from 6 to 14. Results are reported in Fig-ure 10. Though, assess ratio of Advanced RM is larger than that in RM, AdvancedRMalgorithm improves the query performance (response time). The underlying reason is that we need less time to perform sub-graph isomorphism in AdvancedRM algorithm, since|ES(N, Dia(Qi))|is small. We partition the queryQinto different parts andM ax(Dia(Qi))< θ= 5.
2 4 6 8 10 0 20 40 60 80 100 Diameter Size
Total Response Time (seconds)
RM TA−matching
(a) Response Time in Top-100 Query,
|Q|= 20,γ= 0.5 2 4 6 8 10 0 0.5 1 1.5 2 2.5 Diameter Size Assess Ratio (%) RM
(b)Assess Ratio in RM algorithm in Top-100 Query,|Q|= 20,γ= 0.5
Figure 9. Varying Diameter Size
6 8 10 12 14 0 50 100 150 200 Diameter Size
Total Response Time (seconds)
RM Advanced RM
(a) Response Time in Top-100 Query,
|Q|= 20,γ= 0.5 6 8 10 12 14 0 1 2 3 4 5 Diameter Size Assess Ratio (%) RM Advanced RM
(b) Assess Ratio in Top-100 Query,
|Q|= 20,γ= 0.5
Figure 10. Evaluate Advanced RM algorithm
At last, we test RM algorithm with decreasingγ. We fix the query size to be 20 and|Dia(Q)|=5. Whenγ=0.5, for each vertex in queryQ, there are about 1,000 candidate matching vertices in data graph G. Whenγ=0.1, for each vertex in query Q, there are more than 10,000 candidate matching vertices in data graph G. It is clear to know, the search space of sub-graph isomorphism when γ=0.1 is larger than that inγ = 0.5. Therefore, Figure 11(a) shows that total response time increases with decreasingγ. The assess ratio of RM only depends on the final top-k answers. The sufficient and necessary condition that a leaf node needs to be performed sub-graph isomorphism is discussed in Theorem 3.4. Usually, when k is small, decreasingγdoes not affect the final top-k answers. Therefore, assess ratio keeps invariable.
0.5 0.4 0.3 0.2 0.1 0 50 100 150 200 Gamma Value
Total Response Time (seconds)
RM TA−matching
(a) Response Time in Top-100 Query,
|Q|= 20,|Dia|= 5 0.1 0.2 0.3 0.4 0.5 0.8 0.85 0.9 0.95 1 Gamma Value Assess Ratio (%) RM
(b)Assess Ratio in RM algorithm in Top-100 Query,|Q|= 20,|Dia|= 5
Figure 11. Vary the Thresholdγ
5.
Conclusions
In this paper, we propose a novel sub-graph matching query problem in a very large data graph. It finds many applications in biological network and social network. To address the
prob-lem, we design a balanced treeG-Treeto index the large graph. Adoptingscore-upper boundpruning strategy, based on G-Tree, we propose theRM algorithm to locate the top-k matchings of queryQin the large data graph. Extensive experiments shows that our algorithm has good scalability and fast response time, which outperforms the alternative method by orders of magnitude.
6.
References
[1] A. Z. Broder, R. Kumar, F. Maghoul, P. Raghavan, S. Rajagopalan, R. Stata, A. Tomkins, and J. L. Wiener. Graph structure in the web.
Computer Networks, 33(1-6), 2000.
[2] D. Cai, Z. Shao, X. He, X. Yan, and J. Han. Community mining from multi-relational networks. InPKDD, 2005.
[3] J. Cheng, Y. Ke, W. Ng, and A. Lu.f g-index: Towards
verification-free query processing on graph databases. InSIGMOD, 2007.
[4] D. Conte, P. Foggia, C. Sansone, and M. Vento. Thirty years of graph matching in pattern recognition.IJPRAI, 18(3), 2004. [5] L. P. Cordella, P. Foggia, C. Sansone, and M. Vento. A (sub)graph
isomorphism algorithm for matching large graphs.IEEE Trans. Pattern Anal. Mach. Intell., 26, 2004.
[6] J. H. D.W. Williams and W. Wang. Graph database indexing using structured graph decomposition. InICDE, 2007.
[7] R. Fagin, A. Lotem, and M. Naor. Optimal aggregation algorithms for middleware. InPODS, pages 102–113, 2001.
[8] S. Fortin. The graph isomorphism problem.Department of Computing Science, University of Alberta, 1996.
[9] P. Y. H. Jiang, H. Wang and S. Zhou. Gstring: A novel approach for efficient search in graph databases. InICDE, 2007.
[10] T. R. Hagadone. Molecular substructure similarity searching: Efficient retrieval in two-dimensional structure databases.J.Chem. Inf. Comput. Sci, 32, 1992.
[11] H. He and A. K. Singh. Closure-tree: An index structure for graph queries. InICDE, 2006.
[12] G. Karypis and V. Kumar. A fast and highly quality multilevel scheme for partitioning irregular graphs.SIAM Journal on Scientific Computing, 1995.
[13] M. Kuramochi and G. Karypis. Finding frequent patterns in a large sparse graph.Data Mining and Knowledge Discovery, 2005. [14] V. Lacroix, C. G. Fernandes, and M.-F. Sagot. Motif search in
graphs: Application to metabolic networks.IEEE/ACM Trans. Comput. Biol. Bioinformatics, 3(4), 2006.
[15] A. Ng, M. Jordan, and Y. Weiss. On spectral clustering: Analysis and an algorithm. InNIPS, 2001.
[16] E. Ravasz and A.-L. Barabasi. Hierarchical organization in complex networks.Physical Review E, 67, 2003.
[17] J. Scott, T. Ideker, R. M. Karp, and R. Sharan. Efficient algorithms for detecting signaling pathways in protein interaction networks. In
RECOMB, 2005.
[18] A. SF, G. W, M. W, M. EW, and L. DJ. Basic local alignment search tool.J Mol Biol., 215(3), 1990.
[19] D. Shasha, J. T.-L. Wang, and R. Giugno. Algorithmics and applications of tree and graph searching. InPODS, 2002. [20] S. Trißl and U. Leser. Fast and practical indexing and querying of
very large graphs. InSIGMOD Conference, pages 845–856, 2007. [21] D. J. Watts.Six Degrees:The Science of a Connected Age. W. W.
Norton&Company, 2004.
[22] P. Willett. Chemical similarity searching.J. Chem. Inf. Comput. Sci, 38(6), 1998.
[23] X. Yan, P. S. Yu, and J. Han. Graph indexing: A frequent structure-based approach. InSIGMOD, 2004.
[24] Q. Yang and S. hoi Sze. Path matching and graph matching in biological networks.J Comput Biol., 14(1), 2007.
[25] S. Zhang, M. Hu, and J. Yang. Treepi: A novel graph indexing method. InICDE, 2007.