International Journal of Current
Medical and Pharmaceutical
Research
Available Online at http://www.journalcmpr.com
DOI: http://dx.doi.org/10.24327/23956429.ijcmpr20170182
RESEARCH ARTICLE
DETERMINATION OF SEX OF ADULT HUMAN SCAPULA BY DISCRIMINANT
FUNCTION ANALYSIS
Bhaskar B.Reddy* and Doshi M.A
Department of Anatomy, Krishna Institute of Medical Sciences Deemed University, Karad, India
ARTICLE INFO ABSTRACT
Background: Sex determination is one of the most important determinations to be made from human remains and is an essential first step in the development of the biological profile in forensics, anthropology and bioarchaeology. The aim of this study was to determine whether sexing of unknown adult human scapulae can be done by applying values of morphometric parameters and formulae generated by present study on adult human scapulae of known sex and to find out the best parameters for sex determination.
Materials and Methods: Various metric measurements were recorded using osteo metric board, measuring tape, non elastic thread, sliding calipers and vernier calipers on adult human scapulae. Results: Sex was correctly estimated by using stepwise analysis, for the scapula 95% of males and 96.3% of females with a total accuracy of 95.6%
Direct discriminant function analysis, correct estimated sex for the scapula was 97 % in males and 96.3 % in females with a total accuracy of 96.7%.
Conclusion: Present study exhibited better classification accuracy for multiple variables than those of single variables. In the scapula, the most discriminating variables in stepwise analysis are the Maximum scapular breadth, Glenoid cavity maximum length, Glenoid cavity maximum breadth. In direct analysis, the single most useful variable was the Maximum scapular breadth.
Copyright © 2017 Bhaskar B.Reddy and Doshi M.A. This is an open access article distributed under the Creative Commons Attribution License, which permits unrestricted use, distribution, and reproduction in any medium, provided the original work is properly cited.
INTRODUCTION
Sex determination of the human skeleton has been studied in forensic and physical anthropology.1 Since the beginning of the field of physical anthropology, osteologists and anatomists have studied human remains in order to provide new and more accurate ways of building the biological profile.
When unidentified skeletal remains are found in natural mass disasters like earth quakes, tsunamis, landslides, floods etc., and in man-made disasters such as terrorist attacks, bomb blasts, mass murders and in cases when the body is highly decomposed or dismembered to deliberately conceal the identity of the individual, a biological profile is created by a forensic anthropologist to help estimate the sex, ancestry, age, and stature of the individual. Of all of these, sex is one of the most important aspects, as it is a key element in the process of identification. While DNA analysis has proven successful in identifying unknown victims and perpetrators of crime, it is of little value when there are no family members to positively identify or claim the deceased. 2,3,4
In India, forensic pathologists frequently encounter situations in which standard avenues for identification, e.g., fingerprints, DNA and ante mortem dental records, are of little or no value. In these situations, Forensic personnel frequently consult the
Anatomists to give their expert opinion for medico legal purposes, regarding the personal identity with respect to sex, age, stature, race and also probable cause of death. Examination of such skeletal remains forms the basis of their opinion.5,6
In the present scenario, forensic anthropologists are involved in discovering new methods of identification from skeletal remains, cadavers as well as living beings. The reason to work on new populations is that the earlier acquired standards of age and sex determination have lost their values due to secular changes in the modern populations.7, 8 Therefore, there is always a need to apply and test the methods to newer populations for making population standards for achieving precision and accuracy.
Therefore, it was suggested that osteometric studies should be considered “population specific”, which implies that sexual dimorphism varies between populations to such an extent that osteometric standards developed from one group cannot be reliably used on another population.9
Very few studies are available in India on determination of sex from human Scapulae, so present study made a sincere effort to enhance the accuracy of sex determination from adult human scapula using various parameters by applying
Article History:
Received 24th May, 2017
Received in revised form 23rd
June, 2017
Accepted 27th July, 2017
Published online 28th August, 2017
Key words:
Maximum scapular breadth, Glenoid cavity maximum length, Glenoid cavity maximum breadth.
Discriminant function analysis on population of Marathwada region of Maharashtra.
METHODS
The bones used in this study was obtained from Govt. Medical College, Aurangabad, Maharashtra. For the study, fully ossified dry bones, free of damage or deformity were used. Total of 180 bones were selected for the study out of which 100 were of males and 80 were of females. All the measurements were measured in millimeters. Present study was done on dry human bones, so ethical issues were not arised.
Scapula Measurements
1. Maximum scapular length (L): maximum distance from superior angle of the scapula to the inferior angle of scapula is measured with vernier calipers.
2. Maximum scapular breadth (Wd): maximum distance
between the middle of the dorsal border of the glenoid fossa to the end of the spinal axis at the vertebral border is measured with vernier calipers. 3. Glenoid cavity maximum length (GCL): maximum
distance between the superior border and the inferior border of the glenoid cavity is measured with vernier calipers.
4. Glenoid cavity maximum Breadth (GCW): maximum
distance between the anterior border and the posterior border of the glenoid cavity at mid point of glenoid cavity is measured with vernier calipers.
RESULTS
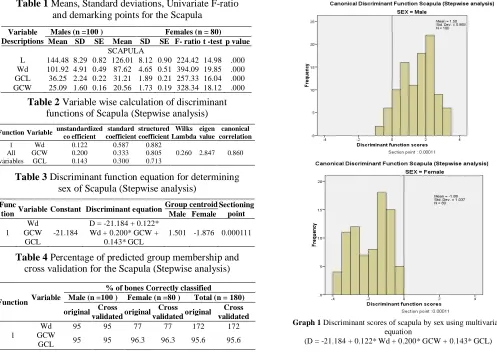
An analysis of variance test (ANOVA) provided descriptive statistics including the means, standard deviations and F-ratios of all the variables in both sex groups (Table 1).
The greatest differences in mean values appeared to be in Maximum scapular breadth (males 101.92 mm, females: 87.62 mm.), Glenoid cavity maximum Breadth (males 25.09 mm, females: 20.56 mm.) and Glenoid cavity maximum length (males 36.25 mm, females: 31.21 mm.)(Table 1)
A statistically significant difference (p < 0.001) was found between males and females for the osteometric variables of scapula. As can be seen in Table 1, the univariate F-ratio scores were the highest in the Maximum scapular breadth and Glenoid cavity maximum Breadth.
Stepwise discriminant function analysis of Scapula
A Stepwise discriminant function was performed to determine the most significant variables contributing to the discrimination of gender.
Stepwise analysis was run on four measurements from the scapula. The stepwise discriminant function procedure was performed using Wilk’s Lambda with F = 3.84 to enter and F = 2.71 to remove.
When all four variables were entered for the Scapula (Function 1), selected variables included: Maximum scapular breadth, Glenoid cavity maximum length, Glenoid cavity maximum Breadth showed largest metric discrimination between the sexes. (Table 2,3 & 4)
A direct analysis was then carried out on these above-mentioned variables, as they appeared to be the most constructive in statistically discriminating between the sexes
(Table 5, 6 and 7, direct Functions) Discriminant function score formula for Function 1 analysis is of Scapula
D = -21.184 + 0.122* Wd + 0.200* GCW + 0.143* GCL
The classification accuracy of the Scapula for the discriminant function formulae are presented in Table 4.
For the Scapula, Function 1 analysis (Table 4) showed that 95 males out of 100 cases were correctly classified with 5 individuals misclassified as females, thus resulting in 95% accuracy.
77 females out of 80 cases were correctly classified with 3 individuals misclassified as males, thus resulting in 96.3% accuracy.
Total 172 out of 180 cases were correctly classified with total accuracy of 95.6 %.
Cross validation showed similar result of original analysis.
Direct discriminant analysis of Scapula (Function 1 to 4, Tables 5, 6 & 7) (each variable separately)
A direct analysis was carried out on all individual variables of Scapula separately to identify the most constructive variable in statistically discriminating between the sexes. The results of the direct analyses and discriminant function score formula for each variable appear in Tables 5, 6 and 7 as Function 1 to 4. By direct analysis, Maximum scapular breadth is the best discriminant variable among all variables with 89% for males and 98.8% for females.
A direct discriminant analysis was applied to evaluate the diagnostic ability of individual variables that were previously selected as best discriminators of sex during the stepwise analysis. The results of the direct analyses appear in Table 5, 6 and 7 as Function 2, Function 3, Function 4 and refer to analyses of the Maximum scapular breadth, Glenoid cavity maximum length and Glenoid cavity maximum Breadth respectively.
Direct discriminant analysis (Function 5 Tables 5, 6 & 7) (All variables entered together)
A direct discriminant analysis was applied to evaluate the diagnostic ability of all variables entered together in direct discriminant analysis (Function 5, Table 5,6 & 7)
Discriminant function score formula for Function 5 analysis of Scapula is
D = -21.942 + 0.022* L + 0.107* Wd + 0.138* GCL + 0.172* GCW
The classification accuracy of the scapula for the discriminant function formulae are presented in Table 7. For the Scapula, Function 5 analysis showed that 97 males out of 100 cases were correctly classified with 3 individuals misclassified as females, thus resulting in 97 % accuracy.
77 females out of 80 cases were correctly classified with 6 individuals misclassified as males, thus resulting in 96.3 % accuracy.
Table 1 Means, Standard deviations, Univariate F-ratio and demarking points for the Scapula
Variable Descriptions
Males (n =100 ) Females (n = 80)
Mean SD SE Mean SD SE F- ratio t -test p value
SCAPULA
L 144.48 8.29 0.82 126.01 8.12 0.90 224.42 14.98 .000 Wd 101.92 4.91 0.49 87.62 4.65 0.51 394.09 19.85 .000 GCL 36.25 2.24 0.22 31.21 1.89 0.21 257.33 16.04 .000 GCW 25.09 1.60 0.16 20.56 1.73 0.19 328.34 18.12 .000
Table 2 Variable wise calculation of discriminant functions of Scapula (Stepwise analysis)
Function Variable unstandardized
co efficient
standard coefficient
structured coefficient
Wilks Lambda
eigen value
canonical correlation
1 All variables
Wd 0.122 0.587 0.882
0.260 2.847 0.860
GCW 0.200 0.333 0.805
GCL 0.143 0.300 0.713
Table 3 Discriminant function equation for determining sex of Scapula (Stepwise analysis)
Func
tion Variable Constant Discriminant equation
Group centroid Sectioning point Male Female
1 Wd GCW
GCL
-21.184
D = -21.184 + 0.122* Wd + 0.200* GCW +
0.143* GCL
1.501 -1.876 0.000111
Table 4 Percentage of predicted group membership and cross validation for the Scapula (Stepwise analysis)
Function Variable
% of bones Correctly classified
Male (n =100 ) Female (n =80 ) Total (n = 180)
original Cross
validated original
Cross
validated original
Cross validated
1
Wd GCW GCL
95 95 77 77 172 172 95 95 96.3 96.3 95.6 95.6
Table 5 Variable wise calculation of discriminant functions of Scapula (direct analysis)
Function Variable unstandardized
co efficient
standard coefficient
structured coefficient
Wilks
Lambda F ratio eigen value
canonical correlation
1 L 0.122 1 1 0.442 224.42 1.261 0.747
2 Wd 0.208 1 1 0.311 394.09 2.214 0.830
3 GCL 0.478 1 1 0.409 257.33 1.446 0.769
4 GCW 0.600 1 1 0.352 328.34 1.845 0.805
5 All Variables
L 0.022 0.183 0.658
0.255 - 2.915 0.863 Wd 0.107 0.515 0.871
GCL 0.138 0.289 0.704 GCW 0.172 0.286 0.795
Table 6 Discriminant function equation for determining sex of Scapula (direct analysis)
Function Variable Constant Discriminant equation Group centroid Sectioning point
Male Female
1 L -16.582 D = -16.582 + 0.122*L 0.999 -1.248 0.000333 2 Wd -19.907 D = -19.907 + 0.208*Wd 1.323 -1.654 -0.00011 3 GCL -16.246 D = -16.246 + 0.478*GCL 1.069 -1.337 -0.00033 4 GCW -13.855 D = -13.855 + 0.600*GCW 1.208 -1.510 0 5 All Variables -21.942 D = -21.942 + 0.022* L + 0.107* Wd +
0.138* GCL + 0.172* GCW 1.519 -1.898 0.000333
Table 7 Percentage of predicted group membership and cross validation for the Scapula (direct analysis)
Function Variable
% of bones Correctly classified
Male (n =100 ) Female (n =80 ) Total (n=180)
original Cross validated original Cross validated original Cross validated
1 L 90 90 66 66 156 156
90 90 82.5 82.5 86.7 86.7
2 Wd 89 89 79 79 168 168
89 89 98.8 98.8 93.3 93.3
3 GCL 93 93 69 69 162 162
93 93 86.3 86.3 90.0 90.0
4 GCW 96 96 69 69 165 165
96 96 86.3 86.3 91.7 91.7
5 All variables 97 97 77 77 174 174
97 97 96.3 96.3 96.7 96.7
Graph 1 Discriminant scores of scapula by sex using multivariate
equation
CONCLUSION
Sex determination is the most significant information which can be obtained from bones. In previous studies, morphologic methods were mostly used to determine sex. However, metric measurements were preferred due to their easy repeatability, high accuracy, and no requirement for special skills.
One of the first metric studies conducted on the variation of the human scapula was published in 1887 by a medical professor named Thomas Dwight. Dwight collected statistics on scapular indices for people of different ancestries, Native American, White European, and Black African. The two scapular indices were defined as the breadth of the scapula and the infra-spinous index.10
In 1956, Bainbridge and Genovese-Tarazaga11 examined human scapulae for differences related to sexual dimorphism. The results showed that the breadth of the glenoid fossa, the maximum breadth of the scapula, and the maximum length of the scapula are good discriminators in sexual dimorphism. The breadth of the glenoid cavity was a significant variable for estimating sex from the scapula.
In 1994, Di Vell112 and colleagues used a contemporary Italian skeletal population and measured seven areas of the scapula to examine sexually dimorphic traits. The researchers conducted multivariate discriminate function analyses on the three most sexually dimorphic measurements (maximum distance between the acromion and coracoid, maximum length of the coracoid, and length of the glenoid cavity) and achieved an accuracy rate of 95% on classifying an individual as either male or female.
Prescher and Klumpen (1995)13 examined the total area of the glenoid cavity and its relationship to estimating sex from human skeletal remains. The researchers found that glenoid cavities larger than 9.57 cm would be estimated as male and scapulae smaller than 6.83 cm would be estimated as female. The researchers suggested that those individuals who fell between 6.83 cm and 9.57 cm be classified as indeterminate. Murphy (2002)14 and Ozer and colleagues (2006)15 used scapular measurements and statistical analyses to develop estimation of sex methodologies for unknown individuals. Murphy (2002) used a prehistoric New Zealand population and Ozer and colleagues (2006) used a medieval bone collection from East Anatolia. All studies employed the length and breadth of the glenoid cavity but Ozer and colleagues (2006) also used the maximum length and breadth of the scapula. The research concluded that high accuracy rates for estimating sex were population specific.
Macaluso (2010)16 measured the height and breadth of the glenoid cavity by using a standard sliding caliper. He reported that the measurements obtained by the two techniques, i.e. digital photographs and sliding caliper measurements were not
Table 8 Comparison of Scapula metric analysis for sex determination between previous studies and our study
Study Country Year Method Overall
accuracy
Accuracy in males
Accuracy in females
Giancarlo
Di Vella 12 Italy 1994
length of glenoid cavity,
maximum scapular breadth 90% - - Luis Rios Frutos 17 Central
America 2002
glenoid cavity breadth,
glenoid cavity length 85.6 to 94.8 - - Ozer et al 15 Turkey (2006) maximum scapular height, maximum scapular
breadth, glenoid cavity height, glenoid cavity breadth 82.9% to 95.0% - - Dabbs, G.R., and P.H.
Moore-Jansen 18 Egypt 2010
maximum length of the scapula, maximum length of the scapular spine, breadth of the infraspinous body, height of the glenoid fossa, breadth of the glenoid
fossa.
84.0 to 88.0% - -
Macaluso JP Jr 16 South
Africa 2010 area of the glenoid fossa glenoid fossa breadth 88.3% to 85.8% - - Dabbs, G and
Moore-Jansen 18
South
Africa 2010
maximum length of the scapula,
maximum breadth of the scapula, 71.4% to 88.9% - - Present study India 2013 Maximum scapular breadth, Glenoid cavity maximum
length, Glenoid cavity maximum Breadth 95.6 95 96.3
Graph 2 Discriminant scores of scapula by sex using multivariate
equation
statistically different. Frutos (2002)17 used a contemporary Guatemalan population, employed the length and breadth of the glenoid cavity and concluded that high accuracy rates for estimating sex were population specific. Dabbs and Moore-Jansen (2010) 18 developed and tested the five- and
two-variable models against scapular measurements of
contemporary cadaveric sample of unknown ancestry, the accuracies of the five variable and two-variable models in identifying the sex of an individual ranged from 71.4% to 88.9%
In conclusion, in forensic anthropological cases in which the skull and pelvic bones are fragmentary or missing, sex can be assessed with a high degree of accuracy using other regions of the skeleton. The present study has confirmed that the accuracy of sex determination using scapular measurements of the can be improved by deriving a discriminant function.
Present study shows, the most discriminating variables included in the stepwise analysis are Maximum scapular breadth, Glenoid cavity maximum length, Glenoid cavity maximum Breadth with 95% accuracy in males, 96.3% accuracy in females and 95.6% overall accuracy.
In, direct analysis, the single most useful variable was the Maximum scapular breadth with 96% accuracy in males, 86.3% accuracy in females and 91.7% overall accuracy.
Acknowledgements
The author would like to express his gratitude to Dr. Mrs. C.V.Diwan, professor & Head, Department of Anatomy, GMC, Aurangabad for giving permission to study human skeletal remains.
Also, he would like to express his special gratitude to Dr. Mrs.Gaonkar, Controller of examinations, KIMS University, Karad, for her support and encouragement.
References
1. Krogman W.M. - "The Human Skeleton In Forensic Medicine", in “Sexing skeletal remains”, second printing. Charles C.Thomas Publisher, Springfield, Illinois. USA, (1973), 112-152.
2. Goes AC, Silva DA, Domingues CS, Sobrinho JM, Carvalho EF. Identification of a criminal by DNA typing in a rape case in Rio de Janeiro, Brazil. Sao
Paulo Med J. 2002; 120(3):77-79.
3. Iscan MY, Solla H.E., McCabe B.Q. Victim of a dictatorial regime: identification of Mr. Roberto Gomensoro Josman. Forensic Sci Int. 2005; 151(2-3):213-220.
4. Oz C, Levi JA, Novoselski Y, Volkov N, Motro U. Forensic identification of a rapist using unusual evidence. J Forensic Sci. 1999; 44(4):860-862.
5. Krishan K. Anthropometry in Forensic Medicine and Forensic Science: Forensic Anthropometry; Internet J Forensic Science. 2007, Vol. 2(1).
6. Padeyappanavar KV., Kazi AM., Bhusareddy PS., Kulkarni UK. Sexual dimorphism in adult human clavicles of North interior Karnataka. J Karnataka Medico-legal Soc, 2009 June; 18(1):3-13.
7. Ulijaszek SJ, Masci-Taylor CJN. Anthropometry: The individual and the population, Cambridge studies in biological anthropology. Cambridge UK: Cambridge University Press 1994: p213.
8. Eveleth, P B and Tanner, J M. World-wide Variation in Human Growth, Cambridge: Cambridge University Press 1976: p287.
9. Novotny V, İşcan MY, Loth SR. Morphological and
osteometric assessment of age, sex and race from the skull. In: İşcan MY, Helmer RP, editors. Forensic Analysis of the Skull. Wiley-Liss, Inc; 1993.p. 71-88. 10. Dwight, T. 1887 The Range of Variation of the Human
Shoulder-Blade. The American Naturalist 21(7): 627-638.
11. Bainbridge, D. and S. G. Genovese-Tarazaga 1956 A study of sex differences in the scapula. Journal of the Royal Anthropological Institute 86: 109-13.
12. DiVella, G., C. P. Campobasso, M. Dragone, and F. Introna 1994 Skeletal sex determination by scapular measurements. Boll. Soc. Ital. Biol. Sper. 70: 299–305. 13. Prescher, A., and T. Klümpen 1995 Does the area of the
glenoid cavity of the scapula show sexual dimorphism?
Journal of Anatomy 186: 223-22.
14. Murphy, A. M. C. 2002 Articular surfaces of the pectoral girdle: sex assessment of prehistoric New Zealand Polynesian skeletal remains. Forensic Science International 125: 134-136.
15. Ozer, I., K. Katayama, M. Sagir, and E. Gülec 2006 Sex determination using the scapula in medieval skeletons from East Anatolia. Collegium Antropologicum 30: 415-419.
16. Macaluso, J. P. 2010 Sex determination from the glenoid cavity in black South Africans: morphometric analysis of digital photographs. International Journal of Legal Medicine.
17. Frutos LR. Determination of sex from the clavicle and scapula in a Guatemalan contemporary rural indigenous population. Am J of Forensic Medicine and Pathology, 2002; 23(3):284-288.
18. Dabbs, G.R., and P. H. Moore-Jansen 2010. A method for estimating sex using metric analysis of the scapula.
Journal of Forensic Science 55(1): 149-152.