MODEL DEVELOPMENT FOR SIMULATION BASED GLOBAL OPTIMISATION
OF ENERGY EFFICIENT DATA CENTRES
Vojtěch Zavřel, J. Ignacio Torrens, John D. Bynum, Jan L.M. Hensen
Unit Building Physics and Services, Department of the Built Environment
Eindhoven University of Technology, Eindhoven, The Netherlands
ABSTRACT
Data centre (DC) energy consumption has been increasing exponentially over the last decades, following the rapid rise of computing demand. With this growth expected to continue in the near future, the focus lays on designing sustainable, energy efficient Data centres, and achieving optimal operation. This represents a challenging multi-domain problem. Moreover, the access to real facilities for testing of new operation strategies is extremely limited due to safety reasons. Simulation of DC models is a feasible alternative to overcome this constrain. This paper describes the development of a virtual DC testbed to support the assessment of operation strategies as part of the GENiC research project, which aims to optimize the operation of energy efficient DCs.
INTRODUCTION
The use of internet applications has been increasing exponentially over the last number of decades. In this context, data centres (DCs) have become a significant worldwide energy consumer. DCs account for approximately 2% of the global primary energy consumption, 10% when considering only electricity (Masanet & Koomey 2013). Rapid growth of computational demand is expected in the near future and the reduction of DCs energy consumption requires advanced techniques of DC design and operation to reach sustainable development in this area. Major internet service providers, DC operators and governments are now calling for novel technical solutions.
Among other things, modern DCs require novel sophisticated management tools, which are able to coordinate and optimize fundamental processes in DC such as Workload, Thermal and Power supply management. Novel control strategies should be able to support cost effective integration of renewable energy sources, energy storage and heat recovery (PikeResearch 2012). The international research project GENIC (Globally Optimized Energy Efficient Data Centres) addresses these multi-domain challenges through the development of a model-based control platform for wide optimization of DC operation. However, real DC facilities restrict any tests of novel operation strategies due to safety
reasons. Any data losses or interruption of the regular operation in a DC due to inadequate control may cause significant financial losses for DC operators and owners. The lack of physical testing in real DCs often discards or slows down the development and commissioning of novel model-based control strategies. Modelling methods and simulation can support testing of new operation strategies in DCs, eliminating the associated risks.
Fig. 1 Additional “virtual testing” phase for DC model-based control platform
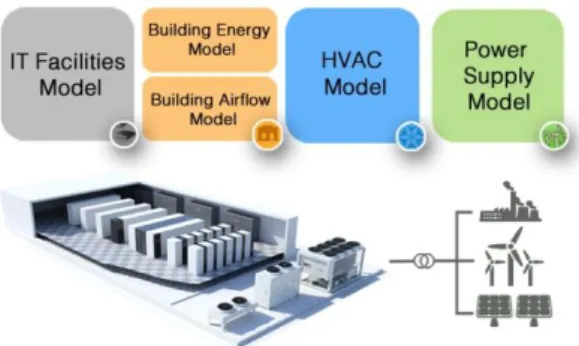
The development of a virtual DC testbed supports the assessment of novel operation strategies in DCs. This virtual DC should emulate real monitoring data and simulate the behaviour of all DC devices such as Information Technology (IT) equipment, DC space, HVAC devices and Power supply including renewable energy sources. Testing and commissioning of novel control platforms require tool to describe interactive communication among all DC devices. In other words, the virtual DC environment has to represent a multi-domain complex mathematical system and provide a transient response in a reasonable computational time. The emphasis for the development of the virtual DC environment is placed on scalability, complexity and connectivity.
Fig. 2 Schematic of the concept of the virtual data centre testbed
Zavrel, V., Torrens Galdiz, J.I., Bynum, J.D. & Hensen, J.L.M. (2015). Model Development for
Simulation based Global Optimization of Energy Efficient Data Centres. In Proc. Building Simulation
'15. Hyderabad: IBPSA.
DATA CENTRE ENERGY MODELLING
This paper describes a numerical representation of a DC space and proposes a modelling approach that combines building energy and airflow models (Fig. 2). As mentioned in the previous section, the testing and commissioning of a novel operational platform requires reasonable computational time. On the other hand new generation sensor networks allow higher resolution monitoring, which is necessary for advance airflow assessments in modern DCs (Yogendra & Pramod 2012). A minimum number of temperature nodes should represent the DC virtual environment. This number is directly related to the level of resolution, with larger numbers leading to more demanding computation. An optimal level of resolution and corresponding simulation approach need to be found in order to fulfil requirements of transient behaviour and relatively fast computational time on the one hand and on the other hand to reach level of resolution required by advance airflow assessments. High resolution models such as Computation Fluid Dynamics (CFD) models are commonly used for analysing the design of the DC space arrangement in academia as well as in practice. Numerous research studies cover high resolution modelling of DC airflows and heat transfer (Rambo & Joshi 2007). In fact, several specialized CFD software programs for DC are currently available in the market. However, high resolution models are solely used for design and mainly for steady-state simulation of few critical cases (Zelenský et al. 2014). This does not match DC operation requirements such as transient response or the lack of possibilities to integrate models of different domains (e.g. IT equipment, cooling or power supply). At the other side of the model resolution spectrum, there are modelling approaches that cover the overall complexity of DC systems from the chip to the cooling tower levels (Breen et al. 2010; Walsh et al. 2010; Pelley et al. 2009) based on approximate or empiric relationships and simplified models. These approaches are usually valid only for specific cases. Therefore this approach is not suitable for generic and scalable description of the virtual DC environment. Moreover, these models are not able to sufficiently represent the temperature distribution in the DC space, which is crucial for modern control strategies such as thermal-aware workload allocation (Tang et al. 2007).A transient white box modelling approach fulfils the requirements to create a virtual DC for testing of new operation strategies. This virtual DC environment should be a “stand alone” model with minimum needs for preliminary measurements. Building Energy Simulation (BES) tools, developed over the last 50 years, offer sophisticated computational engines for modelling building physics and building services systems. BES tools allow simulation of transient behaviours of Buildings and Heating, Ventilation, and Air-conditioning (HVAC) systems,
as well as advance systems such as on-site renewable energy systems. In addition to this, there is usually sufficient support for co-simulation or integration of user models (Clarke 2001; Hensen & Lamberts 2011).
Even though a BES approach satisfies most of the requirements mentioned above, BES tools have rarely been used for DCs. However, the interest in BES among DC designers and operators is experimenting recent growth. For instance, Phan and Lin investigated a multi-zone representation of DC with cold and hot aisle arrangement and Oro et al developed a decision-support tool for integration of advance renewable sources into data the centre structure (Phan & Lin 2014; Oró et al. 2015).
Although BES was found to be a suitable approach for testing and commissioning of novel control strategies, the typical level of resolution used, one temperature node per room (zone), is not sufficient for the DC case. This is due to the heterogeneous heat gains profile across the space and also to the sudden temperature fluctuations caused by rapid changes in IT equipment utilization. DC spaces need to be represented by several temperature nodes. A multi nodal method capable of represent the required level of detail needs to be investigated.
The potential of using BES for thermal evaluation of DC spaces is described by Phan and Lin’s research (Phan & Lin 2014), which represents one of the first studies linking both areas. However this method is only suitable for specific cases of DC space arrangements. Cases such as the ones with hot and cold aisle arrangement with containments. The containments mean that the space of hot and cold aisle are separated by a physical barrier without any mixing of hot and cold air in DC space. This paper proposes a novel Multi Nodal Airflow Network method, which is capable of representing DC general arrangements.
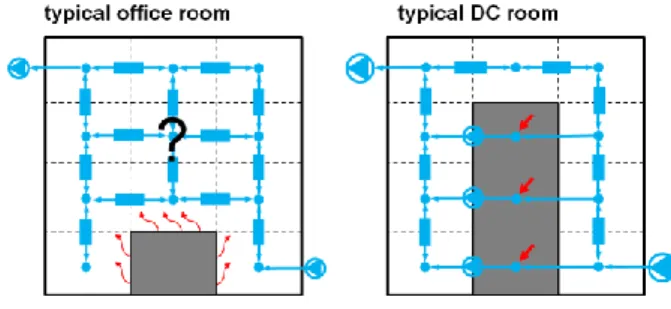
Fig. 3 Airflow network - office vs DC space Even though there have been attempts to use the airflow network method for multi-nodal office rooms in the past, those attempts concluded that the standard definition of air flow network is not able to fully covered the natural convection phenomena for multi-nodal level of resolution. Additional functionalities based on empirical data had to be added (Axley 2001; Wurtz et al. 1999). However, the
characteristics of a DC space differ quite considerably from those of typical office spaces. For instance, the typical office space have relatively small air change, up to 4 h-1 , and internal heat gains in the range of 5.4 to 21.5 W m-2 (Owen & Kennedy 2009), where heat transfer is mainly driven by natural convection with buoyancy effects, which are hardly calculated by standard air flow network definition at multi-nodal level of resolution.
Contrary to typical office spaces, the DC case can take advantage of the multi nodal airflow network approach. Computer Room Air Conditioning (CRAC) units ensure air change circa 10 times higher than in an office. Moreover heat dissipation from IT devices placed in racks across the whole DC space is 437-1615 W m-2 (Renaud & Mescall 2012) and needs to be mechanically ventilated from servers. Internal airflow is 190 - 290 kg hr-1 per kW of IT devices heat gain (Rasmussen 2005).
High air change and additional internal airflow through the racks allow to define many connections between nodes and to reach a relatively well defined airflow network across the DC space.
The initial assumptions for the DC case, illustrated in Fig. 3, are:
Strongly forced convection
The airflow pattern in DC space is strongly driven by forced convection from CRAC unit. Additionally, the airflow paths in the DC space are defined by the arrangement of the racks as well as the forced convection generated by the IT devices placed in these racks.
Irregular coarse spatial discretization
An irregular and very coarse discretization is adopted in order to reduce the number of unknown airflow paths for each computational node. The spatial discretization needs to be designed based on the specific DC space arrangement. Thus, unknown airflow paths can be estimated by the law of continuity and the buoyancy effect can be considered as negligible.
MULTI NODAL AIRFLOW NETWORK
METHOD FOR DC MODELING
The method can be divided into two parts: Airflow modelling and Energy modelling which are coupled together. Airflow modelling is carried out in CONTAM and the energy calculation in the TRNSYS environment.
The overall concept will be explained using a simplified example. Let’s imagine a DC with one row of racks. A section of the example DC is shown in Fig. 4 and Fig. 5. The assumption of negligible buoyancy effect leads to coarse irregular spatial discretization with respect of specific layout of DC. That means each node (zone) may have own size regarding specific geometry and arrangement of the
DC space. In example, a spatial discretization is simplified and uniform in order to highlight coarseness of the spatial discretization with typical volume of nodes at 1 m3 or more. In ideal case, at least two surfaces (e.g. external wall and internal surface of rack) should be assigned to each temperature node in order to avoid large number of unknown connections for airflow network calculation.
Second reason is to ensure influence of long wave radiation to air temperature node for energy modelling. Large temperature difference between surfaces is very characteristic for DC space and this phenomena needs to be involved into energy calculation
Airflow modelling
The airflow network is shown in the section presented in Fig. 4. If only this section is considered, the airflow network has enough defined connections by internal airflow through to IT devices and CRAC unit and all unknown airflows can be calculated just based on mass continuity formula.
Fig. 4 Airflow network of example DC If the airflow network is extended across the whole space, additional unknown connections are added and an iterative process is necessary. Each unknown connection between air nodes is defined by a power law with the same parameters.
𝑉̇𝑖→𝑗= 𝐶(∆𝑃𝑖→𝑗) 𝑛
(1)
Where 𝑉̇𝑖→𝑗 (𝑚3𝑠−1) is volumetric flow between
nodes, ∆𝑃𝑖→𝑗 (𝑝𝑎) is the pressure drop,
𝐶 (𝑚 𝑠−1𝑃𝑎−𝑛)is an empirical “permeability” constant
and 𝑛 is the power law exponent. The recommended setting for “free connection” is C = 0.83 and n = 0.5 (Axley 2001). By using equal parameters of power law for each connection, a forced airflow pattern driven by known airflows in the space is guaranteed. Regarding our preliminary assumptions that the airflow pattern is strongly forced and the buoyancy effect is negligible for the given spatial discretization, the airflow pattern is calculated for each step as isothermal. The ideal gas law is used for each node in the network
Where 𝑚𝑖 (𝑘𝑔) is the mass of the air in zone i, 𝑉𝑖(𝑚3)
volume of air zone i, 𝑃𝑖 (𝑝𝑎) pressure in zone i,
𝑇 (𝐾)~𝑐𝑜𝑛𝑠𝑡.zone temperature,
𝑅 = 287.005 (𝐽 𝑘𝑔−1𝐾−1) is the air gas constant
Mass continuity has to be valid. Thus, convergence criteria of the balance of airflows to or from each node must be zero
∑ 𝑚̇ = 0 (3)
Walton laid, in 1989, the foundations for the development of the Contam solver and airflow network analysis(Walton 1989). The recent update of the Contam tool was done in the year 2005,(Walton & Dols 2005).
To summarize, airflow networks for DCs provide an isothermal estimate of the airflow pattern in a DC space driven by internal airflows through IT devices, which are function of IT workload and CRAC airflow settings. This airflow pattern is used for the energy modelling.
Energy modelling
The temperature distribution across the DC space is influenced by several energy fluxes (Fig. 5). Different characteristics of heat transfer are indicated and energy flow map can be drawn for the example section. An interaction with ambient environment is primarily done by conduction through external walls (represented by red rectangles in Fig. 5).
Fig. 5 Heat flux network of example DC From airflow network calculation describe above, unknown airflows across the DC space are obtained and full picture of airflow pattern is available for convective heat transfer calculation in the space.(fan symbol in Fig. 5).
Significant heat dissipation from IT devices causes higher differences in surface temperatures between constructions of rack and external wall. the intensive effect of long wave radiation characterizes a DC space and has to be included (represented by thin waving arrows in Fig. 5).
Internal heat gain (thick straight arrow in Fig. 5) is applied to the rack nodes. These zones are being used by a large amount of IT devices. Therefore additional thermal mass (grounding symbol in Fig. 5) needs to be considered.
The fundamental heat balance for each node can be expressed mathematically in Eq.4. The most significant heat fluxes are mentioned. However the terms of the equation are slightly different for each node
𝐶𝑖
𝑑𝑡𝑖
𝑑𝜏 = 𝑄̇𝑖,𝑡𝑟𝑎𝑛𝑠+ 𝑄̇𝑖,𝑐𝑜𝑛𝑣+ 𝑄̇𝑖,𝐿𝐺𝑟𝑎𝑑+
+𝑄̇𝑖,𝑔𝑎𝑖𝑛+ 𝑄̇𝑖,𝑐𝑜𝑜𝑙+ ⋯ (4)
Where𝐶𝑖 (𝐽 𝐾−1) is the thermal capacitance of zone i,
𝑡𝑖 (°C) temperature of zone i.𝜏 (𝑠)is time. 𝑑𝑡𝑑𝜏𝑖 is the
derivation of zone temperature in time.
𝑄̇𝑖,𝑡𝑟𝑎𝑛𝑠(𝑊)is heat transfer through solid construction.
One of the main characteristics of heat transfer is conduction and this is calculated by the transfer function coefficient method (Delcroix et al. 2012).
𝑄̇𝑖,𝑐𝑜𝑛𝑣(𝑊) = 𝜌𝑉̇𝑗→𝑖𝑐𝑝,𝑎𝑖𝑟 ∆𝑡𝑗−𝑖 is the convective heat
flux from other zones. Where 𝑉̇𝑗→𝑖 is the product of
airflow network model.
𝑄̇𝑖,𝐿𝐺𝑟𝑎𝑑 (𝑊)is the influence of long wave radiation
between surfaces to zone temperature. This is calculated as standard Star network model (Seem 1987)
𝑄̇𝑖,𝑔𝑎𝑖𝑛(𝑊)~ 𝑃̇𝑤𝑙 is the internal heat gain for zone i. In
the DC case of a DC, a large majority of heat gain comes from heat dissipation from computational processes. Internal heat gain can be determined from the actual workload of IT devices. This heat flux is applicable only for the rack zones.
𝑄̇𝑖,𝑐𝑜𝑜𝑙(𝑊) = 𝜌𝑉̇𝐶𝑅𝐴𝐶𝑐𝑝,𝑎𝑖𝑟 ∆𝑡𝐶𝑅𝐴𝐶−𝑖 is heat flux from
cooling devices. Where 𝑉̇𝐶𝑅𝐴𝐶 and 𝑡𝐶𝑅𝐴𝐶 is settings of CRAC unit, 𝑡𝑖 is node of return air temperature. This heat flux is applicable only to zones that are influenced by the CRAC unit and is calculated by advance HVAC model. Additional heat fluxes can be taken into account according to current situations, (e.g. direct short-wave radiation comes through windows). However, the heat fluxes previously mentioned are most common for the DC case. Since IT workload and associated heat dissipation has a significant impact on the calculation of temperature distribution across the DC space, the following section discusses the IT workload representation in the model.
IT workload representation
The afore-mentioned model discretization is implemented for 1/3 of the rack (box). Seven typical servers can occupy this space. However if modern “blade servers” are considered, it can accommodate up to fourteen servers. To get impression of huge density of heat dissipation, IT workload directly proportional to heat dissipation allocated in box with size 1/3 of rack (volume roughly 1m3) may exceed up to 3kW! The typical value of heat density quantified for the whole rack is 1.9 – 3.2 kW/rack (up to 10 kW/rack)(Renaud & Mescall 2012). With such a heat gain, the servers need additional ventilation of racks. IT equipment requires between 100 and 160 cfm of
air per installed kW (190 - 290 kg hr-1 per kW)(Rasmussen 2005).
The nominal heat gain density is usually very diverse across the space and depends on the number and type of deployed IT equipment. Parameters such as nominal (Pwl,max) and idle (Pwl,min) power are specified for each box. Idle power is estimated as 20 30% of nominal power (Barroso & Hölzle 2009) and maximal airflow through rack zone is also derived from nominal power based on previous recommendations. The actual workload and associated heat dissipation can be approximated as a function of utilization u (-) (Barroso & Hölzle 2009; Pelley et al. 2009).
𝑄̇𝑖,𝑔𝑎𝑖𝑛~𝑃̇𝑤𝑙= (𝑃̇𝑤𝑙,𝑚𝑎𝑥− 𝑃̇𝑤𝑙,𝑚𝑖𝑛) ∙ 𝑢 + 𝑃̇𝑤𝑙,𝑚𝑖𝑛 (5)
The heat gain is attached to a specific zone in the energy model, where the box temperature (tbox) is calculated. As in reality, where server fans are controlled based on CPU temperature, the airflow through the box (𝑉̇𝑏𝑜𝑥) is a function of the box
temperature. This temperature is influenced not only by the actual workload but also by the inlet temperature (tin).
Fig. 6 Scheme of IT workload representation The heat gain is attached to a specific zone in the energy model, where the box temperature (tbox) is calculated. In this case a three-stage controller was used as control function. Three temperature ranges are set (<30˚C; 30 -55˚C; 55˚C<). Each temperature range is defined by a particular airflow (0.3 𝑉̇𝑏𝑜𝑥,𝑚𝑎𝑥;
0.7 𝑉̇𝑏𝑜𝑥,𝑚𝑎𝑥; 𝑉̇𝑏𝑜𝑥,𝑚𝑎𝑥)
To summarize, heat flux balances are calculated for each node using the BES method with coupling of the air flow network. The DC space is evaluated based on the Multi Nodal Airflow Network method for DC with respect of actual states of each IT box model and actual set points of CRAC unit and cooling capacity of overall cooling system.
The novel method allows transient calculation of temperature distribution across the DC space with reasonably computational time reaching adequate level of resolution for advance airflow assessments in DC space.
DC CASE STUDY
For validation purposes and further application, the virtual DC is a representation of a case study. The case study is a small DC located in Cork, Republic of Ireland. This DC is available to test the novel
model-based control platform within the framework of the wider project GENIC and will also be used as a case study for the development of the Virtual DC. The DC space is located inside the building and has no windows. The DC is not exposed to the external environment. Surrounding temperature of the DC space is 20-26˚C. The room has a floor area of 34.3 m2 and is equipped with two rows of eight racks with a total nominal power load of IT devices of 30kW. The IT devices placed on the racks are arranged into hot and cold aisles without any containments (see Fig. 7).The indoor climate of the DC is maintained at 18 - 27 ˚C with a relative humidity of 30-60% (recommended by ASHREA TC 9.9 Committee (ASHRAE TC 9.9 2011)). A CRAC unit ensures the required indoor climate. Supply air is distributed through a raised floor and goes to front side of IT devices through floor-performed tiles. Return air is drawn by the CRAC unit below the ceiling (Fig. 7). Circulating air is adjusted in the CRAC unit by a direct expansion system. A condenser coil of the direct expansion system is cooled by glycol and heat is rejected to ambient in a roof-mounted drycooler. In an emergency situation, secondary floor standing air conditioning (AC) unit placed in the room
Fig. 7 Schematic of hot and cold aisle arrangement without containments
Contrary to conventional controls, where return air temperature represents the overall room environment, advanced airflow assessment requires a higher resolution measurement of the room temperature. Wireless Sensor Network (WSN) allows the deployment of a large number of temperature sensors in the DC space which collect temperature array data in a real time. The WSN method gives a clear picture of the temperature distribution across the whole DC space. These data can then be used for closer cooperation between workload and thermal management in the DC.
In the case study, the temperature sensors were deployed at inlet and outlet sides of each rack at three different heights: bottom (0.35 m), middle (1.0 m) and top (1.65 m). In order to represent the average temperature in each zone, measured nodes were located out of direct influence of the air stream coming from the IT facilities. Other sets of temperature sensors were deployed for CRAC supply and return air (Scherer et al. 2014).
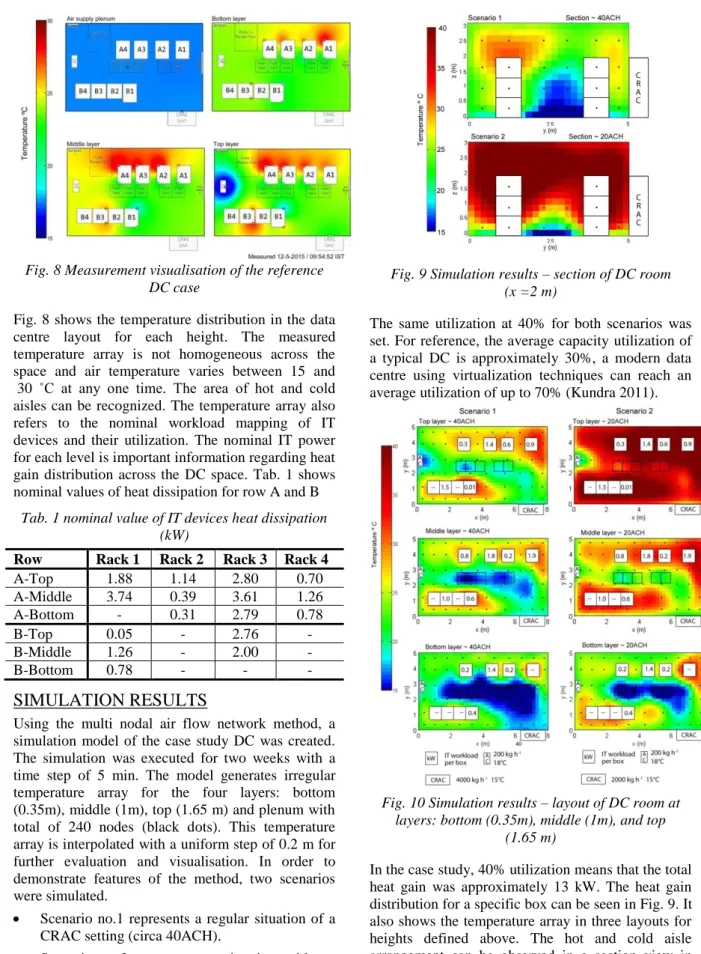
Fig. 8 Measurement visualisation of the reference DC case
Fig. 8 shows the temperature distribution in the data centre layout for each height. The measured temperature array is not homogeneous across the space and air temperature varies between 15 and 30 ˚C at any one time. The area of hot and cold aisles can be recognized. The temperature array also refers to the nominal workload mapping of IT devices and their utilization. The nominal IT power for each level is important information regarding heat gain distribution across the DC space. Tab. 1 shows nominal values of heat dissipation for row A and B
Tab. 1 nominal value of IT devices heat dissipation (kW)
Row Rack 1 Rack 2 Rack 3 Rack 4
A-Top 1.88 1.14 2.80 0.70 A-Middle 3.74 0.39 3.61 1.26 A-Bottom - 0.31 2.79 0.78 B-Top 0.05 - 2.76 - B-Middle 1.26 - 2.00 - B-Bottom 0.78 - - -
SIMULATION RESULTS
Using the multi nodal air flow network method, a simulation model of the case study DC was created. The simulation was executed for two weeks with a time step of 5 min. The model generates irregular temperature array for the four layers: bottom (0.35m), middle (1m), top (1.65 m) and plenum with total of 240 nodes (black dots). This temperature array is interpolated with a uniform step of 0.2 m for further evaluation and visualisation. In order to demonstrate features of the method, two scenarios were simulated.
Scenario no.1 represents a regular situation of a CRAC setting (circa 40ACH).
Scenario no.2 represents a situation with an insufficient amount of circulating air (circa 20ACH).
Fig. 9 Simulation results – section of DC room (x =2 m)
The same utilization at 40% for both scenarios was set. For reference, the average capacity utilization of a typical DC is approximately 30%, a modern data centre using virtualization techniques can reach an average utilization of up to 70% (Kundra 2011).
Fig. 10 Simulation results – layout of DC room at layers: bottom (0.35m), middle (1m), and top
(1.65 m)
In the case study, 40% utilization means that the total heat gain was approximately 13 kW. The heat gain distribution for a specific box can be seen in Fig. 9. It also shows the temperature array in three layouts for heights defined above. The hot and cold aisle arrangement can be observed in a section view in Fig. 10. The section view is at x- coordination = 2.5m. The presented results evaluate the influence of a heterogeneous gain distribution and CRAC unit settings on air temperature distribution. These two variables can be change during the simulation and thus to describe transient response of DC space.
DISCUSSION
Although the method is yet to be fully validated, the results are very promising. The main achievement of the study is reaching a relatively high resolution with no compromise of the virtual DC complexity. This higher resolution requires a shorter time step, and this is reflected in a longer simulation time compared to typical BES assessments. However simulation time is still sufficient for long-term evaluation and fast enough for control platform testing..
As mentioned above, the results primarily demonstrate features and resolution of a DC space model. With this method, transient evaluation data such as recirculation potential and hot spots in the DC space can be predicted.
Scenario no.1 which presented a regular operation is similar in temperature range as measurements shown above (Fig. 8). Since the utilization data and power metering are not available at this time, these two figures are not fully comparable.
Scenario no.2 demonstrates the crucial role of sufficient air changes in the DC space. This may represent an emergency situation in the DC. Reaching such a high temperature (above 40˚C) is not common in practice because IT devices would be automatically switched off in order to prevent any damage. Since safety shutdown has not been yet implemented in the IT devices models described in this paper, the scenario no.2 may be interpreted as temperature distribution right before the safety shutdown. The dynamic nature of the DC space representation is worth highlighting. The course of temperature distributions affected by the actual value of workload and related airflow through the rack zones and actual settings of CRAC unit without no limitation of representation of other models of virtual DC such as IT workload representation, HVAC model and Power Supply model.
All individual models will be encapsulated in the TRNSYS environment structure, which is one of the most commonly used BES tools. TRNSYS is relatively open for integration of user-defined components and allows co-simulation with many other external environments and utilities (e.g. Matlab, CONTAM) .The co-simulation ability is a very important feature in order to connect and test any advance control algorithm.
Of course, the level of resolution is much lower than high-resolution models and the multi-nodal airflow network method cannot be used for any detail “spot” analysis at one local point in a DC space. However the method can emulate sufficient numbers of measured nodes and evaluate overall temperature distribution across whole the DC space, which is necessary for modern DC airflow assessments. Ideally, if all parameters and measurements from a DC and its systems were available, we could find simplified empirical data-driven methods to describe the DC space and its systems. This model could be
directly used for a model-based control algorithm However, any data particularly measurements from a DC are highly confidential in practice and access to these data are usually denied. Moreover the data-driven model is valid only for the specific case. Another above mentioned drawback is that any test in a real DC is extremely limited, therefore these simplified data-driven models cannot be properly trained to cover the full operational range.
Thus the intention was to develop a “stand-alone” virtual DC, which is defined only based on commonly available technical documentation of a DC space. It will also emulate the general configuration of a DC space and its systems in order to train and test novel model-based control algorithms. After full validation testing, the multi-nodal airflow network method is intended to be one piece of the virtual DC.
CONCLUSION AND FUTURE WORK
This paper introduces the concept of virtual DC to support the testing and commissioning of a novel model-based energy management control algorithm. BES fulfils most of the requirements for the development of a virtual DC and is able to support not only the development of a novel operational platform but also its design. Based on the particular characteristics of DCs, BES appears to have potential for an accurate representation without the computational demand of CFD methods. BES tools allow us to represent multi-domain complex DC systems and describe the behaviour of individual DC devices.One of the main knowledge gaps is the representation of DC space. The typical level of resolution in BES is one node per room (zone). This is not sufficient to support modern DC airflow assessment. Heterogeneous temperature distribution calls for a higher level of resolution.
This paper presents and describes a novel Multi Nodal Airflow Network method. This method, which is valid only for strongly forced convection environments, offers sufficient resolution with no limitation to the virtual DC complexity. Although this method has not been fully validated, the results are very promising and in the expected range when compared against the temperature range from the measurements.
After finalizing the overall virtual DC development, surrogate data-driven models for real-time optimization will be identified. This model will be trained based on the virtual DC and integrated into a novel model based control platform developed in conjunction with the international project GENiC. In the near future this control platform will be connected to the virtual DC for its testing and tuning.
ACKNOWLEDGEMENT
This project has received funding from the European Union’s Seventh Framework Programme for research, technological development and demonstration under grant agreement no. 608826 More information about project GENiC (no. 608826) available http://projectgenic.eu/
REFERENCES
ASHRAE TC 9.9, 2011. 2011 Thermal Guidelines for Data Processing Environments – Expanded Data Center Classes and Usage Guidance. Data Processing, pp.1–45.
Axley, J.W., 2001. Surface-drag flow relations for zonal modeling. Building and Environment, 36(7), pp.843–850.
Barroso, L.A. & Hölzle, U., 2009. The Datacenter as a Computer: An Introduction to the Design of Warehouse-Scale Machines,
Breen, T.J. et al., 2010. From chip to cooling tower data center modeling: Part I Influence of server inlet temperature and temperature rise across cabinet. In Thermal and Thermomechanical Phenomena in Electronic Systems (ITherm), 2010 12th IEEE Intersociety Conference on. pp. 1–10.
Clarke, J., 2001. Energy simulation in building design 2nd ed., Glasgow: Butterworth Heinemann.
Delcroix, B. et al., 2012. Conduction transfer functions in TRNSYS multizone building model: current implementation, limitations and possible
improvements. Proceedings of SimBuild 2012: 5th conference of IBPSA-USA, pp.219–226.
Hensen, J.L.M. & Lamberts, R., 2011. Building performance simulation for design and operation Abingdon., Spon Press.
Kundra, V., 2011. Federal Cloud Computing Strategy, Masanet, E. & Koomey, J., 2013. “How green is the
Internet?” Summit. Available at:
https://www.google.com/events/howgreenistheintern et2013/.
Oró, E. et al., 2015. Energy efficiency and renewable energy integration in data centres. Strategies and modelling review. Renewable and Sustainable Energy Reviews, 42, pp.429–445.
Owen, M.S. & Kennedy, H.E., 2009. 2009 ASHRAE handbook: fundamentals, American Society of
Heating, Refrigeration, and Air-Conditioning Engineers.
Pelley, S. et al., 2009. Understanding and Abstracting Total Data Center Power. WEED Workshop on Energy Efficient Design.
Phan, L. & Lin, C.-X., 2014. A multi-zone building energy simulation of a data center model with hot and cold aisles. Energy and Buildings, 77, pp.364–376. PikeResearch, 2012. Green Data Centers,
Rambo, J. & Joshi, Y., 2007. Modeling of data center airflow and heat transfer: State of the art and future trends. Distributed and Parallel Databases, 21(2-3), pp.193–225.
Rasmussen, N., 2005. Guidelines for Specification of Data Center Power Density,
Renaud, B.V. & Mescall, M., 2012. Uptime Institute Annual Report : Data Center Density.
Seem, J.E., 1987. Modeling of heat transfer in buildings. University of Wisconsin Madison.
Scherer, T. et al., 2014. Deliverable D1.4 Sensor Network and Placement Specification & Process Outline, Available at: www.projectgenic.eu.
Tang, Q., Gupta, S.K.S. & Varsamopoulos, G., 2007. Thermal-aware task scheduling for data centers through minimizing heat recirculation. Proceedings - IEEE International Conference on Cluster Computing, ICCC, pp.129–138.
Walsh, E.J. et al., 2010. From chip to cooling tower data center modeling: Part II Influence of chip temperature control philosophy. In Thermal and Thermomechanical Phenomena in Electronic Systems (ITherm), 2010 12th IEEE Intersociety Conference on. pp. 1–7.
Walton, G.N., 1989. Airflow network models for element based building airflow modeling. ASHRAE Transactions, 95(2), pp.611–620.
Walton, G.N. & Dols, W.S., 2005. CONTAM user guide and program documentation.
Wurtz, E., Nataf, J.-M. & Winkelmann, F., 1999. Two- and three natural and mixed convection simulation using modular zonal models in buildings. Heat and Mass Tranfer, 42(923-940), p.18.
Yogendra, J. & Pramod, K., 2012. Energy Efficient Thermal Management of Data Centres J. Yogendra, ed., London: Springer.
Zelenský, P. et al., 2014. AIR-FLOW MODELLING IN DESIGN AND OPERATION OF DATA CENTERS. In IBPSA-CZ 2014.