Procedia Engineering 69 ( 2014 ) 1225 – 1231
1877-7058 © 2014 The Authors. Published by Elsevier Ltd.Open access under CC BY-NC-ND license. Selection and peer-review under responsibility of DAAAM International Vienna
doi: 10.1016/j.proeng.2014.03.113
ScienceDirect
24th DAAAM International Symposium on Intelligent Manufacturing and Automation, 2013
Using Cost-Time Profile for Value Stream Optimization
Danijela Gracanin
a,* , Borut Buchmeister
b, Bojan Lalic
aaUniversity of Novi Sad, Faculty of Technical Sciences,21000 Novi Sad, Serbia bUnversity of Maribor, Faculty of Mechanical Engineering, 2000 Maribor, Slovenia
Abstract
Value stream optimization is very important for lean manufacturing efforts. This paper introduces the framework for value stream optimization by combining value stream costing and cost-time profile. Value stream mapping represent very efficient tool for visualization of activities within production flow focused on activity duration with the purpose to eliminate non-value added activities. Besides shortening of lead time, cost reduction is also imperative for every company, so monitoring and control of manufacturing cost over the time can be driving force for improvement. Standard (traditional) accounting system, suitable for mass production, is focused on real cost of product calculation, how to allocate indirect manufacturing costs, excluding time dimension. Mass production era is over and new accounting systems are needed for modern manufacturing strategy, such as lean manufacturing. Lean accounting has been developed to support lean companies and avoid problems with traditional accounting system. Value stream costing is based on value stream and eliminate need for overhead allocation and calculation. Traditional accounting system is oriented to the product, but value stream costing analyze processes. On the other hand, cost-time profile is also powerful tool for visualization of cost accumulation during the time across entire production flow.
© 2014 The Authors. Published by Elsevier Ltd.
Selection and peer-review under responsibility of DAAAM International Vienna. Keywords: Value stream mapping; Value stream costing; Cost-time profile; Lean manufacturing
1.Introduction
The increasing intensity of competition in the global market, forcing manufacturers to develop production systems and processes that will provide more flexibility, competitiveness and high quality products and ensure reduction of production costs. At the same time, manufacturers have to pay more attention to product variety and customer value, because era of mass production is over. Production, including services, is one of the most important
* Corresponding author. Tel.: +381-21-485-2154; fax: +381-21-6-350-300.
E-mail address: [email protected]
© 2014 The Authors. Published by Elsevier Ltd. Open access under CC BY-NC-ND license. Selection and peer-review under responsibility of DAAAM International Vienna
elements for the social welfare and economic development and in comparison with other sectors, offers the greatest opportunities of employment and added value more than any other area [1]. Companies have to focus on reducing and eliminating waste through projects of continuous improvement in order to increase the effectiveness of production. Efficient production process coupled with high quality control has become essence for manufacturing companies to guarantee on-time delivery and meet customers' satisfaction [2].
Simultaneously with implementation of modern manufacturing approaches, companies have to change business procedures in general in order to be compatible with new manufacturing philosophy. Internal and external information are the most important resources in modern business environment, so collecting information in the right way and in real time is big challenge for companies. Collecting information from manufacturing processes is mainly adapted for mass production, and product cost is the crucial fact for management. But, in modern economy customer value is the priority, as well as measuring the cost of resources usage. Many companies are not able to identify and recognize complete value stream.
2.Value stream mapping and value stream costing
Lean manufacturing is comprehensive set of techniques for waste identification and its elimination in processes in order to increase system flexibility, effectiveness and reduce costs [3]. Taiichi Ohno, in his book "The Toyota Production System - Beyond Large-Scale Production" said that lean manufacturing is based on absolute waste elimination and the main goals are cost reduction and increasing of production system efficiency [4].
Implementation of lean management philosophy is based on company’s need to increase productivity, reduce cost,
increase flexibility, and create more customer value [5]. Many companies try to apply Toyota production system, but numerous initiatives are unsuccessful because traditional accounting system doesn’t provide adequate and timely
information [6].
Womack and Jones define value as capability provided to customer at the right time at an appropriate price, as defined in each case by the customer [7]. They also said that customer compares the value of money and the value they receive for the money. Modern companies have to know how customer defines value and improving of customer value can be very effective through defining, understanding, monitoring and improving the value stream [8]. Value stream mapping is a visual representation of the all activities – both value added and non-value added that are necessary to bring a product from raw material through manufacturing process to the customer and there are many value streams within the company [9].
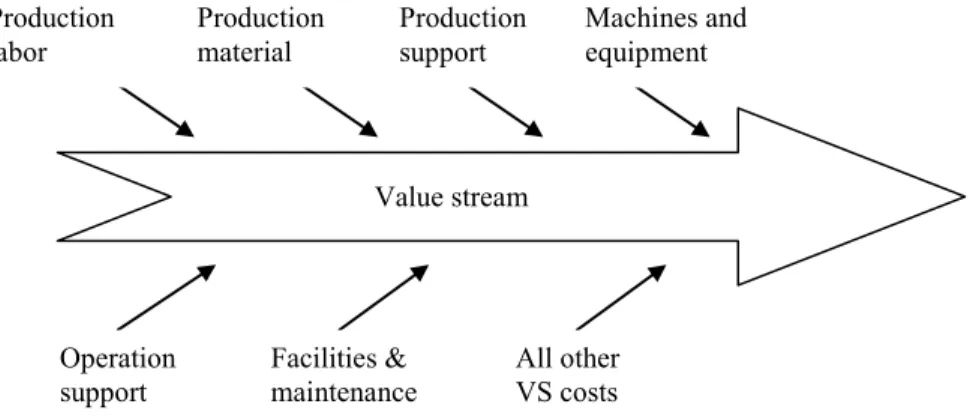
Fig. 1. Total value stream cost classification.
Traditional costing system and costing methods are not suitable for lean manufacturing, especially because
doesn’t evaluate the value chain and it is not possible to identify area for improvement of value creation [8]. In order to avoid potential conflicts with the lean implementation, companies are beginning to implement other accounting system such as activity based costing, target costing and lean accounting, and all of these systems are oriented to
Value stream Production labor Production material Production support Machines and equipment Operation support Facilities & maintenance All other VS costs
solving the problem of overhead allocation. For lean accounting, customer value is the guide, value stream is the core and waste elimination is the purpose and financial information is based on value stream [10]. Value stream costing is some kind of the bridge between operational and financial aspects of lean, which enhances the transfer of information from shop level to management level [11] and it is the process of assigning the actual cost of company to value stream, not to products or departments, and tends to provide bridge between operational and financial levels of lean, and thus enhance the transfer of information from shop level to management level [12]. Also, fulfils the needs of lean companies to focus on the value stream, provides usable value stream performance measurement, and eliminates need for overhead allocation and calculation [5]. Fig. 1 presents cost categories that are included in value stream [5].
Production labor involves all employees working in the value stream regardless of what kind of work performed (product design, maintenance, planning, sale, etc.). Production material costs are related to purchasing material for the value stream during the week. Support costs are related to spare parts and soft tooling, while the facilities costs are cost per square meters multiplied by the amount of square meters used by value stream, Differences between direct and indirect costs disappear when applied value stream costing and all costs within value stream become direct and costs outside of value stream map are not included.
Also, in order to gather information about costs in value stream, costs can be classified in appropriate cost pools (table 1)
[6]:
Table 1. Classification of cost pools.
Cost pool Description
Single process Fundamental cost object and include all cost that can be directly assigned to a single value stream process Group of processes Cost object that include more than one value stream process and consists all cost assigned to group of processes Value stream This cost object collect all costs that can be directly assigned to entire value stream Preconditions for successful implementation of value stream costing are: (1) results have to be reported by value stream, not by departments, (2) employees should be allocated to only one value stream (without overlapping), (3) sharing activities and services among value streams should be as minimal as possible and (4) production processes should be controlled and standardized with good control of exceptions [8]. But, Chiarini said that value stream accounting is difficult for implementation because it requires a particular value stream-based organization which is not standard organization type for companies [13].
3.Cost-time profile
In 1992, in his book "Profiles for Performance" Fooks was first introduced the concept of cost-time profile that is defined as a graphical representation the accumulation of cash during the time (days, weeks, months) across the entire business cycle – from negotiating an order and entering it, to pre-manufacturing design and information gathering processes through manufacturing, to shipment and receivables [14]. In other words, the cost-time profile is a graph that shows how much money was spent on the production of the product and how much time elapsed between the moments when the money back through the sale [15]. The foundation of Cost-Time profiling rests on the idea that any business activity can be viewed as an accumulation of cost over time [17].
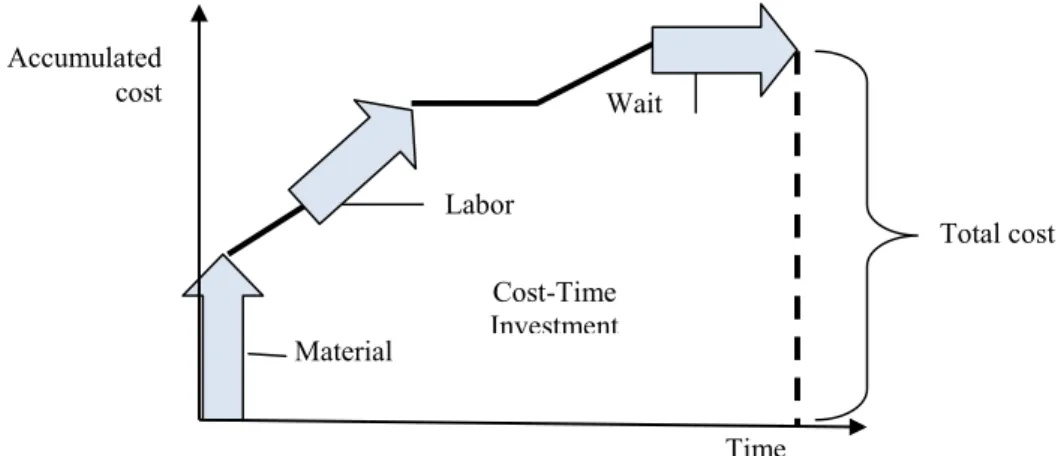
Cost-time profile requires information about process, cost and activities. Every Cost-time profile, regardless of the production process and its complexity, has three components (fig. 2): (1) material (including services and information), (2) labor and (3) wait [14]. Labor component could be named “activity”, because it refers to activity performing.
The material is represented as vertical line and indicates costs of purchased material, activities or labor costs are represented as ascending line with positive slope and waiting time is represented ad horizontal line without slope because there is no activity performing and additional costs. It this case wait component is only time - consuming, but when take into account storage costs and cost of days delay in product time- to- market, this line would probably
become ascending with a positive slope, but this discussion is out of scope of this paper. Cost – time investment is the area under the curve and that is the amount of cost spent in the product manufacturing multiplied by the time that product spent in system before sales.
Fig. 2. Components of cost-time profile. The following steps are generally used in creating cost-time profile [12]:
x constructing of flow diagram,
x gathering of cost data and improving flow diagram with cost information,
x developing of elapsed data and preparing Time-cycle chart and
x constructing of cost-time profile
4.Application of cost-time profile in real production process
Value stream map doesn’t contain information about costs as well as its accumulation during the product flow, but this is important information for quantification of results and money savings after applied improvements. Interaction between cost and time is very important because in combination determine the real cost of using money [14]. Product flow speed at the entire value stream is very important cost driver [10], so monitoring of costs accumulation over time in value stream can be a driving force for improvement. The value stream costing process begins with value stream map and value stream mapping process determinates material flow and how people, machine and space are use by value stream [12].
Table 2. Data about cost-time profile components.
Activity ID Cost rate (EUR/h) Material cost (EUR) Duration (min) Predecessors
A 12 200 10 B 15 100 11 A C 15 5 B Waiting 0 16 D 10 150 4 B E 10 120 12 A F 12 3 C,D Waiting 0 10 G 15 50 7 F H 15 150 11 E I 12 20 3 G,H Cost-Time Investment Wait Time Material Labor Accumulated cost Total cost
In order to properly build cost –time profile, some data has to be known [17]:
x Start/end time of each component (duration)
x Cost of each component, cost of every time unit of manufacturing process and
x Accumulated cost et every time unit
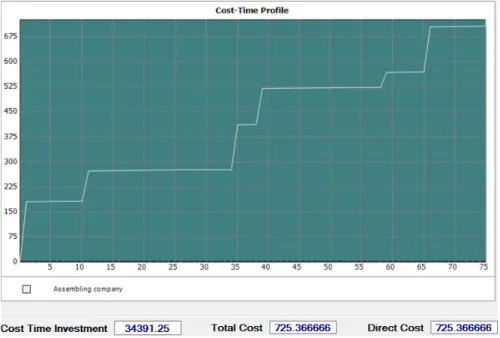
For this paper, data has been gathered from real company for assembling based on value stream map and value stream costing rules. Software used for calculation of total cost and cost-time investment is Cost-time Profiler, developed in 2006 by project team from Virginia Tech - Center for High Performance Manufacturing (CHPM).
Fig. 3. Cost-time profile diagram.
Fig. 3 shows cost-time diagram and area under the curve represent cost-time investment that should be reduced. Based on diagram analysis and calculated cost-time investment, framework for improvement is open and different measurements can be applied in order to optimize production flow and reduce cost. For example, first measure can be shortening the waiting time for 50%. Diagram and results are shown in fig. 4.
Shortening the waiting time for 50% has reduced area under the curve and cost-time investment has been decreased for 12%, which means that product will be ready for sale earlier and money will be returned faster. Total cost has not been changed.
Reducing material costs for 10% is the next measure that could be applied in this case (fig. 5) and results show that total cost and cost-time investment has been reduced for 10% .
Fig. 5. Cost-time profile diagram – material cost reduced for 10%.
When two different measures, shortening waiting time and material cost reduction, are combined in same time results are quite different (fig. 6). Cost time investment has been decreased for even 21% but total costs are the same as in the previous scenario.
5.Discussion and conclusion
The aim of this paper was to emphasize importance of relationship between money and time and provide framework for value stream optimization. Previous analysis of cost-time profiles with different parameter values for same value stream shows that every measure gives different results and savings (time or money). Which measure will be applied depends on defined company’s objective function before improvements have been started. Cost-time
profile isn’t completely new support tool for decision making, which will be only used, but could be useful for making choice among numerous different strategies. Value stream costing and cost-time profile tools, as well as lean accounting in general, have not been widespread and widely accepted yet by companies, so popularization and proving of their importance are still the big challenge. Modern companies should be value oriented and implement those manufacturing strategies that organize production in such way that creates more customer value. Value created for customer contributes to better results of the company.
Future research will be focused on fully integration of cost-time profile with value stream mapping and development of framework for implementation of appropriate measures in different scenarios.
Acknowledgement
Research presented in this paper was supported by Ministry of Science and Technological Development of Republic of Serbia, Grant TR-35050, Title: "Development of software to manage repair and installation of brake systems for rail vehicles", for the period 2011th-2014th year
References
[1] A. Skoogh, Automation of Input Data Management - Increasing efficiency in Simulation of Production Flows, PhD Thesis, Chalmers University of Technology, Sweden, 2011.
[2] G.Pan, D. Feng, M. Jiang, Application research of shortening delivery time through value stream mapping analysis, 17th International Conference on Industrial Engineering and Engineering Management (IE&EM 2010) 2010, pp. 733 – 736.
[3] L. Wilson, How to implement lean manufacturing, The McGraw-Hill Companies, Inc., 2010. [4] T. Ohno, Toyota production system – Beyond Lage-Scale Production, CRC Press, 1988.
[5] B. Maskell, F. Kennedy, Why do we need lean accounting and how does it works, The Journal of Corporate Accounting & Finance, March/April, 2007, pp. 59-73.
[6] T. Sobczyk, T. Koch, A Method for Measuring Operational and Financial Performance of a Production Value Stream, in IFIP International Federation for Information Processing, Volume 257, Lean Business Systems and Beyond, Tomasz Koch, ed.; (Boston: Springer), 2008, pp. 151–163.
[7] J. P. Womack, D.T. Jones , Lean Thinking: Banish Waste and Create Wealth in Your Corporation , Simon and Schuster Inc., 2003.
[8] J. Malta, P.F. Cunha, A new approach for cost modeling and performance evaluation within operations planning, CIRP Journal of Manufacturing Science and Technology, Vol. 4, 2011, pp. 234-242.
[9] T. Luyster, D. Tapping, Creating your future state, Productivity press, 2002.
[10] L. Wang, Y. Qingmin, Lean Accounting Based on Lean Production, Proceedings on International Conference on Management and Service Science - MASS 2009, pp. 1-4.
[11] X. Li, R. Sawhney, E. J. Arendt, K. Ramasamy, A comparative analysis of management accounting systems’ impact on lean implementation, International Journal of Technology Management, Vol. 57, No. 1 – 23, 2012, pp. 33-48.
[12] W. Salah, H. Zaki, Product Costing in Lean Manufacturing Organization, Research Journal of Finance and Accounting, Vol.4, No. 6, 2013, pp. 86-98.
[13] A. Chiarini, Lean production: mistakes and limitations of accounting systems inside the SME sector, Journal of Manufacturing Technology Management, Vol. 23 Iss: 5, 2012, pp.681 - 700.
[14] J.H. Fooks, Profiles for performance –Total Quality Methods for Reducing Cycle Time, Addison-Wesley Publishing Company, Inc., 1992. [15] L. Rivera, Inter-Enterprise Cost-Time Profiling, PhD Dissertation, Faculty of the Virginia Polytechnic Institute and State University, 2006. [16] G. Chaudhari, Cost-time profile as a tool in value engineering, Journal of Value world, Save internationa, Vol. 30, No. 1, 2007, pp. 1-8. [17] L. Rivera, F.F. Chen, Cost-Time profiling: Putting Monetary Measures onto Value Stream Maps, Annual Industrial Engineering Research