Explanation vs Performance in Data Mining:
A Case Study with Predicting Runaway Projects
Tim MENZIES1, Osamu MIZUNO2, Yasunari TAKAGI3, Tohru KIKUNO2
1Lane Department of Computer Science and Electrical Engineering, West Virginia University, Morgantown, USA; 2Graduate School
of Information Science and Technology, Osaka University, Osaka, Japan; 3Social Systems Business Group, OMRON Corporation,
Shiokoji Horikawa, Japan.
Email: [email protected], {o-mizuno, kikuno}@ist.osaka-u.ac.jp, [email protected] Received May 6th, 2009; revised July 7th, 2009; accepted July 14th, 2009.
ABSTRACT
Often, the explanatory power of a learned model must be traded off against model performance. In the case of predict-ing runaway software projects, we show that the twin goals of high performance and good explanatory power are achievable after applying a variety of data mining techniques (discrimination, feature subset selection, rule covering algorithms). This result is a new high water mark in predicting runaway projects. Measured in terms of precision, this new model is as good as can be expected for our data. Other methods might out-perform our result (e.g. by generating a smaller, more explainable model) but no other method could out-perform the precision of our learned model.
Keywords: Explanation, Data Mining, Runaway
1. Introduction
Every teacher knows that generating succinct tions means skipping over tedious details. Such explana-tions can be quickly communicated, but can miss the details needed to apply that knowledge in a real world setting.
An analogous situation occurs with data miners. All
data miners are performance systems; i.e. they can reach
conclusions about a test case. However, only some data
miners are explanation systems that offer a high-level
description of how the learned model functions.
The ability to explain how a conclusion was reached is
a very powerful tool for helping users to understand and accept the conclusions of a data miner. Despite this,
sometimes explanatory power must be decreased in order
to increase the efficacy of the predictor. For example,
previously Abe, Muzono, Takagi, et al. used a Näive
Bayes classifier to generate a predictor for runaway
software projects [1–3]. That model performs well but, as
shown below, cannot easily explain how it reaches its
conclusions.
This paper repairs the explainability of that prior result.
Using an iterative exploration of data mining techniques (cross-validation, different rule learners, discretization, feature subset selection), we found a particular combina-tion of methods that yielded succinct explanacombina-tions of how to predict for runaway software projects while
out-performing the Näive Bayes classifier. In hold-out experiments, this new model exhibited perfect precision;
i.e. precision = 1.0. Other methods might be able to
out-perform this new result (e.g. by finding a more suc-cinct and explainable model) but no other method could
be more precise (since 0 ≤precision ≤ 1).
The rest of this paper is structured as follows. First, the software runaway problem is defined and the explanation problems of prior results are discussed. Next, the general problem of explaining a learned model is explored using a range of data miners. And examples from the software
engineering literatures (in summary, the best performing
models may be very poor at explaining how those models
make their conclusions). A class of data miners called
rule learners will then be introduced and applied to our
data via various treatments (some combination of
discre-tizer, feature selector, and learner). The subsequent dis-cussion will review (a) related work; (b) the external va-lidity of these results; as well as (c) general principles of building explainable models via data mining.
2. Runaway Software
Requirements Estimation Planning Team Organi-zations
Management
R1 R2 R3 R4 R5 E1 E2 E3 E4 E5 P1 P2 P3 P4 P5 P6 O1 O2 O3 M1 M2 M3 class 0 0 0 0 0 2 3 3 2 0 2 0 0 0 0 0 2 1 0 0 0 0 ok 0 0 0 0 0 0 0 0 0 0 0 0 0 2 0 0 0 0 0 0 0 0 ok 0 0 0 0 3 0 0 2 3 0 0 0 0 0 2 0 0 0 0 0 0 0 ok 3 3 2 2 3 0 0 2 2 0 2 2 0 0 0 1 2 0 0 0 0 0 ok 0 0 0 0 2 0 0 0 0 0 0 2 0 2 2 0 0 0 0 0 2 0 ok 0 3 2 0 0 2 2 2 0 2 0 2 0 0 0 0 0 0 0 0 0 2 ok 0 0 2 3 2 0 0 0 0 0 0 2 0 3 0 0 0 0 0 0 0 0 ok 0 2 3 3 0 1 0 2 0 0 2 2 0 0 2 2 0 0 1 3 0 0 ok 0 2 0 2 3 0 0 0 0 0 2 2 0 2 2 0 0 0 0 0 0 2 ok 0 0 0 0 2 0 2 2 0 0 0 2 0 0 2 0 0 0 0 2 0 0 ok 0 3 3 2 0 0 0 3 3 0 0 0 0 0 0 0 0 0 2 0 0 0 ok 0 2 2 2 0 0 2 0 0 0 0 2 0 2 0 0 0 0 0 0 0 2 ok 0 2 0 2 0 0 0 0 0 0 2 3 3 0 2 2 2 2 0 2 2 1 ok 0 0 0 0 3 0 0 0 0 0 0 0 0 0 0 0 0 0 0 0 0 0 ok 0 2 2 2 2 0 2 2 0 0 0 0 0 0 0 0 3 2 0 3 0 0 ok 0 0 0 0 2 0 2 0 2 3 3 2 0 2 3 2 3 2 0 2 2 2 ok 0 0 0 0 0 0 2 0 0 0 2 2 2 3 2 2 0 0 0 2 2 0 ok 0 0 0 0 1 0 0 0 0 0 0 2 2 0 0 0 0 0 0 0 0 0 ok 0 0 0 0 3 0 0 0 0 0 0 0 0 0 0 0 0 0 0 0 0 0 ok 0 2 3 2 3 0 0 0 0 0 3 0 0 0 3 0 2 0 0 0 3 3 ok 0 2 2 0 0 0 0 0 0 0 0 0 0 0 0 0 0 0 0 0 0 0 ok 3 2 3 3 2 2 1 3 2 1 0 2 2 2 0 1 3 1 2 2 2 0 ok 2 2 0 2 3 0 0 2 3 0 2 0 2 2 3 2 0 0 0 0 2 3 runaway 2 2 3 3 3 2 2 3 2 3 3 3 3 2 3 2 3 3 0 2 2 2 runaway 3 2 0 0 3 0 0 0 0 0 3 0 0 3 3 0 0 0 0 0 0 0 runaway 0 2 3 2 2 3 0 2 2 1 0 2 0 0 2 2 0 2 2 2 0 2 runaway 0 2 2 2 2 0 3 2 3 3 0 2 2 0 0 2 2 2 0 0 0 0 runaway 2 3 3 2 2 0 0 3 3 2 3 0 3 0 2 3 2 0 2 0 2 2 runaway 3 2 3 2 0 3 2 2 2 0 0 2 2 2 3 0 2 0 2 0 3 3 runaway 2 2 3 3 2 0 0 2 0 2 2 2 2 2 2 0 3 0 2 0 2 0 runaway 0 0 0 0 0 0 0 0 0 0 3 3 3 3 3 3 3 3 0 0 3 3 runaway 2 3 3 3 2 2 3 3 3 3 3 3 3 2 3 3 3 3 2 3 3 0 runaway
Figure 1. Data used in this study, collected using the methods. For an explanation of the columns features, seeFigure 2 [1] Requirements features relate to the understanding and commitment of the requirements among the project members
R1: Ambigious requirements
R2: Insufficient explanation of the requirements R3: Misunderstanding of the requirements
R4: Lack of commitment regarding requirements between the customer and the project members; R5: Frequent requirement changes
Estimation features relate to the technical methods for carrying out the estimation, and the commitment between project members and customers: E1: Insufficient awareness of the importance of the estimation;
E2: Insufficient skills or knowledge of the estimation method; E3: Insufficient estimation of the implicit requirements; E4: Insufficient estimation of the technical issues; E5: Lack of stake holders’ commitment of estimation.
Planning features relate to the planning or scheduling activity and the commitment to the project plan among project members: P1: Lack of management review for the project plan;
P2: Lack of assignment of responsibility; P3: Lack of breakdown of the work products; P4: Unspecified project review milestones;
P5: Insufficient planning of project monitoring and controlling; P6: Lack of project members’ commitment for the project plan.
Team organization features relate to the state of the projects; e.g. the fundamental skills or experience and morale of project members: O1: Lack of skills and experience;
O2 ]: Insufficient allocation of resources; O3 ]: Low morale.
Project management factors about management activities:
M1: Project manager lack of resource management throughout a project; M2: Inadequate project monitoring and controlling;
M3: Lack of data needed to keep objective track of a project.
Many software projects suffer from runaways:
In 2001, the Standish group reported that 53% of
U.S. software projects ran over 189% of the original es-timate [5]. This 189% is not the 200% required by Glass’ definition, but it is close enough and large enough to be alarming.
Figure 1 shows data from 31 real-world projects, 10
of which (32%) are classified as “runaway”. Figure 1 was collected by [1–3] as follows:
Questions covering the various aspects of software
development (see Figure 2) areas were delivered to de-velopment companies and collected one month later. These projects are actual industrial software development projects of embedded systems in the period 1996 to 1998.
The questions were distributed to the project
man-agers or project leaders of various target projects. The detail and purpose of the questionnaire was explained. Answers were coded strongly agree, Agree, Neither agree nor disagree, and Disagree as 3, 2, 1, and 0, respec-tively.
All of these projects had completed their
develop-ment. As a result, some of the projects could be classified
as “runaways”. Takagi et al. took care to ensure that all
developers held a consensus view that some prior project had been a runaway. Also, to be classified as a runaway, the researchers used other objective measures such as cost and duration.
Using manual methods, Takagi et al. [1] found four
features from Figure 3 (e3,e5,p3,p5) that seemed
prom-ising predictors for runaways. The coefficients of those terms (found via logistic regression) were combined as follows:
5 222 . 2 3 228 . 1 3 964 . 0
5 577 . 1 3 834 . 8 ) 5 , 3 , 5 , 3 (
p p
p
e e
p p e e X
X X
e e X runaway P
1 ) |
( (1)
Unlike prior results [4,6,7], this model is operational;
it is possible to precisely characterize the strengths and weaknesses of its performance:
For high and low values of P(runaway|X), Equation
1 is a perfect predictor for runaways in Figure 1. No
pro-ject with P ≤ 0.03 is a “runaway” and no project with P ≥
0.81 is “ok”. This is the majority (2233=67%) of the data in
Figure 1.
In the minority case (1133 ), P is mid-range
(0.03<P(runaway|X)<0.81) and Equation 1 yields
incor-rect predictions in 11 rows. 4
While an important result, Equation 1 has several
drawbacks:
Not automatic: Equation 1 was created after a
man-ual inspection of the data by a team of skilled mathema-ticians. Such a manual analysis is hard to reproduce or apply to a new data set. Subsequent work by Abe, Takagi,
et al. [2] automated the method with a Näive Bayes
clas-sifier, but this compromised the explainability of the
pre-dictive model (see below).
Only explores one subset: Takagi et al. did not
compare the feature subset {e3,e5,p3,p5} with other
fea-ture subsets. Hence, while they showed that this subset
was useful, they did not demonstrate that it was the most
useful subset.
Ambiguous: At low and high P values, Equation 1
sends a clear signal about what is, and is not, a
poten-tially runaway project. However, at middle-range P
val-ues, Equation 1’s conclusions are ambiguous and, hence, hard to explain.
3. The Explanation Problem
Learning explainable models is harder than it may appear.
This section offers examples where learned models
per-form well, but explain themselves poorly.
3.1 Learning Latent Features
Numerous data mining methods check if the available features can be combined in useful ways. In this way,
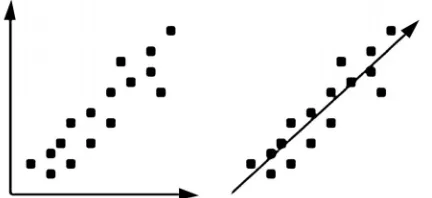
latent features within a data set can be discovered. For example, principal components analysis (PCA) [8] has been widely applied to resolve problems with struc-tural code measurements; e.g. [9]. PCA identifies the distinct orthogonal sources of variation in data sets, while mapping the raw features onto a set of uncorrelated fea-tures that represent essentially the same information contained in the original data. For example, the data shown in two dimensions of Figure 3 (left-hand-side) could be approximated in a single latent feature (right- hand-side).
Since PCA combines many features into fewer latent features, the structure of PCA-based models may be very simple. For example, previously [10], we have used PCA and a decision tree learner to find the following predictor for defective software modules:
[image:3.595.317.533.591.690.2]if domain1 ≤ 0.180
then NoDefects
else if domain1 > 0.180
then if domain1 ≤ 0.371 then NoDefects
else if domain1 > 0.371 then Defects
Here, “domain1” is one of the latent features found by
PCA. This tree seems very simple, yet is very hard to
explain to business clients users since “domain1” is
cal-culated using a very complex weighted sum (in this sum,
v(g),ev(g),iv(g) are McCabe or Halstead static code
met-rics [11,12] or variants on line counts):
domain1= 0.241*loc+0.236*v(g)
+0.222*ev(g)+0.236*iv(g)+0.241*n
+0.238*v0.086*l+0.199*d
+0.216*i+0.225*e+0.236*b+0.221*t
+0.241*lOCode+0.179*lOComment
+0.221*lOBlank+0.158*lOCodeAndComment
+0.163*uniqOp+0.234*uniqOpnd
+0.241*totalOp+0.241*totalOpnd
+0.236*branchCount
(2) As we shall see below, other learners can yield effec-tive models that are simpler to explain without using complex latent features.
3.2 Ensemble Learning
Data mining for SE means summarizing the complex behavior of a group of developers struggling to build intricate artifacts. Data mining over such complex
multi-dimensional data often requires fusing together the
results from multiple learners [13]. Such ensembles may
perform well but, as we shall see, are hard to explain. In basic ensemble method (BEM), l learners are run on various subsets of the available data. These learners use
EQ x\s\do5(j)(r\,s) that returns the probability of the
target classes s. BEM returns the mean probability:
11 ˆBEM l j ,
j
x x r s
l
(3)The linear generalized ensemble method (GEM)
re-turns a weighted sum of the conclusions of each learner x
in the ensemble.
1
,
l j j GEM
j
x a a x
r s (4)
where αj is the normalized performance score of xj on the
training data (so learners that performed the worst, con-tribute the least).
For some data sets, the combination rule is non-linear
and complex. For example, Toh et al. [13]’s variant of
Equation 4 uses a Jacobian matrix for x with different
coefficients for each feature ri∈r and target class sm∈s.
These coefficients are learned via multivariate
polyno-mial regression. Toh et al. report that their resulting
en-semble performs better than simpler schemes. However,
it may be harder to explain the ensemble since that
ex-planation must cover:
The learning methods used to generate xj;
The combination rule that computes x; and
The regression method used to tune the coefficients
used in the combination method.
Such an explanation is not required if the users are willing to accept the conclusions of the learner, without explanation. However, for data sets as small Figure 1, it seems reasonable to expect that a simple explanation of runaway projects should be possible. Also, if managers are to use the results of the learner as part of their delib-erations, they need some succinct structures that they can reflect over.
3.3 Näive Bayes Classifiers
It is hardly surprising that complex latent features (e.g. Equation 2) or intricate combinations of multiple learners (e.g. Equation 4) are hard to explain. What is surprising is how hard it is to explain the results of even a single, supposedly simple, learner. For example, this section offers a complete description of how a Näive Bayes clas-sifiers makes its conclusions. The reader is asked to con-sider how many users would understand this description (in our experience, we have yet to meet a single one).
A Näive Bayes classifier [14] is based on Bayes’
Theorem. Informally, the theorem says next=old*new i.e.
what we’ll believe next comes from how new evidence
effects old beliefs. More formally:
P(H|E)= PP((HE))
i
P(Ei|H) (5)
i.e. given fragments of evidence Ei and a prior
prob-ability for a class P(H), the theorem lets us calculate a
posterior probability P(H|E).
When building predictors for runaways, the posterior
probability of each hypothesis class (H∈{“ok” or
“run-away”}) is calculated, given the features extracted from a project such “ambiguous requirements” or “low morale” or any other of the features shown in Figure 2. The
clas-sification is the hypothesis H with the highest posterior P
(H|E).
phisticated schemes (e.g. see Table 1 in [15]).
Equation 5 offers a simple method for handling miss-ing values. Generatmiss-ing a posterior probability means of tuning a prior probability to new evidence. If that evi-dence is missing, then no tuning is needed. In this case
Equation 5 sets P(Ei|H)=1 which, in effect, makes no
change to P(H).
When estimating the prior probability of hypothesis H,
it is common practice [16] to use an M-estimate as
fol-lows. Given that the total number of hypothesis is C, the
total number of training instances is I, and N(H) is the
frequency the hypothesis H within I, then
C m I
m H N H P
( )
)
( (6)
Here m is a small non-zero constant (often, m=1).
Three special cases of Equation 6 are:
For high frequency hypothesis in large training sets,
N(H) and I are much larger than m and m·C, so Equation
6 simplifies to P(H)= N(IH), as one might expect.
For low frequency classes in large training sets,
N(H) is small, I is large, and the prior probability for a
rare class is never less than 1I; i.e. the inverse of the
number of instances. If this were not true, rare classes would never appear in predictions.
For very small data sets, I is small and N(H) is even
smaller. In this case, Equation 6 approaches the inverse
of the number of classes; i.e. C1. This is a useful
ap-proximation when learning from very small data sets when all the data relating to a certain class has not yet been seen.
The prior probability calculated in Equation 6 is a
useful lower bound for P(Ei|H). If some value v is seen
N(f=v|H) times in feature f ’s observations for hypothesis
H, then
P(Ei|H)= N(f=vN|H(H)+)+l lP(H) (7)
Here, l is the L-estimate and is set to a small constant
(Yang &Webb [16] recommend l=2). Two special cases
of are:
A common situation is when there are many
exam-ples of an hypothesis and numerous observations have
been made for a particular value. In that situation, N(H)
and N(f=v|H) are large and Equation 7 approaches
N(f=v|H)
N(H) , as one might expect.
In the case of very little evidence for a rare
hy-pothesis, N(f=v|H) and N(H) are small and Equation 7
approaches l·P(lH); i.e. the default frequency of an
ob-servation in a hypothesis is a fraction of the probability
of that hypothesis. This is a useful approximation when very little data is available.
For numeric features it is common practice for Näive Bayes classifiers to use the Gaussian probability density function [17]:
22 2
1 2
x
g x e
(8)
where {μ,σ} are the feature’s {mean, standard deviation},
respectively. To be precise, the probability of a
continu-ous feature having exactly the value x is zero, but the
probability that it lies within a small region, say x ± ε/2,
is ε×g(x). Since ε is a constant that weighs across all
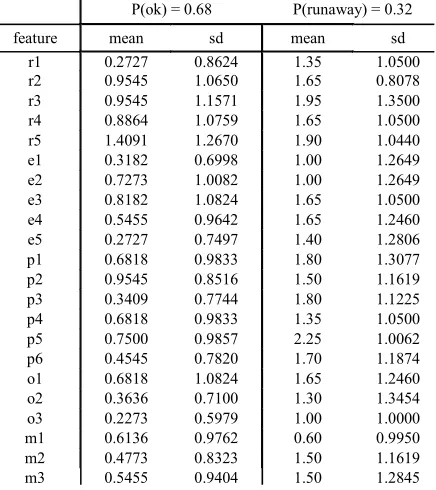
pos-sibilities, it cancels out and needs not be computed. Näive Bayes classifiers are frustrating tools in the data mining arsenal. They exhibit excellent performance, but offer few clues about the structure of their models. The means and standard deviations for Figure 1 are shown in Figure 44. Note that this figure is an incomplete charac-terization of Figure 1. For example, row 1 of Figure 4
suggests that r1 (“ambiguous requirements”) for “ok” is
a Gaussian distribution with a mean of 0.27 and a stan-dard deviation of 0.86. A visual inspection of column one values for “ok” projects in Figure 1 shows that this is not
true: r1 is usually zero except in two cases where it takes
the value of three.
One method of handling non-Gaussians like P(r1=X|ok)
is Johns and Langley’s kernel estimation technique [18].
This technique approximates a continuous distribution
sampled by n observations as the sum
of multiple Gaussians with means of multiple Gaussians with means
ob ob1, 2,...,obn
ob ob1, 2,...,obn
and standard deviationP(ok) = 0.68 P(runaway) = 0.32 feature mean sd mean sd
[image:5.595.314.532.463.708.2]r1 0.2727 0.8624 1.35 1.0500 r2 0.9545 1.0650 1.65 0.8078 r3 0.9545 1.1571 1.95 1.3500 r4 0.8864 1.0759 1.65 1.0500 r5 1.4091 1.2670 1.90 1.0440 e1 0.3182 0.6998 1.00 1.2649 e2 0.7273 1.0082 1.00 1.2649 e3 0.8182 1.0824 1.65 1.0500 e4 0.5455 0.9642 1.65 1.2460 e5 0.2727 0.7497 1.40 1.2806 p1 0.6818 0.9833 1.80 1.3077 p2 0.9545 0.8516 1.50 1.1619 p3 0.3409 0.7744 1.80 1.1225 p4 0.6818 0.9833 1.35 1.0500 p5 0.7500 0.9857 2.25 1.0062 p6 0.4545 0.7820 1.70 1.1874 o1 0.6818 1.0824 1.65 1.2460 o2 0.3636 0.7100 1.30 1.3454 o3 0.2273 0.5979 1.00 1.0000 m1 0.6136 0.9762 0.60 0.9950 m2 0.4773 0.8323 1.50 1.1619 m3 0.5455 0.9404 1.50 1.2845
1
n
In this approach, to create a highly skew
dis-tribution like P(r1=X|ok), multiple Gaussians would be
added together at r1=0. Conclusions are made by asking
all the Gaussians which class they believe is most likely.
3.4 Näive Bayes and Software Engineering
NäiveBayes classifiers are widely used in the SE litera-ture for several reasons. NäiveBayes classifiers summa-rize the training data in one frequency table per class. Hence, they consume very little memory and can quickly modify their knowledge by incrementing the frequency count of feature ranges seen in new training examples. Also, many studies (e.g. [15,19,20]) report that Näive Bayes exhibit excellent performance compared to other learners.
For example, recently Menzies, Greenwald & Frank [21] have built predictors for software detectors using a Näive Bayes classifier and two explanation systems- the OneR rule learner and the J4.8 decision tree learner. In
that study, the learner with the worst explanation power
(Näive Bayes) had the best performance, by far. For the
data sets explored by Menzies, Greenwald & Frank, the median advantage of Näive Bayes, the C4.5 decision tree learner [22], and the OneR rule learner [23] over the other learners was 52.4%, 0%,-16.7%, respectively (see Figure 5). On analysis, Menzies, Greenwald & Frank concluded that Näive Bayes worked so well because of the the product calculation of Equation 5. They reasoned as follows. Many static code features have similar infor-mation content. Hence, minor changes in how the train-ing data was sampled yielded different “best” features for predicting defects. The best predictions come from mathematical methods like Näive Bayes that accumulate the signal from many code features (using Equation 5’s product rule). Decision tree learners like C4.5 and rule
method median
oneR -16.7 -100% 100%
j48 0.0 -100% 100%
Näive
[image:6.595.57.287.517.635.2]Bayes 52.4 -100% 100%
Figure 5. Quartile charts from Menzies, Greenwald & Frank [21]. The charts show the differences when learners were applied to the same the training and test data
Performance was measured using recall; i.e. the percent of the defec-tive modules found by the learners. The the upper and lower quartiles are marked with black lines. The median is marked with a black dot. Vertical bars are added to mark (i) the zero point and (ii) the minimum possible value and (iii) the maximum possible value. The median per-formance of Näive Bayes was much higher than the other methods.
learners like OneR, on the other hand, do not perform well in this domain since they assume hard and fast boundaries between what is defective and what is not.
In summary, when mining software engineering data, there are many reasons to start with a Näive Bayes
clas-sifier. Abe, Muzono, Takagi, et al. [2] used such
classifi-ers to extend their prior work on runaway software
pro-jects [1,3]. However, this classifier was only a
perform-ance system. not an explanation system, so it could not offer insights into, say, how to best change a software project in order to avoid runaways. As shown above, Näive Bayes classifiers do not generate such succinct generalizations. This is a problem since what developers really want to know is what should be done to avoid runaway status.
3.5 Discussion of the Explanation Problem
As the mathematics gets more elaborate, it becomes harder to explain a Näive Bayes classifier to a typical business user:
Many users are not trained mathematicians. Hence,
they may be confused by Equation 5, Equation 6, Equa-tion 7 and EquaEqua-tion 8.
Presenting the internal statistics (e.g. Figure 4) is
uninformative, at least for the business users we have worked with.
The problem is compounded if the data is
non-Gaussian (like Figure 1) since this requires explain-ing kernel estimation.
Worse, a standard Näive Bayes classifier (with our
without kernel estimation) can not answer business-level questions such as “what minimal changes should be make to most decrease the odds of runaway projects?”
To be fair, Näive Baye’s explanation problems are seen in other kinds of data miners:
The problems with PCA and ensemble-based
learn-ers were discussed above.
Tree learners such as C4.5 [22] or CART [24]
exe-cute in local top-down search, with no memory between different branches. Hence, the same concept can be need-lessly repeated many times within the tree. Such trees can be cumbersome, needlessly large, and difficult to understand.
Clustering algorithms [25] and nearest neighbor
methods [26,27] do not condense their working memory into succinct descriptions. Rather, inferences on new information are made by a query over all the old infor-mation.
Simulated annealers [28] learn constraints to an
in-put space that results in higher values in the outin-put space. However, there is no generalization or summarization in a simulated annealer such as which subset of the input space is most important to control.
Neural networks store their knowledge as weights
location so it is impossible to inspect, say, all the infor-mation about one idea at one location in a network [29].
The problem of explaining the performance of these learners to end-users has been explored extensively in the literature (see the review in [30]). Often, some
post-processor is used to convert an opaque model into a more understandable form:
Towell and Shavlik generate refined rules from the
internal data structures of a neural network [29].
Quinlan implemented a post-processor to C4.5 called
C45 rules that generates succinct rules from cumbersome decision tree branches via (a) a greedy pruning algorithm followed by (b) duplicate removal then (c) exploring sub-sets of the rules relating to the same class [22].
TARZAN was another post-processor to C4.5 that
searched for the smallest number of decisions in decision tree branches that (a) pruned the most branches to unde-sired outcomes while (b) retaining branches leading to desired outcomes [31].
4. Learning Methods
4.1 Rule Learners
Rather than patch an opaque learner with a post-proces-sor, it may be better to build learners than directly gener-ate succinct high-level descriptions of a domain. For
example, RIPPER [32] is one of the fastest rule learners
known in the literature. The generated rules are of the
form conditionconclusion:
1 1 2 2 ...
conclusion condition
Feature Value Feature Value Class
The rules generated by RIPPER perform as well as C45rules, yet are much smaller and easier to read [32].
Rule learners like RIPPER and PRISM [33] generate small, easier to understand, symbolic representations of the patterns in a data set. PRISM is a less sophisticated learner than RIPPER and is not widely used. It was ini-tially added to this study to generate a lower bound on the possible performance. However, as we shall see, it proved surprisingly effective.
1. Find the majority class C
2. Create a R with an empty condition that predicts for class C. 3. Until R is perfect (or there are no more features) do
(a) For each feature F not mentioned in R
• For each value vF, consider adding F=v to the condition of R (b) Select F and v to maximize pt where t is total number of
exam-ples of class C and p is the number of examples of class C se-lected by F=v. Break ties by choosing the condition with the largest p.
(c) Add F=v to R 4. Print R
5. Remove the examples covered by R. 6. If there are examples left, loop back to (1)
Figure 6. PRISM pseudo-code
Like RIPPER, PRISM is a covering algorithm that
runs over the data in multiple passes. As shown in the pseudo-code of Figure 6, PRISM learns one rule at each
pass for the majority class (e.g. in Figure 6, at pass 1, the
majority class is ok). All the examples that satisfy the
condition are marked as covered and removed from the
data set. PRISM then recurses on the remaining data.
The output of PRISM is an ordered decision list of
rules where rulej is only tested if all conditions in rulei<j
fail. PRISM returns the conclusion of the first rule with a satisfied condition.
One way to visualize a covering algorithm is to imag-ine the data as a table on a piece of paper. If there exists a clear pattern between the features and the class, define that pattern as a rule and cross out all the rows covered by that rule. As covering recursively explores the re-maining data, it keeps splitting the data into:
What is easiest to explain, and
Any remaining ambiguity that requires a more
de-tailed analysis.
PRISM is a näive covering algorithm and has
prob-lems with residuals and over-fitting. If there are rows
with similar patterns and similar frequencies occur in different classes, then:
These residual rows are the last to be removed for
each class;
So the same rule can be generated for different
classes.
In over-fitting, a learner fixates on spurious signals that do not predict for the target class. PRISM’s over-fitting arises from part 3.a of Figure 6 where the algorithm loops through all features. If some feature is poorly measured, it might be noisy (contains spurious signals). Ideally, a rule learner knows how to skip over noisy features.
RIPPER addresses residuals and over-fitting problem
three techniques: pruning, description length and rule-set
optimization for a full description of these techniques, see [34]. In summary:
Pruning: After building a rule, RIPPER performs a
back-select to see what parts of a condition can be
de-leted, without degrading the performance of the rule.
Similarly, after building a set of rules, RIPPER performs
a back-select to see what rules can be deleted, without
degrading the performance of the rule set. These back-selects remove features/rules that add little to the overall performance. For example, back pruning could remove the residual rules.
Description length: The learned rules are built
while minimizing their description length. This is an
in-formation theoretic measure computed from the size of the learned rules, as well as the rule errors. If a rule set is over-fitted, the error rate increases, the description length grows, and RIPPER applies a rule set pruning operator.
Rule set optimization tries replacing rules straw-
4.2 Performance Measures
Our results are presented in terms of the following per-formance measures. Suppose we have some historical log, like Figure 1 that can comment on the correct classifica-tion of each row. By comparing the historical log with the output of the learner, we can define several measures
of success. Let {A,B,C,D} denote the true negatives, false
negatives, false positives, and true positives (respectively) found by a binary detector (binary detectors work on data
sets with two classes, like Figure 1). A,B,C,D can be
combined in many ways. For example, accuracy (or acc)
is the percentage of true positives (D) and negatives (A)
found by the detector.
acc=accuracy=(A+D)/(A+B+C+D) (9)
Also, recall (or pd) comments on how much of the
target was found.
pd=recall=D/(B+D) (10)
Precision (or prec) comments on how many of the
in-stances that triggered the detector actually containing the target concept.
prec=precision=D/(D+C) (11)
The f-measure is the harmonic mean of precision and
recall. It has the property that if either precision or recall
is low, then the f-measure is decreased. The f measure is
useful for dual assessments that include both precision
and recall.
2 prec pd
f measure
prec pd
(12)
All these measures fall in the range 0≤ {pd,prec,f,acc}
≤1. Also, the larger these values, the better the model.
4.3 Experiments with the Learning Methods
Various combinations of the learning method described above were applied to Figure 1. The results are shown in
Figure 7. In all 13 treatments where applied to Figure 1.
Each treatment is some combination of a data filter, a
learner, and a assessment method. This section discusses how each treatment was designed using results from the proceeding treatments.
Before moving on, we call attention to the accuracy
results of Figure 7. Observe how accuracy can be a
markably insensitive performance measure; i.e. it re-mained roughly constant, despite large changes in recall and precision. This result has been seen in many other data sets [21,35]. Hence, accuracy is deprecated by this paper.
4.3.1 Cross-Validation
Treatment a is a simple application of RIPPER to Figure
1. The learned theory was applied back on the training data used to generate it; i.e. all of Figure 1. As shown
bins learner #features #tests
a n/a ripper 22 1
b n/a ripper 22 10
c n/a nb 22 10
d 3 ripper 22 10
e 3 nb 22 10
f 3 prism 22 10
[image:8.595.327.517.84.468.2]g 3 ripper 1 (r1) 10 h 3 ripper 2 (r1 + p5) 10 i 3 bayes 1 (r1) 10 j 3 bayes 2 (r1 + p5) 10 k 3 prism 1 (r1) 10 l 3 prism 2 (r1 + p6) 10 m 3 prism 3 (r1 + p6 + o3) 10
Figure 7. Results from this study. The four plots, shown at top, come from the 13 treatments shown at bottom
in Figure 7, this produced one of the largest f-measures
seen in this study.
Treatment a assessed a learned model using the data
that generated it. Such a self-test can lead to an
over-estimate of the value of that model. Cross-valida-tion, on the other hand, assesses a learned model using
data not used to generate it. The data is divided into, say,
10 buckets. Each bucket is set aside as a test set and a model is learned from the remaining data. This learned model is then assessed using the test set. Such cross-validation studies are the preferred evaluation method when the goal is to produce predictors intended to predict future events [17].
In treatment b, a cross-validation experiment was
ap-plied to the data. The treatment b results shows how
badly treatment a overestimated the performance:
changing the training data by as little as 10% nearly halved the precision and recall. Clearly, the conclusions
altered by minor changes in the training data.
Treatment c illustrates the explanation vs performance
trade-off discussed in the introduction. As mentioned above, the output from rule learners can be far easier to
explain than the output of treatment c; i.e. a Näive Bayes
classifier (with kernel estimation) running on data sets with non-Gaussian distributions like Figure 1. So, if
op-timizing for explainability, an analyst might favor rule
learners over Bayes classifiers. On the other hand, Figure
7 shows treatment c out-performing treatment b,
espe-cially in terms of recall. So, if optimizing for
perform-ance an analyst might favor a Bayes classifier.
Note that treatment c uses the method favored by the
previous high water mark in this research [2]. In the se-quel, we show how this study found data mining methods that significantly out-perform that prior work.
4.3.2 Discretization
Treatments d,e and f explore discretization.
Discretiza-tion clumps together observaDiscretiza-tions taken over a continu-ous range into a small number of regions. Humans often discretize real world data. For example, parents often share tips for “toddlers”; i.e. humans found between the
breaks of age=1 and age=3. Many researchers report that
discretization improves the performance of a learner since it gives a learner a smaller space to reason about, with more examples in each part of the space [16,20], [36,37].
Discretization can generally be described as a process of assigning data attribute instances to bins or buckets that they fit in according to their value or some other score. The general concept for discretization as a binning process is dividing up each instance of an attribute to be discretized into a number distinct buckets or bins. The number of bins is most often a user-defined, arbitrary value; however, some methods use more advanced tech-niques to determine an ideal number of bins to use for the values while others use the user-defined value as a start-ing point and expand or contract the number of bins that are actually used based upon the number of data in-stances being placed in the bins. Each bin or bucket is assigned a range of the attribute values to contain, and discretization occurs when the values that fall within a particular bucket or bin are replaced by identifier for the bucket into which they fall.
After Gama and Pinto [38], we say that discretization is the process of converting a continuous range into a
his-togram with k break points b1…bk where i j:bibj.
The histogram divides a continuous range into bins (one for each break) and many observations from the range
may fall between two break points bi and bi+1 at
fre-quency counts ci.
Simple discretizers are unsupervised methods that
build their histograms without exploiting information
about the target class; e.g.
equal width: i,j:bibi1
bjbj1
; equal frequency: i,j:
cicj
. For Näive Bayesclassifiers working on n instances, Yang & Webb [16]
advocate equal frequency with ci=cj= n.
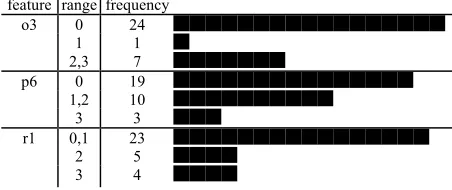
For example, Figure 1 holds 32 instances so a b=3
equal frequency discretion hopes to place 323≈10 values
into each part of the histogram. However, Figure 1 does not have ten instances for each feature value so, as shown in Figure 8, a skewed histogram is generated.
More sophisticated discretizers are supervised methods
that build their histograms using knowledge of the target class. Specifically, the continuous range is explored
looking for a break that is a cliff; i.e. a point where the
class frequencies are most different above and below the
cliff. Once a top-level cliff is found, this method usually
recurses into each region above and below the cliff to
find the next best sub-cliff, sub-sub-cliff, and so on. For example, the Fayyad & Irani [37] supervised dis-cretizer assumes that the best cliff is the one that most divides target classes. In terms of information theory, this
can be measured using entropy; i.e. the number of bits
required to encode the class distribution. If the classes in
a sample of n instances occur at frequencies counts
c1,c2,..., then the entropy of that sample is
1 1 2 21, ...2 2 2 ...
c c c c Ent c c log log
n n n n
If a break divides n numbers into two regions of size
n1,n2, then the best cliff is the one that minimizes the
sum of the entropy below and above the cliff; i.e.
n1 n·Ent1+
n2 n·Ent2.
Various discretizers were explored, with disappointing results:
Yang & Webb’s rule (ci= n= 33≈6) was not
useful here since our data has less than 6 distinct values per feature.
Fayyad&Irani’s method reduced most features to a
single bin; i.e. it found no information gain in any parts feature range frequency
o3 0 24
1 1
2,3 7
p6 0 19
1,2 10
3 3
r1 0,1 23
2 5
[image:9.595.309.535.608.703.2]3 4
of our ranges.
Best results were seen with a simple 3bin equal
fre-quency scheme (i.e. |b|=3) in Treatment f where PRISM
achieved precisions as high as the RIPPER self-test
(treatment a). However, the same experiment saw the
worst recall.
The same 3bin scheme offered little help to
RIP-PER or Näive Bayes (see treatments d,e).
Since the precision results were the most promising
seen to date, 3bin was retained for the rest of our
ex-periments. Other methods were then employed to achieve
the benefits of 3bin (high precision) without its
associ-ated costs (low recall).
4.3.3 Feature Subset Selection
The remaining treatments (g,h,i,j,k,l,m) explore how
dif-ferent feature subsets change the performance of the
learning. A repeated result in the data mining community is that simpler models with equivalent or higher
per-formance can be built via feature subset selection
algo-rithms that intelligently prune useless features [19]. Fea-tures may be pruned for several reasons:
They may be noisy; i.e. contain spurious signals
unrelated to the target class;
They may be uninformative; e.g. contain mostly one
value, or no repeating values;
They may be correlated to other variables- in which
case, they can be pruned since their signal is also present in other variables.
The reduced feature set has many advantages:
Miller has shown that models generally containing
fewer variables have less variance in their outputs [39].
The smaller the model, the fewer are the demands
on interfaces (sensors and actuators) to the external en-vironment. Hence, systems designed around small mod-els are easier to use (less to do) and cheaper to build.
In terms of this article, the most important aspect of
learning from a reduced features set is that it produces smaller models. Such smaller models are easier to ex-plain (or audit).
One such feature subset selector is Kohavi & Johns’ WRAPPER algorithm [40]. Starting with the empty set, WRAPPER adds some combinations of features and asks some target learner to build a model using just those fea-tures. WRAPPER then grows the set of selected features and checks if a better model comes from learning over the larger set of features.
If we applied WRAPPER to our three learners (RIP-PER, PRISM, Näive Bayes), then WRAPPER’s search through the 22 features of Figure 1 could require
3•222=12,582,912 calls to a learner. In practice, a
heuris-tic search drasheuris-tically reduced this search space. WRAP-PER stops when there are no more features to select, or there has been no significant improvement in the learned model for the last five additions (in which case, those last five additions are deleted). Technically speaking, this is a hill-climbing forward select search with a “stale” param-
feature PRISM Näive Bayes
RIPPER average
group #1 : usually selected
r1 10 10 6 8.7
o3 7 7
p5 8 4 6
p6 8 1 4.5
group #2: sometimes selected
m3 3 3
r2 2 2
p2 2 1 1.5
e1 1 2 1 1.3
o2 1 2 1 1.3
e2 1 1
group #3:
rarely selected e3 1 1
m2 1 1
o1 1 1
p1 1 1 1
p3 1 1
p4 1 1
r3 1 1
r4 group #4:
never selected
r5
e4
e5
[image:10.595.310.538.84.349.2]m1
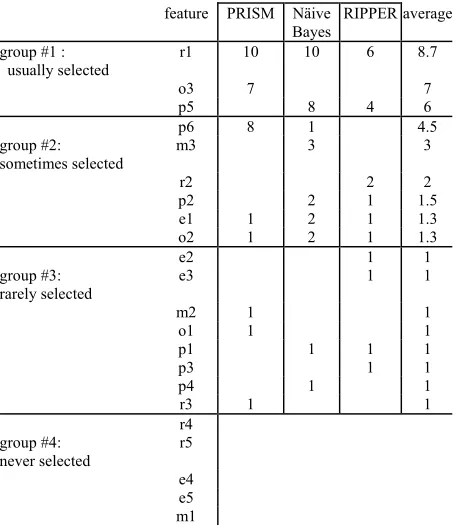
Figure 9. Number of times WRAPPER selected features in ten experiments on 90% samples of the data
eter set to 5. For data sets as small as Figure 1, WRAP-PER terminates in an under a minute (but for large data sets, other feature selectors would be required-see [19] for a survey).
Figure 9 shows the results of running 10 WRAPPER
experiments on Figure 1 (discretized via 3bin) for our
three learners. In each experiment, 10% of Figure 1 (se-lected at random) was ignored:
Group #1 shows the features that, on average, were
selected in the majority of ten runs (on average, 6 times or more).
Group #2 shows the features that were selected 2 to
5 times.
Group #3 shows the features that were selected only
once.
Group #4 shows the features that were never
se-lected.
There are only three features in Group #1 suggesting that many of the Figure 1 features could be ignored. This has implications for the cost of data collection and the explaining runaway projects:
Data collection could be constrained to just Group #1,
and perhaps p6 (which PRISM selected eight times).
Such a constrained data collection program would be cheaper to conduct, especially over a large organization.
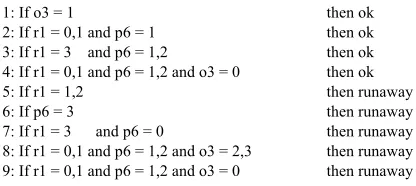
Figure 10 shows a rule predicting runaway projects
found by PRISM using just the features recommend by
WRAPPER (r1, p6, o3) on 3bin discretized data. The
1: If o3 = 1 then ok 2: If r1 = 0,1 and p6 = 1 then ok 3: If r1 = 3 and p6 = 1,2 then ok 4: If r1 = 0,1 and p6 = 1,2 and o3 = 0 then ok 5: If r1 = 1,2 then runaway 6: If p6 = 3 then runaway 7: If r1 = 3 and p6 = 0 then runaway 8: If r1 = 0,1 and p6 = 1,2 and o3 = 2,3 then runaway 9: If r1 = 0,1 and p6 = 1,2 and o3 = 0 then runaway
Figure 10. Rules generated by treatment m
Figure 9 yields a very succinct, easy to explain model.
Treatments g,h,...m show the results of applying the
top-ranked features to the discretized data. For each
learner, if WRAPPER usually selected N features, then
that learner was tested in a 10-way cross-validation using the top ranked feature, the second-top ranked features,
and so on up to using N features.
4.3.4 Best Results
The best results were obtained in treatment m. That
treatment applied PRISM using the three features usually
selected by WRAPPER+PRISM: r1, o3, p6. This
re-sulted in Figure 10.
Figure 8 showed r1 {0,1}, p6 {1,2}, o3=0 is a
fre-quent pattern in our data. Hence, after a covering algo-rithm removes all other more interesting structures, the residual rows can contain this frequent pattern. This, in turn, means that identical rules could be generated for different classes; e.g. rules 4&9 of Figure 10 (this is the
residual rule problem discussed above).
It is important to read these rules top to bottom since a
rule fires only if all the rules above it fail. In practice,
this means that the residual rule 9 is never used (it is blocked by rule 4).
A 10-way cross-validation study showed that this rule generation method yields an average precision, recall,
and f-measure across the 10-way of 1, 0.85, and 0.92
(respectively). This result is actually much better than it appears. To achieve average precisions and recalls of 1 and 0.85 in such a 10-way is something of an accom-plishment. In a 10-way cross-validation on the 33 records of Figure 1, the test set is of size three or four. In such a small test set, a single outlier project can have a large and detrimental result on the collected statistics.
4.3.5 User Studies
To test the explainability of Figure 10, we ran a session
with eight software engineers managing large software verification projects.
Pseudocode for Näive Bayes (with kernel estimation) and PRISM (Figure 6) was introduced. PRISM was summarized this way: “each rule handles some examples, which are then removed, and the algorithm repeats on the remaining data.”
Within an hour, the engineers were hand-simulating PRISM. Using a pen and ruler, all the rows of Figure 1 that matched rule #1 (in Figure 10) were identified and
crossed off. The rows that matched rule #2 were identi-fied, then crossed off. The engineers stopped after simu-lating PRISM’s activities on two or three rules, making comments like “I see what is going on- the learner is finding and handling the most obvious next thing.” Sig-nificantly, none of the engineers tried to apply Näive Bayes; i.e. m-estimates, l-estimates, the approximation, and the Gaussians of kernel estimation.
In summary, the simplicity of PRISM the rules of Fig-ure 10 allowed them to be explained to one focus group, all within a one hour session.
5. Discussion
5.1 Related Work
This research aims at producing a precise, explainable, operational definition of a runaway project. Other work in this area is less precise and not operational.
For example, in 1997, Glass [4] had informally sam-pled several high-profile software disasters and found the following features to be predictive for runaways:
Project objectives not fully specified (in 51% of the
sample);
Bad planning and estimating (48%);
Technology new to the organization (45%);
Inadequate/no project management methodology
(42%);
Insufficient senior staff on the team (42%);
Poor performance by suppliers of
hard-ware/software (42%)
Other-performance (efficiency) problems (42%)
Glass did not offer a clear operational method for com-bining their features into an effective predictor. Other work carefully documented the software risk problem, but did not offer automatic tool support:
Jiang et al. [6] studied 40 features collected from
questionnaires posted to personnel with recent experi-ence with an IS project. Their study is an exemplary ex-ample of software engineering research: after clearly defined six hypotheses about software risk, they identify those hypotheses not supported by their data.
Ropponen & Lyytinen [7] studied self-reported data
from 83 project managers and 1,110 projects to find 26 software risk components: six scheduling and timing risks; four system functionality risks; three subcontract-ing risks; four requirements management risks; four re-source usage and performance risks; and five personnel management risks.
Both reports have the same limitations: their conclu-sions contain a somewhat ill-defined and manual proce-dure for managers to explore the above risks. For exam-ple, both reports list risks and their weighted contribution to total risk. However, no combination rule is offered on
how to best combine evidence of multiple risks.
studies is reproducibility. Neither the Jiang et al. nor Ropponen & Lyytinen [7] studies are reproducible since they did not made their data available to other research-ers. Reproducibility is an important methodological prin-ciple in other disciplines since it allows a community to confirm, refute, or even improve prior results. In our view, in the field of software engineering, there are all
too few examples of reproduced, and extended, results*.
This current report began when the second and third au-thors published their data [1] and defined a research challenge: how to better explain the results of their learning to developers [2]. We would strongly encourage software engineering researchers to share data, define challenges, and to take the time to rework the results of others.
5.2 External Validity
This study has produced:
1). A recommended feature subset for predicting
run-aways (r1,p6,o3);
2). A recommended model that combines those
fea-tures (Figure 10); and
3). A recommended method for generating that subset
and that model:
3bin discretization;
a WRAPPER around PRISM;
10-way cross-validation using PRISM on the
sub-sets found by WRAPPER.
It is good practice to question the external validity of these recommendations.
WRAPPER selected different features than the manual method that produced Equation 1. That is, the recom-mended feature subset learned by our recomrecom-mended method is different to that found by our earlier work. This raises a concern about external validity: why do our conclusions keep changing?
We endorse the conclusions of this study over our prior work [1] for two reasons. Firstly, this study ex-plored far more feature subsets that before:
Equation 1 was generated after a manual analysis of
a few features.
Figure 10 was generated after an automatic search
through thousands of subsets.
Secondly, the results of this study perform better than our prior results:
Equation 1 offers ambiguous conclusions in the
range (0.03<P(runaway|X)<0.81).
Figure 10 offers categorical conclusions about the
runaway status of a project. Further, it does so with perfect precision.
A more serious validity threat comes from the data used in this study. Any inductive process suffers from a
sampling bias; i.e. the conclusions of the study are a function of the data used in that study. In that regard, we have evidence that our results are stable across small to medium-sized changes to our project sample. In a 10-way cross-validation experiment, 10% of the data (in our case, 3 to 4 records) is set aside and the model is learned from the remaining information. Our learned model had an average precision of 1.0 in a 10-way; i.e. the precision of our model remained perfect, despite a 10% change in the training data.
Also, Figure 1 does not show all the data available to this study. Some of the data available to this research group is proprietary and cannot be generally released. In order to check the external validity of our methods, these
ten extra records were not analyzed until after we
reached the above conclusions regarding the recom-mended data mining method for this data. When our recommended method was applied to Figure 1, plus the extra ten records, WRAPPER still found the features shown in Figure 9. Further, the performance of the rule set learned from the extended data had the same proper-ties as Figure 10; i.e.
It out-performed NäiveBayes;
It exhibited perfect precision (precision=1.0) over
the 10-way cross-validation.
In summary, despite the data set size changing by a small to medium amount (-10% to +33%), there is:
No instability in the recommended features;
No instability in the performance of the
recom-mended model;
No instability in the recommended method.
5.3 Method Selection for Quirky Data
Several times we found that certain widely regarded methods (RIPPER; discretization using Fayyad&Irani;
discretization with Yang & Webb’s n rule) did not
yield the best results for this data set. The reason for this is simple: software engineering data sets are often small:
Figure 1 is one table with only 22*33 cells;
Elsewhere we have published results on even
smaller data sets [41,42].
It is hard to know apriori what are the quirks of small
software engineering data sets. Hence, we recommend trying many methods, even supposedly out-dated ones. For example, in this study, a very simple rule-learner (PRISM) produced the best performance while being most understandable to our users.
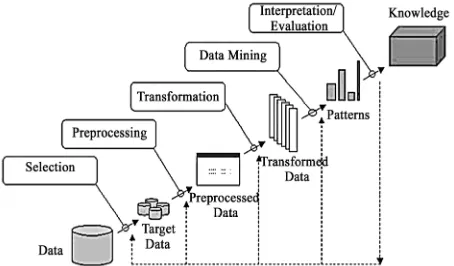
More generally, Fayyad [43] argues persuasively that
data mining should be viewed as a small part of the
knowledge and data discovery (KDD) cycle shown in Fig-ure 11. For example, in this report we used discretization
and feature subset-selection for pre-processing and
selec-tion steps shown in Figure 11. Also, we looped through the
KDD cycle 13 times: each time, the results from the pre-vious round informed our work for the next round.
*Exception: see the reports of the PROMISE workshop
Figure 11. The KDD (Knowledge Discovery in Databases) cycle, adapted from [43]
5.4 Data Mining Methods
Based on this work, and certain standard texts in the data mining field [17,43], we offer the following advice to other researchers data mining on SE data.
It is important to understand the goals of the data
mining task. If the learned model only needs to perform,
and not explain then any data mining method might do
ranging from
Näive Bayes classifiers
To clustering algorithms, decision tree learners,
neural nets, etc
Or, as explored in Equation 4, ensembles of the
above.
The simplest of the above is Näive Bayes. Such classi-fiers scale to very large data sets and, in many domains, have performed very well [15,19,20]. Also, in at least one SE domain [21], they far out-performed other meth-ods.
However, if the goal is to generate an explainable
the-ory, then:
Many business users do not have the background
required to understand mathematical-based learners. For such users, the rule learners (e.g. RIPPER) may be most useful since they produce succinct summaries of the data.
It is useful to reduce the range of number variables
with discretization. Once reduced, the learned model can be simpler since it only needs to comment on a few dis-crete ranges rather than the entire number line.
It is also useful to reduce the number of features
with feature subset selection. A repeated result in the literature [19,39,40] is that the majority of the features can be pruned away and the resulting model is either simpler, performs better or both. For example, in this case study, the best performance and the most suc-cinct/explainable model were found using just 3/22 of the available data.
As to the choice of feature subset selector:
Hall and Holmes [19] compare WRAPPER to
sev-eral other variable pruning methods including the princi-pal component analysis (PCA) method used by Roppo-nen & LyytiRoppo-nen and Munson [9] (amongst others). Fea-ture selection methods can be grouped according to (a) whether or not they make special use of the target vari-able in the data set such as “runaway”; (b) whether or not pruning uses the target learner. PCA does not make spe-cial use of the target variable. Also, unlike other pruning
methods, WRAPPER does use the target learner as part
of its analysis. Hall and Holmes found that PCA was one of the worst performing methods (perhaps because it ignored the target variable) while WRAPPER was the best (since it can exploit its special knowledge of the target learner).
For large data sets, WRAPPER can be too slow.
When WRAPPER is not possible, see the conclusion of the Hall & Holmes study [19] for recommendations on two other feature subset selection methods.
If the data set is small enough (e.g. Figure 1), use
WRAPPER around a rule learner. WRAPPER is the slowest feature subset selector but it is the only one that can tune itself to the target learner.
Regarding performance measures, we have two rec-ommendations:
[image:13.595.59.286.90.223.2] Comparing the f-measures in treatment a and b of
Figure 7, it is clear that self-tests can over-estimate the value of a learned model. Hold-out sets are the recom-mended way to assess a learned model.
Accuracy is a widely used measure for assessing a
learned theory. Figure 7 shows that it can be remarkably uninformative. In that figure, large changes in precision and recall make very little impact on the accuracy. Hence, we strongly recommend against the use of accuracy.
The above issues are widely discussed in the data mining literature (e.g. [17,43–45]). Nevertheless, our reading of the literature is that multiple traversals of the KDD cyclic application using a range of techniques (e.g. different learners, discretizers, and feature subset selec-tors) is quite rare. Often researchers take one learner, apply it once, then report the conclusion. Also, despite many positive empirical studies, feature selection is rarely seen in software engineering (exceptions: [21,46]). Further, it is still standard practice for software engineers to present their data mining results in terms of accuracy of non-hold-out experiments (e.g. [47]). We hope our results encourage a change in that standard practice.
6. Conclusions
Greenwald, and Frank. Complex and arcane learning strategies will be hard to explain. That is, good perform-ance in a learned model may imply poor explanatory power, especially for real world software engineering data.
This paper is a counter-argument to such pessimism. We show that at least for predicting runaway software projects, certain standard data mining methods resulted in models with both:
High performance: i.e. precision=1.0; and
Good explainability: i.e. small rule sets,
under-standable by our users;
This result is a new high water mark in predicting runaway projects. This new predictor out-performs prior results in several ways:
Our results are fully reproducible: the data for our
analysis comes from Figure 7; the software used is freely
available*.
Prior work by other researchers [4–7] has carefully
documented the influence of features on software risk, but did not offer an operational model (by “operational”, we mean that the model can generate performance statis-tics like Figure 7).
As to our own prior results, the logistic regression
method [1] required some manual intervention on the part of the analyst. In contrast to that, the techniques de-scribed here are automatic. Also, due to ambiguities in
the middle P ranges of Equation 1, or the inner
com-plexities of our Näive Bayes classifier [2], our prior mathematical results were much harder to explain than the new rules of Figure 10.
Comparing treatment c and treatment m in Figure 7,
we see that our new data mining method (treatment m:
3bin, WRAPPER, PRISM) has similar recall but much
higher precision than our old data mining method
(treat-ment c: NäiveBayes [2]).
Measured in terms of precision, this new model is
as good as can ever be expected for our data. Other com-bination data mining methods could out-perform our re-sult (e.g. by generating a smaller, more explainable model with higher recall) but no other method could be more precise (since precision’s maximum value is 1.0).
Prior results conducted a manual exploration of a
few subsets of the features [1]. Here, we employed a feature subset selector that explored thousands of feature subsets. Hence, we have far more confidence that the following factors are most useful in recognizing run-aways: ambiguous requirements; low morale; lack of project members’ commitment to the project plan.
REFERENCES
[1] Y. Takagi, O. Mizuno, and T. Kikuno, “An empirical
approach to characterizing risky software projects based on logistic regression analysis,” Empirical Software En-gineering, Vol. 10, No. 4, pp. 495–515, 2005.
[2] S. Abe, O. Mizuno, T. Kikuno, N. Kikuchi, and M. Hira-yama, “Estimation of project success using bayesian clas-sifier,” in ICSE 2006, pp. 600–603, 2006.
[3] O. Mizuno, T. Kikuno, Y. Takagi, and K. Sakamoto, “Characterization of risky projects based on project man-agers evaluation,” in ICSE 2000, 2000.
[4] R. Glass, “Software runaways: Lessons learned from massive software project failures,” Pearson Education, 1997.
[5] “The Standish Group Report: Chaos 2001,” 2001, http://standishgroup.com/sample research/PDFpages/ ex-treme chaos.pdf.
[6] J. Jiang, G. Klein, H. Chen, and L. Lin, “Reducing user-related risks during and prior to system develop-ment,” International Journal of Project Management, Vol. 20, No. 7, pp. 507–515, October 2002.
[7] J. Ropponen and K. Lyytinen, “Components of software development risk: how to address them? A project man-ager survey,” IEEE Transactions on Software Engineer-ing, pp. 98–112, Feburary 2000.
[8] W. Dillon and M. Goldstein, “Multivariate analysis: Methods and applications.” Wiley-Interscience, 1984. [9] J. C. Munson and T. M. Khoshgoftaar, “The use of
soft-ware complexity metrics in softsoft-ware reliability model-ing,” in Proceedings of the International Symposium on Software Reliability Engineering, Austin, TX, May 1991. [10] G. Boetticher, T. Menzies, and T. Ostrand, “The PROM-ISE Repository of Empirical Software Engineering Data,” 2007, http://promisedata.org/repository.
[11] T. McCabe, “A complexity measure,” IEEE Transactions on Software Engineering, Vol. 2, No. 4, pp. 308–320, December 1976.
[12] M. Halstead, “Elements of software science,” Elsevier, 1977.
[13] K. Toh, W. Yau, and X. Jiang, “A reduced multivariate polynomial model for multimodal biometrics and classi-fiers fusion,” IEEE Transactions on Circuits and Systems for Video Technology, pp. 224–233, February 2004. [14] R. Duda, P. Hart, and N. Nilsson, “Subjective bayesian
methods for rule-based inference systems,” in Technical Report 124, Artificial Intelligence Center, SRI Interna-tional, 1976.
[15] P. Domingos and M. J. Pazzani, “On the optimality of the simple bayesian classifier under zero-one loss,” Machine Learning, Vol. 29, No. 2-3, pp. 103–130, 1997.
http:// citeseer.ist.psu.edu/domingos97 optimality. html [16] Y. Yang and G. Webb, “Weighted proportional k-interval
![Figure 5. Quartile charts from Menzies, Greenwald & Frank [21]. The charts show the differences when learners were applied to the same the training and test data](https://thumb-us.123doks.com/thumbv2/123dok_us/8744369.388663/6.595.57.287.517.635/figure-quartile-menzies-greenwald-differences-learners-applied-training.webp)