An Optical Based Biosensor for the Determination of
Ammonium in Aqueous Environment
Nur Ellina Azmi1, Jaafar Abdullah1*, Musa Ahmad2, Hamidah Sidek1, Lee Yook Heng2, Samsulida Abd Rahman1
1Industrial Biotechnology Research Centre, SIRIM Berhad, Shah Alam, Malaysia 2School of Chemical Sciences and Food Technology, Faculty of Sciences and Technology,
Universiti Kebangsaan Malaysia, Bangi, Malaysia Email: *[email protected]
Received February 13,2012; revised March 15, 2012; accepted March 25, 2012
ABSTRACT
A simple and rapid optical biosensor for the determination of ammonium was developed by immobilization of gluta-mate dehydrogenase (GLDH) and diaphorase (Dph) in chitosan film coated on a glass slide employing thiazolyl blue tetrazolium bromide (MTT) as a color indicator. The developed biosensor displays a purple color formation of formazan attributed to the unreacted NADH in the reaction system in the presence of ammonium. The color intensity was found to decrease proportionally with the increase of ammonium concentrations after 10 min exposure. The linearity of the biosensor towards ammonium was in the range of 16.8 - 70 µM (R2 = 0.9955) with detection limit of 11 µM. A good
agreement (R2 = 0.9984) with indothymol method was obtained in the measurement of fish pond water samples. The effect of potential interferences such as metals ion has also been evaluated.
Keywords: Optical Biosensor; Glutamate Dehydrogenase; Diaphorase; Ammonium
1. Introduction
The determination of ammonia (NH3) in the environ-
mental samples has become increasingly important. Usually, ammonia exist either in form of gases as ammo-nia or in water as ammonium ( 4) ions [1]. Ammonia
is part of the natural nitrogen cycle and it is released to the environment by natural processes such as the de-composition of organic matter, human and animal ex-crements, or by volcanic eruptions [2]. It can also be dis-tributed to the environment by activities like extensive use of fertilizers, spillage or leakage from wastewater treatment plants [3]. Ammonia is often found at low level in natural water however, elevated concentration of this compound can occur usually due to effluent discharges from sewage treatment plants, industrial processes or farming activeties [2,3].
NH+
NH+
Various approaches have been developed to detect dissolved ammonia in aqueous environment employing either electrochemical or optical methods [4-6]. These methods are time consuming and often require skill per- sonnel to operate the sample preparation. An interesting alternative method for determination of dissolved ammo- nia involves the development of biosensors, which can offer simple, rapid, sensitive, specific and portable sys-
tem [2,3,7].
Several papers have been published on the determina- tion of dissolved ammonia employing enzyme system. The reaction involved the use of enzyme glutamate de- hydrogenase (GLDH), which requires the cofactor β- nicotinamide adenine dinucleotide (NADH) and ammo- nium ( 4) in the enzymatic conversion of 2-oxoglu-
tarate to L-glutamate [8-10]. During the reaction NADH is oxidized to NAD+, thereby making possible the indi-
rect monitoring of ammonium by measuring the con- sumption of NADH either amperometrically at a poten- tial of +0.76 V or optically at a wavelength of 340 nm. There are some intricacy present in the amperometric detection of NADH like the involvement high overpoten- tials and the formation of by-products that caused the ad- sorption of (NAD)2 dimers which foul the electrode sur-
face [11,12]. Optical sensors have attracted the attention of many researches because of their small size, ease of operation and freedom from electrical interference [13].
Here, we demonstrate a colorimetric based biosensor employing stacked film immobilization of glutamate dehydrogenase (GLDH) and diaphorase (Dph) in combi- nation with redox indicator thiazolyl blue tetrazolium bromide (MTT) for the determination of ammonium ion in aqueous environment. The biosensor offer several ad- vantages including the ability of the sensors to give a
365
quick indication on the presence of analyte of interest based on the color changes by using dual enzymes.
2. Experimental
2.1. Reagents
Dph, NADH, MTT, copper chloride, ferrous sulphate, zinc chloride, silver nitrate, mercury chloride, calcium chloride, potassium chloride and sodium nitrate were purchased from SIGMA. GLDH and α-ketoglutaric acid were obtained from FLUKA. Chitosan and sodium nitro- prusside were supplied by Chito-Chem (M) Sdn. Bhd. and Merck, respectively. Thymol was acquired from BDH Chemicals. Sodium hypochlorite 10% was acquired from Systerm and ammonium chloride was purchased from R & M Marketing. All chemicals were of analytical grades and used without further purification.
2.2. Preparation of Biosensor
Chitosan solution (2%) was prepared by dissolving 2.0 g chitosan powder in 100 mL acetic acid (1%, v/v). The viscous solution was stirred overnight at room tempera- ture. GLDH (40 mg/mL) and Dph (40 mg/mL) stock solution were prepared by dissolving 0.012 g of respec- tive GLDH powder and Dph powder in 300 μL of 50 mM phosphate buffer solution pH 7. These solutions were then divided into 20 μL aliquots and kept at –20˚C for later use. A homogeneous stock solution of GLDH/ chitosan mixture was prepared by mixing GLDH solution (40 mg/mL) and chitosan solution (2%) at a volume ratio of 0.25 to 1.0 (v/v). Dph/chitosan mixture was prepared by using the same ratio as the latter.
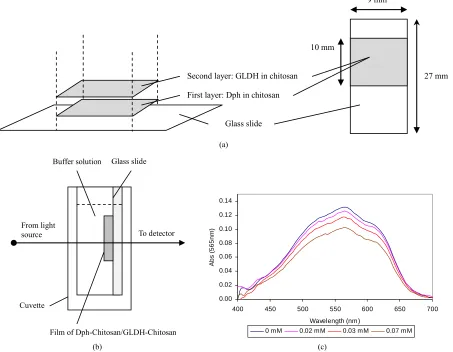
Figure 1(a) illustrates the enzyme immobilization
process: 10 μL of the Dph/chitosan mixture was depo- sited onto a glass slide in an area of 9 mm × 10 mm. Then it was spun at 2000 rpm for 3 s. The biosensor was kept at 4˚C for drying. A volume of 10 μL of the GLDH/chitosan mixture was then pipetted onto the dried film of Dph/chitosan on a glass slide and coated gently over an area of 9 mm × 10 mm. Again, it was spun at 2000 rpm for 3 s and dried at 4˚C.
2.3. Evaluation of Biosensor Response
All absorption measurements were conducted by using an ultraviolet-visible spectrophotometer (Varian Cary 50). The biosensor was soaked in 50 mM phosphate buffer solution pH 8.0 for 5 min to remove unbound enzyme and then it was washed with distilled water. It was then exposed to 3 mL of 50 mM phosphate buffer solution pH 8.0 consisting of ammonium (1 mM), α-ketoglutaric acid (0.15 mM), NADH (0.15 mM) and MTT (0.3 mM) for 10 min reaction time as shown in Figure 1(b). The re-
sponse of the biosensor was studied at a fixed wave-
length of 565 nm as described in Equation (1).
Δ Abs (565 nm) = I10 min – I0 min (1)
I0 min and I10 min are absorption intensity of the biosen-
sor film at 0 min and 10 min of reaction time, respec- tively.
2.4. Comparison of the Biosensor Response and Analysis of Spiked Real Samples
The response of the biosensor to various concentrations of ammonium ion (0.0 - 0.15 mM) was compared via indothymol method [14]. For indothymol, the reaction was based on ammonium ion solution reacts with nitro- prusside (0.017 M), sodium hypochlorite (0.013%) and thymol (0.027 mM) at pH 10.0 to form a blue color. The absorption was measured after 5 min at a wavelength of 690 nm.
For the evaluation of the biosensor performance with real samples, water samples obtained from four fish ponds were used for the analysis. The water samples were adjusted to pH 8.0 with 50 mM phosphate buffer solution (pH 8.0) prior to the evaluation. The recovery tests for ammonium were conducted after addition of a known concentration of ammonium to the water samples.
3. Results and Discussions
3.1. Optimization of an Optical Assay for Ammonium Employing the Biosensor
The determination of ammonium in the environmental samples employing enzymatic reactions has been reported previously [7,10]. The applications of diaphorase coupled with tetrazolium salts, which produce highly colored for- mazan dyes upon NADH oxidation, have been used as chromogenic reagents for quantification of NADH as detection signal [15]. In this study, we explored the use of dual enzymes system GLDH/Diaphorase in combination with MTT for the determination of ammonium in aqueous solutions. The enzymatic reaction involved is shown in the following equations:
4
+ unreacted
GLDH NH -ketoglutaratic acid NADH
L-glutamate NADH NAD
++ + ⎯⎯⎯⎯→
+ +
α
+ unreacted
Dph
(2)
NADH +MTT⎯⎯⎯→Formazan NAD+
NH+
(3) In the presence of 4, enzymatic conversion of α-
ketoglutaric acid to L-glutamate by the immobilized GLDH requires NADH as a cofactor. In this reaction, the consumption of NADH depends on the NH4+ concentra-
tion, which result in excess of unreacted NADH. The excess of unreacted NADH is then oxidized to NAD+ in
Figure 1(c) shows the absorption spectra of the biosensor
based on stacked immobilization of GLDH and Dph in chitosan film in the presence of MTT (0.3 mM), NADH (0.1 mM), α-ketoglutaric acid (0.14 mM) and different concentrations of ammonium (0.0 - 0.07 mM). The opti- mum response of the biosensor was observed at a wave- length of 565 nm. As can be seen in Figure 1(c), at va-
rious concentrations of ammonium the color intensity of the formazan was found to decrease proportionally with the increase of the ammonium concentrations after 10 min exposure. This result indicates that the consumption of NADH is dependent on the ammonium concentration used in the reaction system.
In order to obtain optimum response of the designed biosensor, a series of experiment conditions were per- formed and summarized in Table 1. The effect of pH
was investigated using phosphate and tris-HCl buffers covering the pH ranging from 6 - 9 (50 mM). The re- sponse was obtained by measuring at respective concen- trations of ammonium (0.0, 0.08 and 0.17 mM), NADH (0.15 mM), α-ketoglutaric acid (0.15 mM) and MTT (0.2
mM). As summarized in Table 1 the maximum pH was
observed at 8 (50 mM phosphate buffer) and this pH was used for further studies. To improve the biosensor per- formance, various enzyme loading and MTT concentra- tions were studied. The effect of Dph loading in a chito- san film (2%) on the biosensor response was examined. Upon increasing the Dph loading, the biosensor response increased sharply to reach a maximum value. Above the loading 0.07 mg, enzyme saturation behaviour was oc- curred. The loading for the GLDH was based on our pre- vious work [16]. Thus, 0.07 mg of Dph and GLDH were used for the preparation of the biosensing film.
The effect of MTT concentrations on the sensor re- sponse was carried out by varying the concentrations between 0.05 - 0.50 mM and optimum response of the biosensor was obtained at MTT concentration of 0.3 mM. Above this concentration reduction in the biosensor re- sponse was observed which probably due to the saturated of formazan complex formation on the biosensor surface. The influence of various NADH and α-ketoglutaric acid concentrations was further explored by studying the color
First layer: Dph in chitosan Second layer: GLDH in chitosan
Glass slide
9 mm
27 mm 10 mm
(a)
Cuvette
Glass slide Buffer solution
Film of Dph-Chitosan/GLDH-Chitosan From light
source To detector
0.00 0.02 0.04 0.06 0.08 0.10 0.12 0.14
400 450 500 550 600 650 700 Wavelength (nm)
A
bs
(
565
nm
)
0 mM 0.02 mM 0.03 mM 0.07 mM
[image:3.595.74.527.354.706.2](b) (c)
367
Table 1. Optimization experimental parameters.
Experimental conditions Value range Optimum value
pH 6.0 - 9.0 8.0
Dph loading (mg) 0.01 - 0.13 0.07
MTT concentrations (mM) 0.05 - 0.50 0.30
NADH concentrations (mM) 0.05 - 0.30 0.20
α-ketoglutaric acid concentration (mM) 0.05 - 0.30 0.15
[image:4.595.310.537.379.535.2] [image:4.595.308.538.575.707.2]formation of formazan on the surface of the sensor film. The amount of NADH in the enzyme membrane must be sufficient in order to obtain a good linear range. The re- sponse increased with increasing NADH concentration and reaches an optimum value at a concentration of 0.20 mM. The performance of the biosensor was further evaluated by optimizing α-ketoglutaric acid concentra- tion ranging from 0.05 - 0.30 mM. The optimum concen- tration of α-ketoglutaric acid was obtained at 0.15 mM. Further increase in the concentration of α-ketoglutaric acid results the decrease in the biosensor response which, may attribute to an inhibitory effect of α-ketoglutaric on the enzyme activity [17].
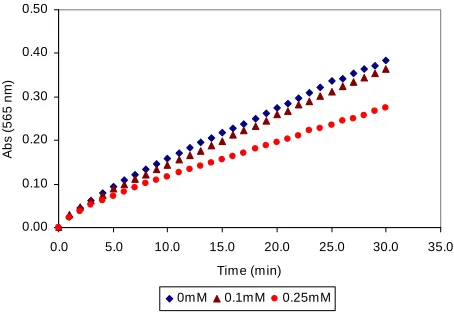
Figure 2 illustrates the response of the biosensor to-
wards various concentrations of ammonium (0, 0.1 and 0.25 mM). As shown, the response of the biosensor in- creased with time until 30 min reaction time. It can be noted that the time taken to achieve steady state response was longer. This could be due to the diffusion of analyte in the dual enzymes film was affected the sensor re- sponse [18]. Therefore, a kinetic approach was used in this study to quantify ammonium concentration where the intensity of the biosensor was decided to be measured after 10 min reaction time to obtain sufficient response.
3.2. Analytical Application
Figure 3 showed the dynamic response of the biosensor
obtained by addition of ammonium concentrations rang- ing from 0.0 - 0.17 mM. The decreased of formazan in- tensity produced due to the consumptions of NADH by GLDH/Dph in the chitosan layer was proportional to the concentrations of ammonium. A linear response of the biosensor was obtained at an ammonium concentration range of 16.8 - 70 µM (slope = 0.3263, R2 = 0.9955) with
the detection limit calculated to be at 11 µM. Although the linear response was quite narrow, the combination of enzymes and dye system improved the biosensor selec- tivity and simplified the determination of ammonium.
For kinetic study, the apparent Michaels-Menten con- stant (Km) was estimated using the Lineweaver-Burk
plots. The Km gives information on the enzyme-substrate
kinetics for the biosensor and the values calculated to be at 1.89 mM. The Km value determined with the present
biosensor is comparable to the reported value using am-
perometric detection [2], where the Km of 1.5 mM is ob-
tained utilizing bienzyme system (glutamate oxidase/ glutamate dehydrogenase) immobilized using poly (car- bamoyl) sulfonate hydrogel. The reproducibility in the biosensor fabrication was also investigated at respective ammonium, MTT, NADH and α-ketoglutaric acid con- centrations of 0.25 mM, 0.30 mM, 0.20 mM and 0.15 mM and it was found to be good with a relative standard deviation (RSD) of 5.46% (n = 6).
The analytical performance of the developed optical ammonium biosensor has been compared with several biosensors. Characteristics such as technique of detection, biorecognition, linearity and limit of detection are com- pared. As shown in Table 2, the limit of detection of the
present work was comparable with several techniques [8,19] for the detection of ammonium.
3.3. Interference Studies
The response of the biosensor to the potential interferents was examined by the additions of interference substances that are possibly present in the aquatic environment such as Cu(II), Zn(II), Ag(I), Hg(II), Ca(II), Fe(II), K(I), and
. The analysis was conducted in the presence
Cl− 3 NO− 0.00 0.10 0.20 0.30 0.40 0.50
0.0 5.0 10.0 15.0 20.0 25.0 30.0 35.0 Time (min) A bs ( 565 nm )
0mM 0.1mM 0.25mM
Figure 2. The response of the biosensor towards different concentrations of ammonium (0 - 0.25 mM).
0.06 0.07 0.08 0.09 0.10 0.11 0.12 0.13 0.14
0.00 0.05 0.10 0.15 0.20
Concentration of ammonium (mM)
A b s ( 565 nm) 0.08 0.09 0.10 0.11 0.12 0.13 0.14
0.00 0.01 0.02 0.03 0.04 0.05 0.06 0.07 0.08
Concentration of ammonium (mM)
A bs ( 5 65 nm )
Table 2. Performance comparison of ammonium biosensor.
Technique Biorecognition Dynamic range (µM) Limit of detection (µM) Ref.
Amperometric GLDH 10 - 200 5 [3]
Amperometric GLDH 10 - 300 10 [8]
Fluorimetric flow assay GLDH 5 - 500 - [9]
Amperometric Ammonia oxidizing bacteria 10 - 200 >10 [19]
Continuous flow analysis Ammonia oxidizing bacteria 10 - 50 - [20]
Optical spectrophotometric Dph/GLDH 16.8 - 70 11 Present work
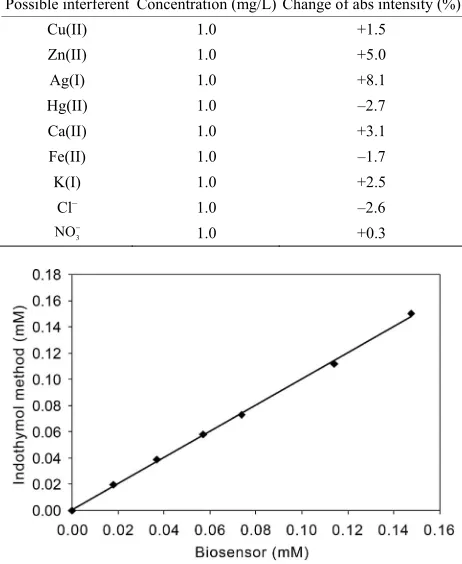
of a known concentration of ammonium and interfering ion at a ratio of 1:10 (ammonium: 0.1 mg/L, interfering ions: 1 mg/L). Figure 4 shows the change of absorbance
intensity in the presence of various interfering substances. The calculated RSD value were within the range of ±5%, which indicated that the ions Cu(II), Zn(II), Hg(II), Ca(II), Fe(II), K(I), and 3 did not show any
significant interference except for Ag(I) ions appeared to cause interference (Table 3). This may be attributed to
the inhibitory effect of this metal ion on the enzyme ac-tivity, particularly at high Ag(I) ion concentrations.
Cl− NO−
[image:5.595.279.532.100.329.2]3.4. Comparison of the Biosensor Response and Analysis of Spiked Real Samples
Figure 5 presents the results of the developed biosensor
compared with the indothymol method in the range of ammonium concentration of 0.0 - 0.15 mM. A very good agreement was observed between the biosensor and the indothymol method with slope = 0.9953 and r = 0.9984.
In order to evaluate the applicability of the biosensor to real sample analysis, various water samples from se- veral fish ponds were tested. The recovery test was per- formed by adding a known concentration of ammonium to the sample solutions. The results from these water samples are summarized in Table 4. Both the biosensor
and the indothymol methods recovered about 103% - 119% and 108% - 125% of the ammonium from the wa- ter samples, respectively. The relative standard error be- tween indothymol method and biosensor for the deter- mination of ammonium in the spiked water samples was about 3% - 11%.
Statistical analysis for comparing the two means con- centration of ammonium determined by the biosensor and the indothymol methods were tested. The t-test ap- plied to the real samples determined by the method de- scribed by Miller and Miller [21]. As shown in Table 4,
the calculated values of |t| are less than the critical value, which confirms that there is no difference between the two methods for the determination ammonium concen- tration at the 5% level. Therefore, these two methods employed for the determination of ammonium in the spiked fish pond water samples were in good agreement and comparable.
[image:5.595.306.538.423.709.2]Figure 4. Effect of the biosensor to various types of inter- ferent ions. The reaction was conducted in 50 mM phos- phate buffer solution consisting of 0.03 mM ammonium, 0.15 mM α-ketoglutaric acid, 0.3 mM MTT and 0.2 mM NADH, respectively (n = 3).
Table 3. Activity of the biosensor after reaction with dif- ferent metal ions for interference study.
Possible interferent Concentration (mg/L) Change of abs intensity (%)
Cu(II) 1.0 +1.5
Zn(II) 1.0 +5.0
Ag(I) 1.0 +8.1
Hg(II) 1.0 –2.7
Ca(II) 1.0 +3.1
Fe(II) 1.0 –1.7
K(I) 1.0 +2.5
Cl– 1.0 –2.6
3
NO− 1.0 +0.3
[image:5.595.307.538.428.710.2]369
Table 4. Determination of ammonium in spiked water samples using the indothymol method and the biosensor reported in this work.
Indothymol method (n = 3) Biosensor (n = 3)
Fish pond water samples
Added (mM) Found (mM) Recovery (%) Added (mM) Found (mM) Recovery (%) Calculated t-test
1 0.037 0.043 115.0 0.037 0.039 103.6 0.50
2 0.037 0.047 125.0 0.037 0.044 117.2 1.03
3 0.037 0.042 110.9 0.037 0.040 107.8 0.23
4 0.037 0.041 108.1 0.037 0.045 119.1 1.96
Note: the critical value, t4 = 2.78 (p = 0.05).
4. Conclusion
In this study, we demonstrated a simple and rapid method for the quantitative determination of ammonium using dual enzyme system coupled with redox indicator. In this method, the color intensity of the formazan dye produced from the enzymatic reaction was found to decrease pro- portionally with increasing of ammonium ion concentra- tion. The developed biosensor exhibits good sensitivity, selectivity, reproducibility, and it also provided an alter- native method for analysis of ammonium.
5. Acknowledgements
The authors are grateful for the financial support pro- vided by the Malaysian Government through its Ministry of Science, Technology and Innovation under Science Fund 02-03-02-SF0002.
REFERENCES
[1] F. Valentini, V. Biagiotti, C. Lete, G. Palleschi and J. Wang, “The Electrochemical Detection of Ammonia in Drinking Water Based on Multi-Walled Carbon Nano- tube/Copper Nanoparticle Composite Paste Electrodes,”
Sensors and Actuators B: Chemical, Vol. 128, No. 1, 2007, pp. 326-333. doi:10.1016/j.snb.2007.06.010
[2] R. C. H. Kwan, P. Y. T. Hon and R. Renneberg, “Ampe- rometric Determination of Ammonium with Bienzyme/Poly (Carbamoyl) Sulfonate Hydrogel-Based Biosensor,” Sen- sors and Actuators B: Chemical, Vol. 107, No. 2, 2005, pp. 616-622. doi:10.1016/j.snb.2004.11.028
[3] B. Strehlitz, B. Grundig and H. Kopinke, “Sensor for Amperometric Determination of Ammonia and Ammonia- Forming Enzyme Reactions,” Analytica Chimica Acta, Vol. 403, No. 1-2, 2000, pp. 11-23.
doi:10.1016/S0003-2670(99)00594-2
[4] K. Fukushi, H. Ito, K. Kimura, K. Yokota, K. Saito, K. Chayama, S. Takeda and S. Wakida, “Determination of Ammonium in River Water and Sewage Samples by Ca- pillary Zone Electrophoresis with Direct UV Detection,”
Journal of Chromatography A, Vol. 1106, No. 1-2, 2006, pp. 61-66. doi:10.1016/j.chroma.2005.10.054
[5] Q. P. Li, J. Z. Zhang, F. J. Millero and D. A. Hansell, “Continuous Colorimetric Determination of Trace Ammo- nium in Seawater with a Long-Path Liquid Waveguide Capillary Cell,” Marine Chemistry, Vol. 107, No. 1-2,
2005, pp. 73-85. doi:10.1016/j.marchem.2004.12.001 [6] K. T. Lau, S. Edwards and D. Diamond, “Solid-State
Ammonia Sensor Based on Berthelot’s Reaction,” Sen- sors and Actuators B: Chemical, Vol. 98, No. 1, 2004, pp. 12-17. doi:10.1016/j.snb.2003.08.004
[7] A. K. Abbas, J. P. Hart, D. C. Cowell and A. Chappell, “Development of an Amperometric Assay for NH4+ Based on a Chemically Modified Screen-Printed NADH,”
Analytica Chimica Acta, Vol. 373, No. 1, 1998, pp. 1-8. doi:10.1016/S0003-2670(98)00368-7
[8] P. Bertocchi and D. Compagnone, “Amperometric Ammo- nium Ion and Urea Determination with Enzyme-Based Probes,” Biosensors and Bioelectronics, Vol. 11, No. 1-2, 1996, pp. 1-10. doi:10.1016/0956-5663(96)83708-0 [9] R. Quiles, J. M. F. Romero, E. Fernandez and M. D. L.
Castro, “Continuous Flow Assay of Ammonia in Plasma Using Immobilized Enzymes,” Analytica Chimica Acta, Vol. 294, No. 1, 1996, pp. 43-47.
doi:10.1016/0003-2670(94)85044-5
[10] S. Hashimoto, H. Y. Sun, A. Otsuki, S. Kawakama and M. Yokomizo, “Enzymatic Determination of Ammonia in Lake Water Using a Semi-Automatic Analyser,” Inter- national Journal of Environmental Analytical Chemistry, Vol. 48, No. 3-4, 1992, pp. 155-161.
doi:10.1080/03067319208027396
[11] H. Jaegfelt, A. B. C. Torstensson, L. Gorton and G. Johansson, “Catalytic Oxidation of Reduced Nicotina- mide Adenine Dinucleotide by Graphite Electrodes Modi- fied with Adsorbed Aromatics Containing Catechol Func- tionalities,” Analytical Chemistry, Vol. 53, No. 13, 1981, pp. 1979-1982. doi:10.1021/ac00236a007
[12] J. Moiroux and P. J. Elving, “Adsorption Phenomena in the NAD+/NADH System at Glassy Carbon Electrodes,”
Journal of Electroanalytical Chemistry, Vol. 102, No. 1, 1979, pp. 93-108. doi:10.1016/S0022-0728(79)80033-9 [13] E. Wang, L. Zhu, L. Ma and H. Patel, “Optical Sensors
for Sodium, Potassium and Ammonium Ions Based on Lipophilic Fluorescein Anionic Dye and Neutral Carri-ers,” Analytica Chimica Acta, Vol. 357, No. 1-2, 1997, pp. 85-90. doi:10.1016/S0003-2670(97)00532-1
[14] Y. M. Martinez, R. H. Hernandez and P. C. Falco, “Im-proved Detection Limit for Ammonium/Ammonia Ach- ieved by Berhelot’s Reaction by Use of Solid-Phase Ex-traction Coupled to Diffuse Reflectance Spectroscopy,”
Analytica Chimica Acta, Vol. 534, No. 2, 2005, pp. 327- 334. doi:10.1016/j.aca.2004.11.044
“Enzymatic Assay of Dehydrogenase Substrate Based on the Detection of Superoxide Anion,” Food Research In-ternational, Vol. 34, No. 5, 2001, pp. 393-399.
doi:10.1016/S0963-9969(00)00183-6
[16] N. E. Azmi, J. Abdullah, M. Ahmad, L. Y. Heng, H. Sidek and K. Nadarajah, “Biosensor Based on Glutamate Dehydrogenase Immobilized in Chitosan for the Deter- mination of Ammonium in Water Samples,” Analytical Biochemistry, Vol. 388, No. 1, 2009, pp. 28-32. doi:10.1016/j.ab.2009.02.005
[17] P. Odman, W. B. Wellborn and A. S. Bommarius, “An Enzymatic Process to α-Ketoglutarate from L-Glutamate: the Coupled System L-Glutamate Dehydrogenase/NADH Oxidase,” Tetrahedron: Assymetry, Vol. 15, No. 18, 2004, pp. 2933-2937. doi:10.1016/j.tetasy.2004.07.055
[18] B. Kuswandi, Nuriman, H. H. Dam, D. N. Reinhoud and
W. Verboom, “Development of a Disposable Mercury Ion-Selective Optode Based on Trityl-Picolinamide as Ionophore,” Analytica Chimica Acta, Vol. 591, No. 2, 2007, pp. 208-213. doi:10.1016/j.aca.2007.03.064 [19] A. Bollmann and N. P. Revsbech, “An NH4+ Biosensor
Based on Ammonia-Oxidizing Bacteria for Use under Anoxic Conditions,” Sensor and Actuators B, Vol. 105, No. 2, 2005, pp. 412-418. doi:10.1016/j.snb.2004.06.030 [20] W. D. Boer, P. A. K. Gunnewiek and H. J. Laanbroek,
“Ammonium-Oxidation at Low pH by a Chemolithotro-phic Bacterium Belonging to the Genus Nitrosospira,”
Soil Biology Biochemistry, Vol. 27, No. 2, 1995, pp. 127-132. doi:10.1016/0038-0717(94)00157-V