ISSN: 2302-9285, DOI: 10.11591/eei.v9i3.1971 1260
Classification of batik patterns using K-Nearest
neighbor and support vector machine
Agus Eko Minarno, Fauzi Dwi Setiawan Sumadi, Hardianto Wibowo, Yuda Munarko Informatics Engineering, Universitas Muhammadiyah Malang, Indonesia
Article Info ABSTRACT
Article history: Received Aug 1, 2019 Revised Nov 4, 2019 Accepted Dec 10, 2020
This study is proposed to compare which are the better method to classify Batik image between K-Nearest neighbor and Support Vector Machine using minimum features of GLCM. The proposed steps are started by converting image to grayscale and extracting colour feature using four features of GLCM. The features include Energy, Entropy, Contras, Correlation and 0o, 45o, 90o, and 135o. The classifier features consist of 16 features in total. In the experimental result, there exist comparison of previous works regarding the classification KNN and SVM using multi texton histogram (MTH). The experiments are carried out in the form of calculation of accuracy with data sharing and cross-validation scenario. From the test results, the average accuracy for KNN is 78.3% and 92.3% for SVM in the cross-validation scenario. The scenario for the highest accuracy of data sharing is at 70% for KNN and at 100% for SVM. Thus, it is apparent that the application of the GLCM and SVM method for extracting and classifying batik motifs has been effective and better than previous work.
Keywords: Batik
Gray level co-occurrence matrix (GLCM)
Image processing KNN
SVM
This is an open access article under the CC BY-SA license.
Corresponding Author: Agus Eko Minarno, Informatics Engineering,
Universitas Muhammadiyah Malang, Indonesia. Email: [email protected]
1. INTRODUCTION
Indonesia is famous for its arts and culture which are spread throughout the territory of Indonesia, by which each region has different arts and cultures, due to a diverse situation, condition and environment. One of the famous works of arts originating from Indonesia is prominently known as batik, identified as a traditional pattern on cloth drawn with traditional methods. In Javanese, batik means drawing a point on a cloth, as it is derived from the words: “ngembat” (writing) and “titik” (dot) [1]. Batik as one of the famous arts and cultures originating from Indonesia has its own characteristics depending on its place of origin. Unfortunately, most Indonesian wear batik motifs due to its attracting colour and pattern without knowing the name of the used motif, the origin of the motif, or the philosophy contained in the motif due to a wide range of batik patterns in Indonesia.
Several studies have been conducted previously for pattern recognition and image classification both for image retrieval and image classification system [2-4]. Kurniawardhani et al. [5] proposed an invariant feature extraction method for rotation by using the combination of extraction method, which compared the method of combining LBPROT-CLBP_M with LBPROT-CRLBP_M. From the results of the research, the LBPROT-CRLBP_M method could increase the accuracy by approximately 30% with a maximum accuracy of 90%. The other issue about classification using KNN was also proposed by [6, 7]. Minarno et al. [8] combining the grey level co-occurrence matrix (GLCM) method with discrete wavelet transform (DWT) to classify batik images, which were named as co-occurence matrix of sub-band images.
Arebey et al. [9] used the GLCM, KNN and multi-layer perception (MLP) methods to detect and classify solid waste levels. From the results of the research, the KNN method gave better results compared to the MLP method. Nurhida et al. [10] compared the performance of the GLCM method, Canny Edge Detection, and Gabor for extraction of batik features, showing that the GLCM method had the best performance with classification accuracy reaching 80%. Minarno et al. [11] compared performance for precision and recall among the GLCM method, multi texton histogram (MTH), MTH + GLCM and the multi texton co-occurrence descriptor (MTCD). Meanwhile, Fahrurozi et al. [12] combined the GLCM method with several edge detection methods to perform feature extraction on wood fibres. Chai et al. [13] applied the GLCM method to identify fractures in the bone, gaining accuracy of 86.67%. In addition, research conducted by [14-16] used the GLCM method as feature extraction. Raheja et al. [17] used the GLCM method to detect defects in fabric. Mitrea et al. [18] used the GLCM method in diagnosing liver tumours in ultrasound images. Fakhira et al using SVM to classify knots timber using 400 x-ray dataset and the highest accuracy is 76%.
This study is proposed to compare which are the better method to classify Batik image between K-Nearest neighbor and support vector machine using minimum features of GLCM. The proposed steps are started by converting image to grayscale and extracting colour feature using four features of GLCM. The features include Energy, Entropy, Contras, Correlation and 0o, 45o, 90o and 135o. The total features utilized on the classifier are 16 features. In the experimental result, the authors compared the previous work of classification KNN and SVM using multi texton histogram [19]. The experimental result showed combination GLCM and SVM is better than previous work.
2. DATASET
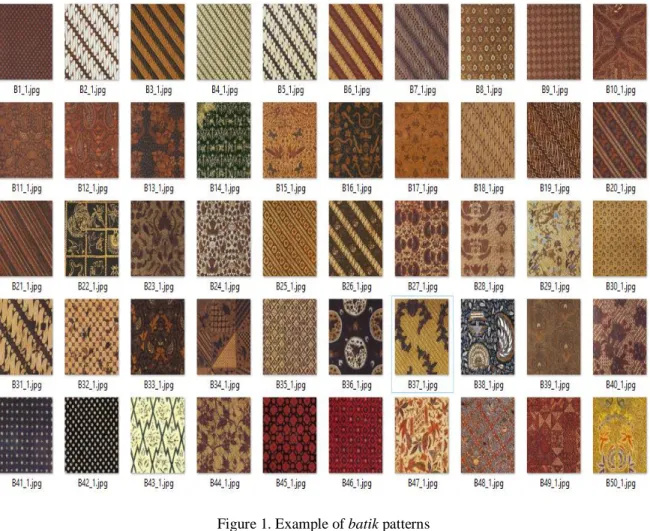
This study applies a dataset of batik motif images with a total of 300 images. There are 50 classes in the dataset, which consist of 6 batik motif images in each set (with the size of each picture of 180x180 pixels). Figure 1 provides an example of a batik motif image utilized in this paper.
3. GRAY LEVEL CO-OCCURENCE MATRIX (GLCM)
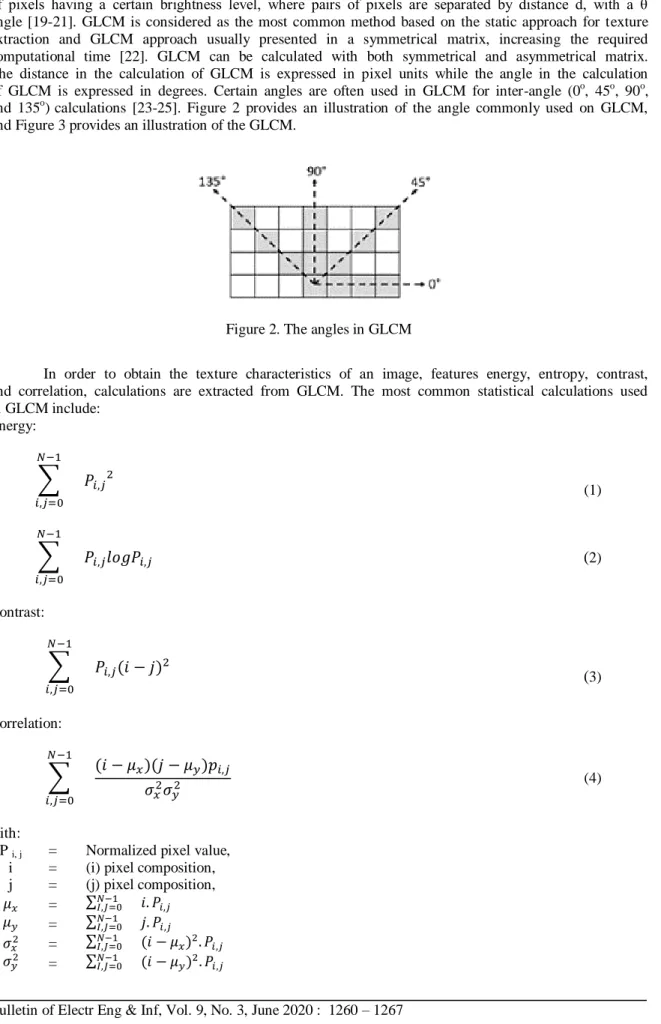
Gray level co-occurrence matrix (GLCM)is defined as a matrix whose elements consist of pairs of pixels having a certain brightness level, where pairs of pixels are separated by distance d, with a θ angle [19-21]. GLCM is considered as the most common method based on the static approach for texture extraction and GLCM approach usually presented in a symmetrical matrix, increasing the required computational time [22]. GLCM can be calculated with both symmetrical and asymmetrical matrix. The distance in the calculation of GLCM is expressed in pixel units while the angle in the calculation of GLCM is expressed in degrees. Certain angles are often used in GLCM for inter-angle (0o, 45o, 90o, and 135o)calculations [23-25]. Figure 2 provides an illustration of the angle commonly used on GLCM, and Figure 3 provides an illustration of the GLCM.
Figure 2. The angles in GLCM
In order to obtain the texture characteristics of an image, features energy, entropy, contrast, and correlation, calculations are extracted from GLCM. The most common statistical calculations used in GLCM include: Energy: ∑ 𝑁−1 𝑖,𝑗=0 𝑃𝑖,𝑗2 (1) ∑ 𝑁−1 𝑖,𝑗=0 𝑃𝑖,𝑗𝑙𝑜𝑔𝑃𝑖,𝑗 (2) Contrast: ∑ 𝑁−1 𝑖,𝑗=0 𝑃𝑖,𝑗(𝑖 − 𝑗)2 ( 3) Correlation: ∑ 𝑁−1 𝑖,𝑗=0 (𝑖 − 𝜇𝑥)(𝑗 − 𝜇𝑦)𝑝𝑖,𝑗 𝜎𝑥2𝜎 𝑦2 (4) with:
P i, j = Normalized pixel value,
i = (i) pixel composition, j = (j) pixel composition, 𝜇𝑥 = ∑𝑁−1𝐼,𝐽=0 𝑖. 𝑃𝑖,𝑗 𝜇𝑦 = ∑𝑁−1𝐼,𝐽=0 𝑗. 𝑃𝑖,𝑗
𝜎𝑥2 = ∑𝑁−1𝐼,𝐽=0 (𝑖 − 𝜇𝑥)2. 𝑃𝑖,𝑗 𝜎𝑦2 = ∑𝑁−1𝐼,𝐽=0 (𝑖 − 𝜇𝑦)2. 𝑃𝑖,𝑗
The extraction of features as applied in this paper uses GLCM method as illustrated in Figure 3. This stage aims to get the features contained in batik images as displayed in the histogram. In the first stage as presented in Figure 4, batik image which originally has an RGB colour model changes to a grayscale image, having one channel value in each pixel, with the equal values on the Red, Green, and Blue channels. After grayscale image is obtained in the 2nd stage, the image is quantized to 16 bins to reduce the burden of the computational process. The extracts of GLCM feature at an angle of 0o, 45o, 90o, and 135o is obtained in the 3rd stage. Finally, in the 4th stage, the features are stored on the histogram.
Figure 3. Illustration of GLCM, (a) Original image, (b) Pixel address, (c) GLCM matrix, (d) GLCM normalization matrix
Figure 5(a) illustrates one of the images as used in this paper, with a size of 180x180 pixels. Figure 5(b) presents the result of the grayscale process as carried out in Figure 5, to be used in the quantization process. Figure 5(c) provides the result of the quantization process as carried out in Figure 5. In this paper, the grayscale image is quantized to 16 bin to achieve the pixel value of 0-15.
Figure 6 depicts the histogram result of GLCM feature extraction in sequential order from the left to the right (angle energy 0 (1), contrast angle 0 (2), entropy of angle 0 (3), correlation angle 0 (4), angle energy 45 (5), angle contrast 45 (6), angle entropy 45 (7), correlation angle 45 (8), angle energy 90 (9), contrast angle 90 (10), entropy angle 90 (11), correlation angle 90 (12), energy angles 135 (13), contrast angles 135 (14), entropy angles 135 (15), and angular correlations 135 (16)). The extracted features that have been obtained are applied for the classification process.
(a) (b) (c)
Figure 5. (a) Batik image, (b) Batik grayscale image, (c) Batik quantization image
Figure 6. An example GLCM histogram features of batik image in Figure 5
4. PERFORMANCE MEASUREMENT
This study applies the calculation of accuracy to measure the performance of the system which has been built with:
𝐴𝑐𝑐𝑢𝑟𝑎𝑐𝑦 = 𝑚
𝑛. 100% (5)
with:
m = Total correct tested data, n = Total tested data
5. RESULT AND DISCUSSION
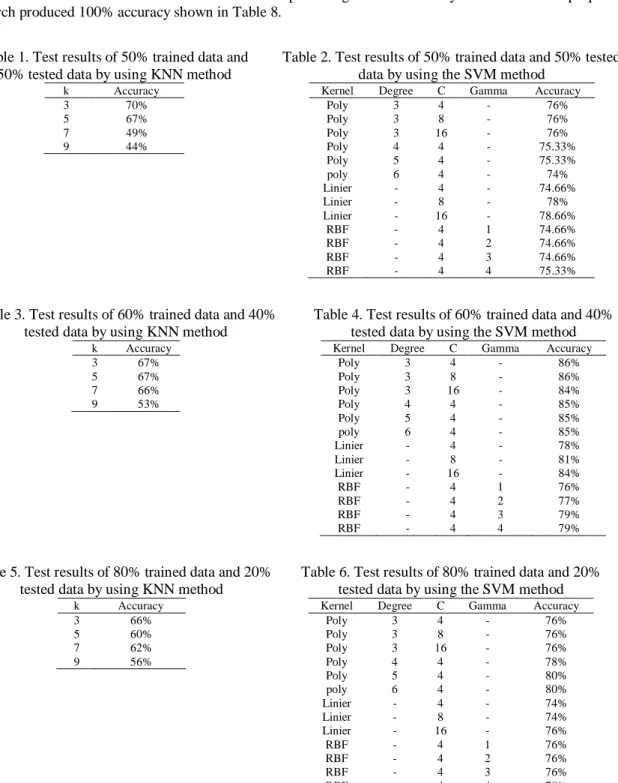
In the first test, 300 data sets of batik motifs are divided into 50% (150 images) as trained data and 50% (150 images) as tested data. Table 1 and Table 2 depict the results of shared data testing (50:50). In the second test, 300 data sets of batik motifs are divided into 60% (200 images) as trained data and 40%
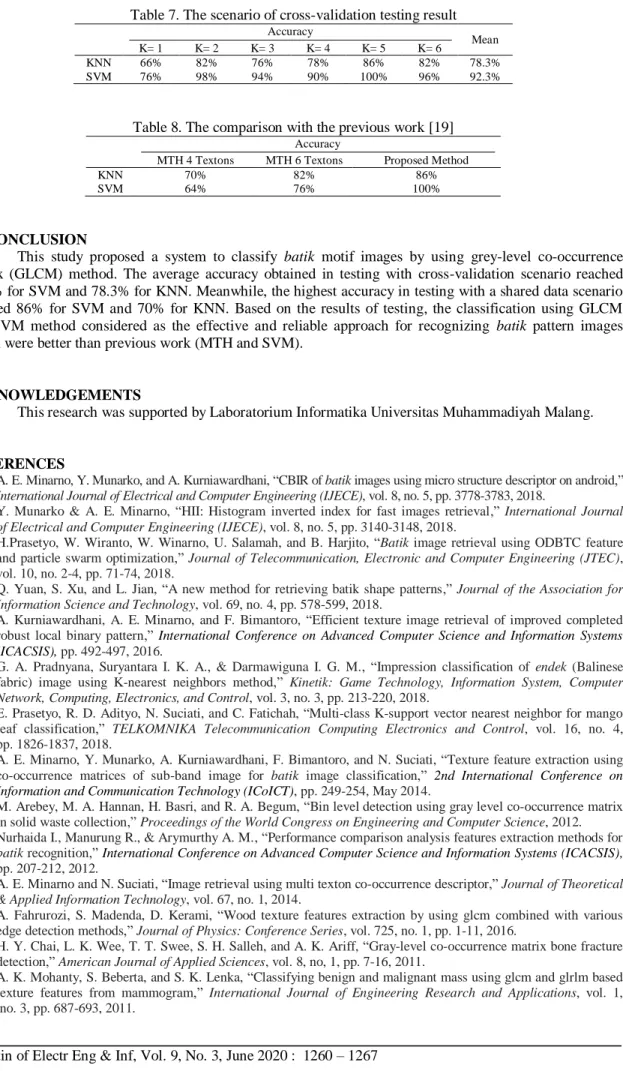
(100 images) as tested data. Table 3 and Table 4 show the results of shared data testing (60:40). In the third test, 300 data sets of batik motifs are divided into 80% (250 images) as trained data and 20% (50 images) as tested data. Table 5 and Table 6 presents the results of shared data testing (80:20). The fourth test using cross-validation for KNN classification method was conducted by using the parameter of K=1 until K=6, while for the classification method was performed by using kernel parameter=polynomial with a degree of=3 and c=4 showed in Table 7.
The results of testing as performed by the system or application to classify batik motifs are achieved through GLCM method, whose features is extracted from batik motif images, comprising of energy, entropy, contrast, and correlation at 0o, 45o, 90o, and 135o which requires an extracting time for the GLCM features with the classification process in 20 seconds. The testing using the cross-validation (K-Fold) scenario, the highest accuracy of KNN algorithm is pointed at 86% with K 5 and pointed at 100% with K 5 in SVM algorithm. Previous research used the MTH feature to classify Batik. The classifiers included SVM and KNN. The testing of the previous studies compared between 4 textons and 6 textons using SVM and KNN. The best results were KNN with 6 textons producing the best accuracy of 82% while the proposed research produced 100% accuracy shown in Table 8.
Table 1. Test results of 50% trained data and 50% tested data by using KNN method
Table 2. Test results of 50% trained data and 50% tested data by using the SVM method
k Accuracy 3 70% 5 67% 7 49% 9 44%
Kernel Degree C Gamma Accuracy Poly 3 4 - 76% Poly 3 8 - 76% Poly 3 16 - 76% Poly 4 4 - 75.33% Poly 5 4 - 75.33% poly 6 4 - 74% Linier - 4 - 74.66% Linier - 8 - 78% Linier - 16 - 78.66% RBF - 4 1 74.66% RBF - 4 2 74.66% RBF - 4 3 74.66% RBF - 4 4 75.33%
Table 3. Test results of 60% trained data and 40% tested data by using KNN method
Table 4. Test results of 60% trained data and 40% tested data by using the SVM method
k Accuracy 3 67% 5 67% 7 66% 9 53%
Kernel Degree C Gamma Accuracy Poly 3 4 - 86% Poly 3 8 - 86% Poly 3 16 - 84% Poly 4 4 - 85% Poly 5 4 - 85% poly 6 4 - 85% Linier - 4 - 78% Linier - 8 - 81% Linier - 16 - 84% RBF - 4 1 76% RBF - 4 2 77% RBF - 4 3 79% RBF - 4 4 79%
Table 5. Test results of 80% trained data and 20% tested data by using KNN method
Table 6. Test results of 80% trained data and 20% tested data by using the SVM method
k Accuracy 3 66% 5 60% 7 62% 9 56%
Kernel Degree C Gamma Accuracy Poly 3 4 - 76% Poly 3 8 - 76% Poly 3 16 - 76% Poly 4 4 - 78% Poly 5 4 - 80% poly 6 4 - 80% Linier - 4 - 74% Linier - 8 - 74% Linier - 16 - 76% RBF - 4 1 76% RBF - 4 2 76% RBF - 4 3 76% RBF - 4 4 78%
Table 7. The scenario of cross-validation testing result Accuracy Mean K= 1 K= 2 K= 3 K= 4 K= 5 K= 6 KNN 66% 82% 76% 78% 86% 82% 78.3% SVM 76% 98% 94% 90% 100% 96% 92.3%
Table 8. The comparison with the previous work [19]
Accuracy
MTH 4 Textons MTH 6 Textons Proposed Method
KNN 70% 82% 86%
SVM 64% 76% 100%
6. CONCLUSION
This study proposed a system to classify batik motif images by using grey-level co-occurrence matrix (GLCM) method. The average accuracy obtained in testing with cross-validation scenario reached 92.3% for SVM and 78.3% for KNN. Meanwhile, the highest accuracy in testing with a shared data scenario reached 86% for SVM and 70% for KNN. Based on the results of testing, the classification using GLCM and SVM method considered as the effective and reliable approach for recognizing batik pattern images which were better than previous work (MTH and SVM).
ACKNOWLEDGEMENTS
This research was supported by Laboratorium Informatika Universitas Muhammadiyah Malang.
REFERENCES
[1] A. E. Minarno, Y. Munarko, and A. Kurniawardhani, “CBIR of batik images using micro structure descriptor on android,” International Journal of Electrical and Computer Engineering (IJECE), vol. 8, no. 5, pp. 3778-3783, 2018.
[2] Y. Munarko & A. E. Minarno, “HII: Histogram inverted index for fast images retrieval,” International Journal of Electrical and Computer Engineering (IJECE), vol. 8, no. 5, pp. 3140-3148, 2018.
[3] H.Prasetyo, W. Wiranto, W. Winarno, U. Salamah, and B. Harjito, “Batik image retrieval using ODBTC feature and particle swarm optimization,” Journal of Telecommunication, Electronic and Computer Engineering (JTEC), vol. 10, no. 2-4, pp. 71-74, 2018.
[4] Q. Yuan, S. Xu, and L. Jian, “A new method for retrieving batik shape patterns,” Journal of the Association for Information Science and Technology, vol. 69, no. 4, pp. 578-599, 2018.
[5] A. Kurniawardhani, A. E. Minarno, and F. Bimantoro, “Efficient texture image retrieval of improved completed robust local binary pattern,” International Conference on Advanced Computer Science and Information Systems (ICACSIS), pp. 492-497, 2016.
[6] G. A. Pradnyana, Suryantara I. K. A., & Darmawiguna I. G. M., “Impression classification of endek (Balinese fabric) image using K-nearest neighbors method,” Kinetik: Game Technology, Information System, Computer Network, Computing, Electronics, and Control, vol. 3,no.3, pp. 213-220, 2018.
[7] E. Prasetyo, R. D. Adityo, N. Suciati, and C. Fatichah, “Multi-class K-support vector nearest neighbor for mango leaf classification,” TELKOMNIKA Telecommunication Computing Electronics and Control, vol. 16, no. 4, pp. 1826-1837, 2018.
[8] A. E. Minarno, Y. Munarko, A. Kurniawardhani, F. Bimantoro, and N. Suciati, “Texture feature extraction using co-occurrence matrices of sub-band image for batik image classification,” 2nd International Conference on Information and Communication Technology (ICoICT), pp. 249-254, May 2014.
[9] M. Arebey, M. A. Hannan, H. Basri, and R. A. Begum, “Bin level detection using gray level co-occurrence matrix in solid waste collection,” Proceedings of the World Congress on Engineering and Computer Science, 2012. [10] Nurhaida I., Manurung R., & Arymurthy A. M., “Performance comparison analysis features extraction methods for
batik recognition,” International Conference on Advanced Computer Science and Information Systems (ICACSIS), pp. 207-212, 2012.
[11] A. E. Minarno and N. Suciati, “Image retrieval using multi texton co-occurrence descriptor,” Journal of Theoretical & Applied Information Technology, vol. 67, no.1, 2014.
[12] A. Fahrurozi, S. Madenda, D. Kerami, “Wood texture features extraction by using glcm combined with various edge detection methods,” Journal of Physics: Conference Series, vol. 725, no. 1, pp. 1-11, 2016.
[13] H. Y. Chai, L. K. Wee, T. T. Swee, S. H. Salleh, and A. K. Ariff, “Gray-level co-occurrence matrix bone fracture detection,” American Journal of Applied Sciences, vol. 8, no, 1, pp. 7-16, 2011.
[14] A. K. Mohanty, S. Beberta, and S. K. Lenka, “Classifying benign and malignant mass using glcm and glrlm based texture features from mammogram,” International Journal of Engineering Research and Applications, vol. 1, no.3, pp. 687-693, 2011.
[15] N. Zulpe and V. Pawar, “Glcm textural features for brain tumor classification,” Int. J. Comput. Sci, vol. 9, no. 3, pp. 354-359, 2012.
[16] R. Hudec, and M. Benco, “Novel method for color textures features extraction based on Glcm,” Radioengineering, vol. 16, no. 4, pp. 64-67, 2007.
[17] J. L. Raheja, S. Kumar, and A. Chaudhary, “Fabric defect detection based on Glcm and gabor filter: A comparison,” Optik-International Journal for Light And Electron Optics, vol. 124, no. 23, pp. 6469-6474, 2013. [18] Mitrea D., Socaciu M., Badea R., & Nedevschi S., “The role of the superior order Glcm in the characterization
and recognition of the liver tumors from ultrasound images,” Radioengineering, vol. 21, no. 1, pp.79-85,2012. [19] A. E. Minarno, A. S. Maulani, A. Kurniawardhani, F. Bimantoro, and N. Suciati, “Comparison of methods for batik
classification using multi texton histogram,” TELKOMNIKA Telecommunication Computing Electronics and Control, vol. 16, no. 3, pp. 1358-1366, 2018.
[20] A. E. Minarno, A. Kurniawardhani, and F. Bimantoro, “Image retrieval based on multi structure co-occurrence descriptor,” TELKOMNIKA Telecommunication Computing Electronics and Control, vol. 14, no. 3, pp. 252-258, 2016.
[21] H. Wibowo, E. M. Yuniarno, A. Widayati, and M. H. Purnomo, “Frontalis muscle strength calculation based on 3D
image using gray level co-occurrence matrix (GLCM) and confidence interval,” TELKOMNIKA
Telecommunication Computing Electronics and Control, vol. 16, no. 1, pp. 368-375, 2018.
[22] N. D. Abdullah, U. R. A. Hashim, S. Ahmad, and L. Salahuddin, “Analysis of texture features for wood defect classification,” Bulletin of Electrical Engineering and Informatics, vol. 9, no. 1, pp. 121-128, 2020.
[23] F. I. M. Redzuan and M. Yusoff, “Knots timber detection and classification with c-support vector machine,” Bulletin of Electrical Engineering and Informatics, vol. 8, no. 1, pp. 246-252, 2019.
[24] E. M. Yuniarno and M. H. Purnomo, “Indonesian batik image classification using statistical texture feature extraction gray level co-occurrence matrix (GLCM) and learning vector quantization (LVQ),” Journal of Telecommunication, Electronic and Computer Engineering (JTEC), vol. 10, no. 2-3, pp. 67-71, 2018.
[25] N. Sulistianingsih, I. Soesanti, and R. Hartanto, “Classification of batik image using grey level co-occurrence matrix feature extraction and correlation based feature selection,” International Seminar on Research of Information Technology and Intelligent Systems (ISRITI) IEEE, pp. 492-497, 2018.