DOCUMENT DE TREBALL
XREAP2018-3
MACHINE LEARNING FORECASTS OF
PUBLIC TRANSPORT DEMAND: A
COMPARATIVE ANALYSIS OF SUPERVISED
ALGORITHMS USING SMART CARD DATA
Machine Learning Forecasts of Public Transport
Demand:
A comparative analysis of supervised algorithms using
smart card data
Sebastián M. Palacio
1University of Barcelona
Abstract
Public transport smart cards are widely used around the world. However, while they provide information about various aspects of passenger behavior, they have not been properly exploited to predict demand. Indeed, traditional methods in economics employ linear unbiased estimators that pay little attention to accuracy, which is the main problem faced by the sector’s regulators. This paper reports the application of various supervised machine learning (SML) techniques to smart card data in order to forecast demand, and it compares these outcomes with traditional linear model estimates. We conclude that the forecasts obtained from these algorithms are much more accurate.
Introduction
The use of smart cards is becoming increasingly popular on public transport services. They are especially convenient for users as they reduce their transactional costs and boarding times, whereas for bus companies, they enable them to plan their schedules more effectively, improve commercial bus speeds, while indirectly they allow them to reduce personnel and maintenance costs. But the cards have a further advantage that has yet to be exploited: they provide massive amounts of information ranging from tariffs to GPS-generated mobility patterns. Such a rich seam of data, if mined properly, should have great policy implications for public transportation authorities, sector regulators, transport operators and other interested parties, as well as the public in general.
Many recent studies stress the potential of smart card data as a tool for transport management and planning (Utsunomiya et al. 2006; Pelletier et al. 2011). Here, a particularly interesting dimension of analysis is that of estimating demand given that smart cards record the commuting characteristics of each passenger, including data about travel dates, time of day, origin and destination, journey times, etc. Indeed, if transport authorities and regulators could
1 The author would like to thank to Joan-Ramon Borrell for constructive criticism of
exploit this demand information, they would be able to optimize the transport network as a whole.
To date, few studies have resorted to the use of smart cards for their input data. Those that have include Seaborn et al. (2009), Munzinga et al. (2012), Tao et al. (2014), Tao et al. (2016) and Haibo et al. (2016). One of the most innovative examples is provided by Arana et al. (2014) who analyze smart card data to predict demand. They use multiple linear regression analysis to assess the impact of weather conditions on the number of trips taken and the underlying motives for these trips.
However, most analyses in the literature employ linear models, which means they make demand predictions using techniques that are better suited for finding causal relationships. In this study, our focus is very clearly on methods that enhance prediction capabilities as opposed to the assessment of marginal effects on target variables. Moreover, linear models fail to take into account the importance of performance in terms of out-of-sample errors. Their focus on in-sample data is not an optimal approach to forecasting demand. Here, in contrast, we highlight the importance of testing a prediction model with out-of-sample data, given that the results of a forecast and the fulfillment of actual events may differ.
The objectives of this paper can therefore be clearly stated. First, we present various supervised machine learning (SML) techniques for predicting public transport demand using smart card data. SML techniques train models using historical data in such a way that they learn from the patterns that emerge. However, more importantly, machine learning techniques are validated with test data so that their real predictive power can be determined. Second, we then compare these results to ordinary least squares (OLS) outcomes to determine the gain in accuracy achieved with SML techniques.
In short, we return to the discussion initiated by Kleinberg et al. (2015) and address the critical problem in empirical policy research where causal inference is not central or even necessary. The question that Kleinberg (2015) raises here is fundamental: what is the best technique for making predictions?
It is our contention that machine learning (ML) techniques are particularly effective in this regard. This branch of computer science, which gained popularity in the 1980s, has recently been successfully employed in several fields thanks to a number of technological advances. These, combined with the development of new, more efficient programming languages, have drastically reduced the computational time. We favor the application of ML algorithms over more traditional techniques simply because most empirical approaches are not accurate enough in their forecasts. We seek to focus our attention more fully on the target variable and on the accuracy of the prediction, and not on dependent variables and their causal effect. We also strive to obtain better performance in the measurement error. In this sense, traditional empirical methods are not optimal, given that they focus solely on unbiasedness. OLS, for example, is just one of many possible estimators, and is by definition the best linear unbiased estimator.
It follows, therefore, that ML algorithms are specifically designed for making predictions, while OLS models are not. Moreover, ML are able to exploit several data types and
complexities. But perhaps their main advantage is the fact that computers can be programmed to learn from data, revealing previously hidden findings as they discover historical relationships and trends. ML techniques can improve the accuracy of predictions by removing noise and by taking into account many types of estimation, although not necessarily without bias. Moreover, ML allows for a wide range of data, even when we have more predictors than observations, and it admits almost every type of functional form when using decision trees, ensuring a large interaction depth between variables. Of course, the downside of ML techniques is biased coefficients; however, if our main concern is the accuracy of the prediction, then any concerns regarding biased estimators become irrelevant. Thus, given that the literature informs us that SML methods are better than traditional econometric techniques for predicting demand, our hypothesis is that this should be illustrated in transport demand predictions based on data retrieved from smart cards. Here, we study the case of the Autonomous City of Buenos Aires (CABA in its Spanish acronym), the capital city of Argentina. We analyze the use of the SUBE (Sistema Único de Boleto Electrónico), a smart card employed on the city’s public transport services (train, metro and bus) since 2009, and which has now been extended for use throughout the country. The card (similar in many respects to a credit card) collects multiple details about travelers and the journeys they make, and provides information about the location of vehicles using GPS and is, therefore, an extremely rich and reliable source of information.
This paper makes two main contributions to the literature. First, we apply big data techniques (that is, ML) to public transport data. These algorithms, of frequent application in other areas, when used in the transport sector, show substantial improvements on previous forecasts. Second, we show the greater potential of ML techniques for making predictions in comparison to those obtained using traditional econometric estimations.
In short, we present a broad overview of the benefits of the application of SML automated tools for exploiting public transport smart card data, and, in so doing, we contribute to the discussion on the trade-off between precision and causality, and why this is fundamental for empirical predictions.
Case study
Public transport in CABA is provided in an integrated system that combines urban buses – starting and terminating within the city’s limits – with suburban buses – starting (terminating) in CABA and terminating (starting) in another district, an incipient underground metro network and inter-city trains.
Figure 1 shows that 80% of all trips are made by bus, with the train operating primarily as a feeder from the suburbs, which means it cannot be considered a real competitor. Given, therefore, the predominance of the bus as the main public transport service, the analysis we undertake herein focuses exclusively on this particular transport mode.
Fig. 1: Domiciliary Mobility Survey (2013)
Figure 2 shows the routes taken by buses in real time one day in March 2016 at 08:00 a.m. On average, there are 1,271 travelers per hour per bus route and, within the analyzed time period, there are approximately 32 active bus routes. Each month, an average of 20-30 million trips are registered.
Fig. 2: Location of CABA
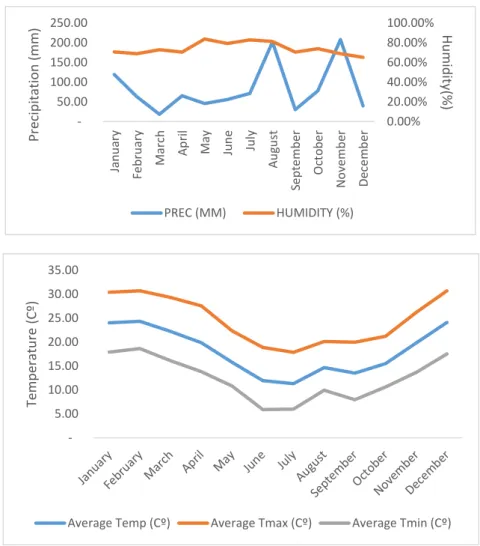
In general, CABA has a temperate climate, without any extreme temperatures. The city is sited on the Río de La Plata, and so humidity levels are quite high (around 70-80%). In summer, the average temperature oscillates around 25 ºC and in winter around 10 ºC. Figure 3 shows that during midsummer rain is abundant.
0% 20% 40% 60% 80% 100%
Subway Train Buses
Fig. 3: Weather Conditions in CABA (source INTA)
Data
4.1 SUBE
We use data from the SUBE, sorted primarily by bus route and by hour during the period that extends from September 2013 to June 2016. It should be borne in mind that the bus system has undergone no modifications or developments since 2012, in accordance with Ministerial Resolution 422/12. This means that during the period analyzed, the system’s supply did not vary in terms of routes, vehicles, frequency of services or quality (all buses being identical as they have to respect the technical specifications stipulated under provincial law). In addition, use of the SUBE is obligatory for all companies and it is not possible to use an alternative form of payment. These facts are significant with regards to potential problems of endogeneity, given that we seek to predict demand. Furthermore, note that competition between firms operating the system is meaningless because the government controls not only their costs but their profits too (as well as defining service quality and quantity and fares).
0.00% 20.00% 40.00% 60.00% 80.00% 100.00% 50.00 100.00 150.00 200.00 250.00 Jan u ary Fe b ru ary Mar ch A p ri l May Jun e Ju ly A u gu st Se p te mb er O ct o b e r N o ve mb er De ce m b er H u m id ity (% ) Prec ip ita tio n (mm ) PREC (MM) HUMIDITY (%) 5.00 10.00 15.00 20.00 25.00 30.00 35.00 Te m p era tu re (C º)
4.2 Weather
All data concerning weather conditions are provided by the nearest climate stations, under the management of INTA (National Institute of Agricultural Technology). There are three monitoring stations in the study area that report climate data every fifteen minutes. Several spectra of variables are available, but we use those of temperature, wind and precipitation so that we can compare our outcomes with those of Arana et al. (2014).
To avoid scale problems with the algorithm that we present below, we normalize the whole dataset2.
Methodology and Results
3.1 OLS Regression
Given that our main objective is to provide better prediction tools of actual performance, we focus our study on accuracy (as opposed to bias). To complete the comparative analysis, we take as our starting point the predictive study reported by Arana et al. (2014), which undertook a multiple linear regression analysis, using smart card and weather data, to predict demand. Here, we also introduce a number of additional considerations not considered in Arana et al. (2014), which enriches our estimations considerably.
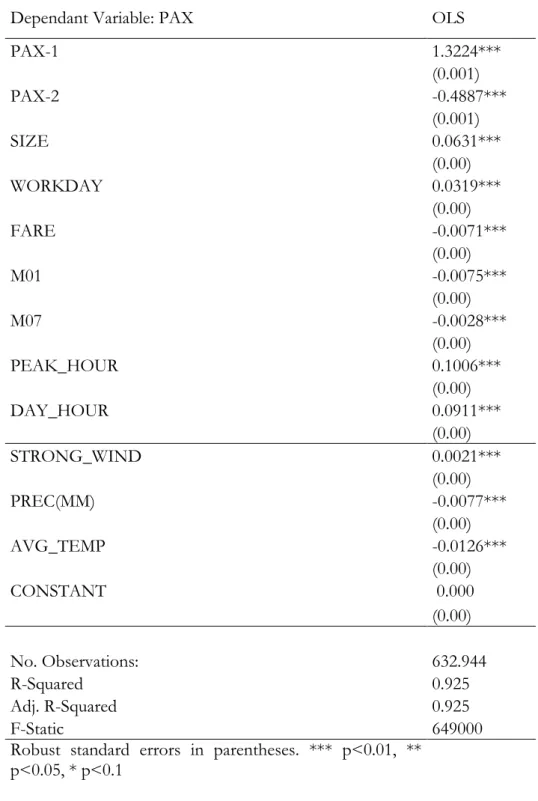
The results of the OLS regression taking into account SUBE and weather variables are shown in Table 1.
2 This is important, for example, in the case of penalized regressions it helps avoid the different impacts of the
Dependant Variable: PAX OLS PAX-1 1.3224*** (0.001) PAX-2 -0.4887*** (0.001) SIZE 0.0631*** (0.00) WORKDAY 0.0319*** (0.00) FARE -0.0071*** (0.00) M01 -0.0075*** (0.00) M07 -0.0028*** (0.00) PEAK_HOUR 0.1006*** (0.00) DAY_HOUR 0.0911*** (0.00) STRONG_WIND 0.0021*** (0.00) PREC(MM) -0.0077*** (0.00) AVG_TEMP -0.0126*** (0.00) CONSTANT 0.000 (0.00) No. Observations: 632.944 R-Squared 0.925 Adj. R-Squared 0.925 F-Static 649000
Robust standard errors in parentheses. *** p<0.01, ** p<0.05, * p<0.1
Table 1: OLS Regression
As can be seen, we obtain similar results to those reported by Arana et al. (2014). In addition, we incorporated two one-hour lags and obtained a result of almost 2 on the Durbin-Watson test, indicating that there is no autocorrelation. We then proceeded to include several time variables, which we deem important for quantifying demand and which are essential to ensure a good quality analysis. These variables differentiate peak-hours (07:00, 08:00, 12:00, 13:00, 17:00 and 18:00), that is, times of day when the mean is higher than 1,000 travelers per hour/per bus route, night hours (22:00-06:00, in line with prevailing labor regulations) and, all others, as day hours. We also incorporated a variable that differentiates working days
from non-working days (i.e., Saturdays, Sundays, national holidays). Finally, we added two dummies for the months of July and January, when travel patterns differ from those in other months due to school holidays and the extreme nature of their temperatures. We complemented the above with the one variable that differentiates the bus routes, namely SIZE, which computes the number of buses circulating each hour. This allows us to differentiate between the sizes of the different bus fleets. All the other characteristics are static, which means the supply is fixed and, therefore, we assume there is no endogeneity between supply and demand. The last variable we introduced was that of the bus fare, although it should be stressed that this barely fluctuated during the period analyzed.
We then added the three weather variables considered by Arana et al. (2014) with one difference. We included as a dummy the notion of STRONG_WIND, that is, a wind with a velocity greater than 50 km/hour on the Beaufort scale, as we consider it to be more readily interpretable in terms of its explanatory power.
All the variables present their expected signs and are similar to those reported in Arana et al. (2014). More travelers caught buses on working days (as opposed to non-working days), and more were recorded at peak-hours and during day hours (as opposed to night hours). The size of the fleet presents a positive relation with a larger number of travelers. The fare has a negative impact as does rain and mean temperature (the latter might be attributable to the fact that while the buses are not fitted with air conditioning, they do have heating). Finally, strong wind conditions seem to favor a higher number of passengers. This outcome is consistent with the fact that strong winds are more unpredictable than rain, so when they do blow people are usually already out on the streets and prefer to escape their effects by boarding a bus.
However, this tells us nothing in terms of demand forecasts; indeed, causality would appear not to be directly relevant. Clearly, we would all expect the number of passengers to increase on working days and for rain to act as a deterrent to mobility. What bus operators and transport regulators need to know is the likely number of passengers at any specific time, that is, they need accurate forecasts. In other words, they need answers to such questions as: How many passengers will there be if it rains tomorrow? Why, therefore, do studies seek to identify the best unbiased estimator? Why should they care about unbiasedness or determining whether the central point is variable Y? The smart card is an excellent tool – a highly innovative technology – that provides us with daily feedback for use in predictive analyses. Smart cards facilitate the construction of an unparalleled base learner that is constantly improving itself. Given the availability of these data, the next step is to start using algorithms that can exploit this advantage.
Below, we do just that and provide comparisons of SML techniques – given that we have high quality training data – for making demand forecasts. We start by analyzing the MSE, as a performance accuracy measure that determines the difference between real and predicted values.
We begin by reporting the MSE of the OLS regression. This provides us with a value of 0.0711 (and because the variables are normalized, from this juncture, we have to make relative comparisons).
In what follows, we train randomly with two-thirds of the data, while using the remaining third as test data3.
3.2 Forward Stepwise Regression
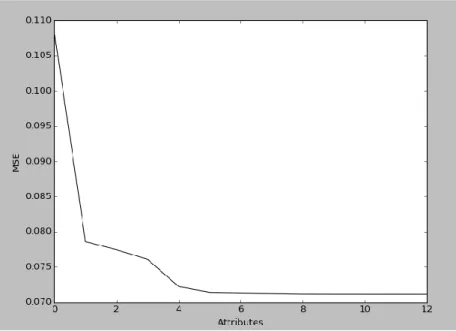
OLS is a minimization problem of the average squared error (but not zero); however, problems of overfitting4 (a discrepancy between the training and test data) may well be found. One way to resolve this is to resort to forward stepwise regression. This method seeks to fit a subset of attributes by successively incorporating new variables while evaluating the out-of-sample performance. Those attributes that improve performance can then be maintained definitively.
Fig. 4: MSE performance when incorporating different attributes
In terms of performance, we obtain similar results to those obtained for the OLS (given that in essence it is an OLS). This exercise provides us with the base point for the ML methods known as penalized linear regressions.
3.3 Penalized Linear Regressions
Penalized linear regression (PLR) is a method designed to overcome some of the problems associated with OLS, basically that of overfitting. They allow degrees of freedom to be reduced to fit data and model complexity. They are especially good methods when degrees of freedom are tight, although this is not the case here, as we have more than 600,000
3 Reducing the data in this way may increase slightly the MSE of the new methods introduced.
4 We stress the problem of overfitting throughout this paper, given its importance for a good quality prediction
observations and only 13 variables. Nevertheless, we believe it enriches the study to show all the main SML methods.
We adopt a shrinkage approach in our estimations, that is, we augment the error criteria that is being minimized with a data-independent penalty term (or regularization parameter α).
𝑃(𝛽) is the penalty function and it can take three different common forms, which we present below.
The problem we seek to solve by using α is a problem inherent to all predictions, namely, the trade-off between bias and variance (or overfitting).
a) Ridge Regression
In essence, stepwise regression imposes a restriction so that some elements of vector 𝛽 are equal to zero. Ridge regression is similar, but it imposes a restriction to the effect that all 𝛽s are greater than zero. Thus, 𝛼𝑃(𝛽) = 𝛼𝛽𝑇𝛽, which is the Euclidean norm of 𝛽. In short,
we balance the conflict between the squared prediction and the squared values of the coefficients.
In practice, the logic is to generate a family solution for different 𝛼. Every solution is tested with the sample data, and then we only use the solution that minimizes the out-of-sample error. A widely accepted technique is that of cross-validation5, one that we employ throughout this study.
We obtain an MSE of 0.070728 and an R-squared value of 0.93. Thus, we cannot conclude that this is a better technique than that of OLS.
b) Lasso Regression
Lasso regression uses the absolute as opposed to the Euclidean distance, which allows some of the coefficients to be equal to zero. Furthermore, it allows us to establish an order of relevance, since when testing alpha, we find some variables that require a greater penalty term to be non-zero. Thus, 𝛼𝑃(𝛽) = 𝛼|𝛽|.
However, here, we obtain a lower value for the regularization parameter, indicating that the OLS provides a good approximation.
c) Elastic Net Regression
Elastic net regression combines ridge and lasso regression algorithms as shown below:
5 The value of alpha is iterated over a range of values and we select the one with the highest cross-validation
𝛽0∗, 𝛽∗ = 𝑎𝑟𝑔𝑚𝑖𝑛 𝛽0∗,𝛽∗( 1 𝑚∑(𝑦𝑖− (𝛽0+ 𝑥𝑖𝛽))2+ 𝜆𝛼𝐿|𝛽| + (1 − 𝑚 𝑖=1 𝜆)𝛼𝑅𝛽𝑇𝛽)
So that when 𝜆 = 1, it corresponds to a lasso penalization, and when 𝜆 = 0, it corresponds to a ridge regression.
In summary, here, what we seek is a good quality trade-off between bias and variance. If we can achieve a greater reduction in variance than the corresponding increase in bias, then we can obtain higher precision.
3.4 Ensemble Methods
Ensemble methods use a set of algorithms that combine different predictions (base learners) and the combination of these results offers better outcomes than those obtained from random guessing.
a) Binary Decision Tree
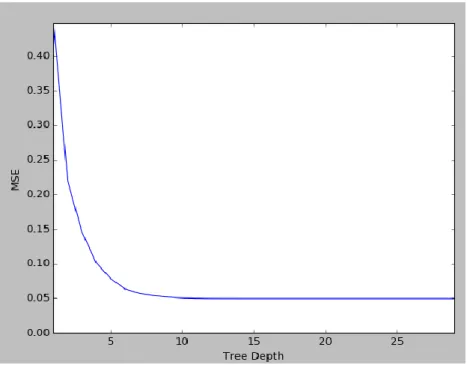
We begin with a simple binary tree, where we introduce a minimum sample split (0.5% of the sample is recommended) and a minimum sample leaf (we use 0.05%, which gives us a good number of terminal node observations) to avoid problems of overfitting. Then, we iterate the depth, so as to obtain the minimum MSE value (which is achieved after ten, when the model is stabilized because of the minimum sample split and leaf).
When applying this simple binary decision tree model – the simplest of the models presented – we obtain an MSE of 0.05, that is, a gain in precision of 34% over that provided by the OLS model. We discuss the importance of the individual variables at the end of this section. b) Bootstrap Aggregation Algorithm (Bagging)
Bagging uses bootstrap samples from the training data and then trains a base-learner in each of these samples. Finally, it takes a simple average of the predictions of the whole model. Bagging primarily addresses the variance error, but it does have some issues with bias error. This means it needs good depth (given that it is a simple model that generates splitting points concentrated in the same place). So we generate good depth (but apply the same criterion on splits to avoid overfitting), and try up to 200 tree models.
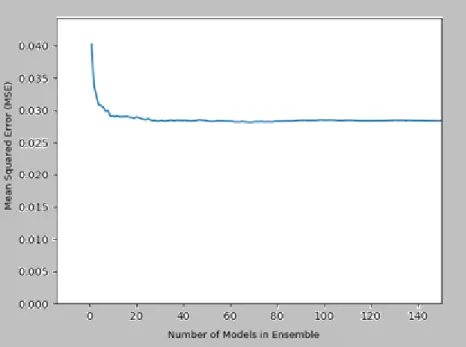
Fig. 6: MSE Performance with Bagging
We record an MSE of 0.045, which represents a 40% better performance than that of OLS. c) Random Forest
Bagging only constructs trees using bootstrap samples of data, whereas random forest (RF) also uses a random sample on predictors before each node is split, until the tree conditions are fulfilled. This ensures greater independence between trees, because of the combination of bootstrap samples and random draws of predictors. Consequently, we can take advantage of averaging a large number of trees (and so obtain better levels of variance reduction). Similarly, we can gain in terms of bias reduction, because we can employ a very large number of predictors (more even than the number of observations), and local feature predictors can play a role in tree construction. In our example, however, we make no gain in this way, because we focus only on our 12 variables for the models to be comparable.
In conclusion, this method has all the advantages of bagging combined with a lower propensity to overfit (each tree fits, or overfits, a part of the training set, and in the end these errors cancel each other out, at least partially), and, as we see below, it is easier to tune than gradient boosting (GB). Thus, RF works particularly well with fully grown decision trees (low bias, high variance). Moreover, it tackles the error reduction task in the opposite way, that is, by reducing variance. In contrast to GB, trees are made uncorrelated to maximize the decrease in variance, but RF cannot reduce bias (which is slightly higher than that of a simple binary tree). Hence, the need for large unpruned trees, so that the bias is as low as possible at the outset.
In contrast to decision trees, we can reduce the number of observations in the terminal nodes, because RF is less likely to overfit. However, we maintain the same splits rule. In practice, 500 trees is often a good choice. Finally, we have to set the number of predictors sampled, and this is a key tuning parameter that will affect performance. There exist several rules, but the most common is 𝑘 = 𝑙𝑜𝑔2(𝑛) + 1 (as recommended by Breiman, 2001) or one third of the attributes.
Fig. 7: MSE Performance with Random Forest
As Figure 7 shows, we obtain better results in terms of MSE. Indeed, the MSE falls to the lowest level so far, that is, 0.028. This represents a reduction of more than 60% in the prediction error compared to that provided by linear models. Our R-squared value increases slightly (0.97) due to the combination of variable subsetting.
d) Gradient Boosting
What GB does is to train a set of trees, where every tree is trained on the error of the previous ensemble models. GB starts in the same way as bagging, but it focuses on the areas that present most mistakes. This gives a better approximation, without the need for greater depth, which is an essential advantage. In contrast with RF, GB works well when based on weak
learners in terms of high bias and low variance (even as small as decision stumps). GB reduces the error primarily by reducing bias, and to some extent the variance, by aggregating the output from many models.
In summary, RF trains with a random sample of data in addition to randomizing features. It relies on this randomization to give a better generalization performance on out-of-sample data. GB, on the other hand, additionally seeks to find the optimal linear combination of trees, where the final model is the weighted sum of predictions of individual trees applied to the training data.
We employ the same methodology as above and use minimum split values at leaf and terminal nodes using a standard learning rate of 0.01. We show both the training and testing errors to ensure there is no problem of overfitting, which is the main concern here.
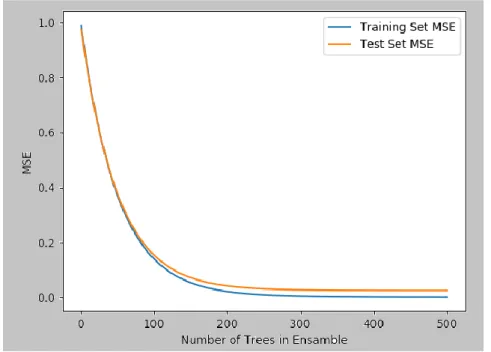
Fig. 8 MSE Performance with Gradient Boosting
Figure 8 shows that we obtain even better results than those obtained with the RF model, with a total absence of overfitting. This represents a reduction of more than 65% in the prediction error compared to that of the linear models. Our R-squared value is unchanged from that reported for RF.
3.5 Results Summary
Metrics Regression Linear Forward Stepwise Ridge Lasso Binary Tree Bagging Random Forest Gradient Boosting
MSE 0.0752 0.0712 0.0707 0.0760 0.0495 0.0455 0.0282 0.0250
%MSE
gain - -5.3% -5.9% 1.1% -34.2% -39.5% -62.5% -66.8%
Table 2: Metric Results
A comparison of our main results (see Table 2) shows that ensemble methods of supervised machine learning provide much better results in terms of error measurement. This means we obtain much better precision in our model predictions, which is achieved by eliminating the linearity restrictions imposed by traditional methods and by exploiting the potential of tree-based models.
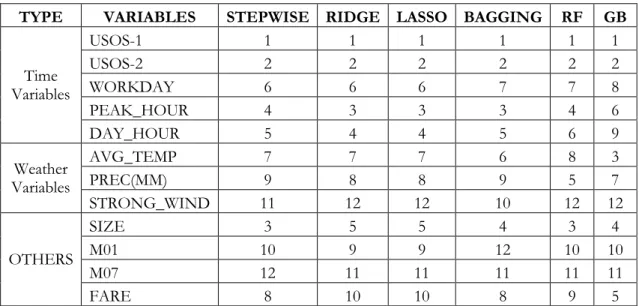
TYPE VARIABLES STEPWISE RIDGE LASSO BAGGING RF GB
Time Variables USOS-1 1 1 1 1 1 1 USOS-2 2 2 2 2 2 2 WORKDAY 6 6 6 7 7 8 PEAK_HOUR 4 3 3 3 4 6 DAY_HOUR 5 4 4 5 6 9 Weather Variables AVG_TEMP 7 7 7 6 8 3 PREC(MM) 9 8 8 9 5 7 STRONG_WIND 11 12 12 10 12 12 OTHERS SIZE 3 5 5 4 3 4 M01 10 9 9 12 10 10 M07 12 11 11 11 11 11 FARE 8 10 10 8 9 5
Table 3: Importance of Variables
Table 3 ranks the variables used in the estimations. This ranking is based on how much each feature contributes to explaining the error between real and predicted values. As can be seen, the importance attached to weather conditions by each model is not comparable to that attached to the time variables. When analyzing the linear model, we obtain the marginal impact of variables on the target, but we are unable to assess their importance in terms of predictive power. However, it is clear that when predicting demand, we first have to take into account the time pattern variables.
Conclusions
We have shown how machine learning algorithms, especially those associated with tree regressions, perform better than OLS demand predictions for public transport services. While previous studies have exploited smart cards to predict demand, they have typically adopted an unbiased orientation to address a problem that is clearly predictive in nature.
Here, we take an error focus and propose different supervised machine learning algorithms for application to the smart card data obtained from the SUBE system employed in Argentina. Specifically, we have examined the bus system operating in the Autonomous City of Buenos Aires (CABA), thanks to the rich source of information it provides and because of the homogeneous behavior presented throughout the period analyzed, and we have tried to predict demand at given times throughout the day and on given bus routes. We have compared a set of penalized linear regressions and ensemble methods with a traditional linear regression model in an effort to identify the method that provides the most accurate forecasts.
Despite the concerns expressed in previous studies about out-of-sample data (which means it is unclear how well they perform on new data), we conclude that our predictive methodology in general performs 40-65% better than traditional unbiased methods.
Likewise, we have undertaken a feature analysis to determine which variables have most impact on demand predictions. We find that the variables with the greatest impact are not those directly related to weather conditions, but rather that time variables are persistently the most influential.
In short, this study provides a number of real tools for regulators, given that the model we have constructed performs well in an out-of-sample environment and all they need do is reapply it.
References
Arana, P., Cabezudo, S., Peñalba, M., 2014. Influence of weather conditions on transit ridership: A statical study using data from Smartcards. Transportation Research Part A 59, 1-12.
Breimann, L., 2001. Random forests. Machine Learning, 45(1), 5–32.
Alfred Chu, K., Chapleau, R., 2008. Enriching archived smart card transaction data for transit demand modeling. Transportation Research Record: Journal of the Transportation Research Board, (2063), 63-72.
Kleinberg, J., Ludwig, J., Mullainathan, S., Obermeyer, Z., 2015. Prediction Policy Problems. American Economic Review. Vol. 105, No. 5, pp. 491-95.
Haibo Li, H., Chena, X., 2016. Unifying Time Reference of Smart Card Data Using Dynamic Time Warping. Procedia Engineering 137, 513 – 522
Ma, X., Wu, Y. J., Wang, Y., Chen, F., & Liu, J., 2013. Mining smart card data for transit riders’ travel patterns. Transportation Research Part C: Emerging Technologies, 36, 1-12. Moreira, J. M., Alípio J., de Sousa, J. F., Soares, C. Trip time prediction in mass transit companies. A machine learning approach. Advanced OR and AI Methods in transportation.
Munzinga, M. A., Palma, C., 2012. Estimation of a disaggregate multimodal public transport Origin-Destination matrix from passive smartcard data from Santiago de Chile, Transportation Research Part C 24, 9-18.
Pelletier, M. P., Trépanier, M., Morency, C., 2011. Smart card Data Use in Public Transit: A Literature Review. Transportation Research Part C: Emerging Technologies 19 (4): 557-568. Seaborn, C., Attanucci, J., Wilson, N. H. M., 2009. Using Smart Card Fare Payment Data to Analyze Multi-Modal Public Transport Journeys in London. Transportation Research Record: Journal of the Transportation Research Board 2121: 55-62.
Tirachini, A., Hensher, D. A., Rose, J. M., 2013. Crowding in public transport systems: Effects of users operation and implications for the estimation of demand. Transportation Research Part A 53, 36-52.
Tao, S., Rohde, D., Corcoran, J., 2014. Examining the spatial–temporal dynamics of bus passenger travel behaviour using smart card data and the flow-comap. J. Transp. Geogr. 41, 21–36
Tao, S., Corcoran, J., Hickman, M., Stimson, R., 2016. The influence of weather on local geographical patterns of bus usage. Journal of Transport Geography, 54, 66-80.
Utsunomiya, M., Attanucci, J., Wilson, N., 2006. Potential uses of transit smart card registration and transaction data to improve transit planning. Transp. Res. Rec. J. Transp. Res. Board 1971, 119–126
SÈRIE DE DOCUMENTS DE TREBALL DE LA XREAP
2006
CREAP2006-01
Matas, A. (GEAP); Raymond, J.Ll. (GEAP)
"Economic development and changes in car ownership patterns" (Juny 2006)
CREAP2006-02
Trillas, F. (IEB); Montolio, D. (IEB); Duch, N. (IEB)
"Productive efficiency and regulatory reform: The case of Vehicle Inspection Services" (Setembre 2006)
CREAP2006-03
Bel, G. (PPRE-IREA); Fageda, X. (PPRE-IREA)
"Factors explaining local privatization: A meta-regression analysis" (Octubre 2006)
CREAP2006-04
Fernàndez-Villadangos, L. (PPRE-IREA)
"Are two-part tariffs efficient when consumers plan ahead?: An empirical study" (Octubre 2006)
CREAP2006-05
Artís, M. (AQR-IREA); Ramos, R. (AQR-IREA); Suriñach, J. (AQR-IREA) "Job losses, outsourcing and relocation: Empirical evidence using microdata" (Octubre 2006)
CREAP2006-06
Alcañiz, M. (RISC-IREA); Costa, A.; Guillén, M. (RISC-IREA); Luna, C.; Rovira, C. "Calculation of the variance in surveys of the economic climate”
(Novembre 2006) CREAP2006-07
Albalate, D. (PPRE-IREA)
"Lowering blood alcohol content levels to save lives: The European Experience” (Desembre 2006)
CREAP2006-08
Garrido, A. (IEB); Arqué, P. (IEB)
“The choice of banking firm: Are the interest rate a significant criteria?” (Desembre 2006)
CREAP2006-09
Segarra, A. (GRIT); Teruel-Carrizosa, M. (GRIT)
"Productivity growth and competition in spanish manufacturing firms: What has happened in recent years?”
(Desembre 2006) CREAP2006-10
Andonova, V.; Díaz-Serrano, Luis. (CREB)
"Political institutions and the development of telecommunications” (Desembre 2006)
CREAP2006-11
Raymond, J.L.(GEAP); Roig, J.L.. (GEAP)
"Capital humano: un análisis comparativo Catalunya-España” (Desembre 2006)
CREAP2006-12
Rodríguez, M.(CREB); Stoyanova, A. (CREB)
"Changes in the demand for private medical insurance following a shift in tax incentives” (Desembre 2006)
CREAP2006-13
Royuela, V. (AQR-IREA); Lambiri, D.; Biagi, B.
"Economía urbana y calidad de vida. Una revisión del estado del conocimiento en España” (Desembre 2006)
SÈRIE DE DOCUMENTS DE TREBALL DE LA XREAP
Camarero, M.; Carrion-i-Silvestre, J.LL. (AQR-IREA).;Tamarit, C.
"New evidence of the real interest rate parity for OECD countries using panel unit root tests with breaks” (Desembre 2006)
CREAP2006-15
Karanassou, M.; Sala, H. (GEAP).;Snower , D. J.
"The macroeconomics of the labor market: Three fundamental views” (Desembre 2006)
2007
XREAP2007-01
Castany, L (AQR-IREA); López-Bazo, E. (AQR-IREA).;Moreno , R. (AQR-IREA) "Decomposing differences in total factor productivity across firm size”
(Març 2007) XREAP2007-02
Raymond, J. Ll. (GEAP); Roig, J. Ll. (GEAP)
“Una propuesta de evaluación de las externalidades de capital humano en la empresa" (Abril 2007)
XREAP2007-03
Durán, J. M. (IEB); Esteller, A. (IEB)
“An empirical analysis of wealth taxation: Equity vs. Tax compliance” (Juny 2007)
XREAP2007-04
Matas, A. (GEAP); Raymond, J.Ll. (GEAP)
“Cross-section data, disequilibrium situations and estimated coefficients: evidence from car ownership demand” (Juny 2007)
XREAP2007-05
Jofre-Montseny, J. (IEB); Solé-Ollé, A. (IEB)
“Tax differentials and agglomeration economies in intraregional firm location” (Juny 2007)
XREAP2007-06
Álvarez-Albelo, C. (CREB); Hernández-Martín, R.
“Explaining high economic growth in small tourism countries with a dynamic general equilibrium model” (Juliol 2007)
XREAP2007-07
Duch, N. (IEB); Montolio, D. (IEB); Mediavilla, M.
“Evaluating the impact of public subsidies on a firm’s performance: a quasi-experimental approach” (Juliol 2007)
XREAP2007-08
Segarra-Blasco, A. (GRIT)
“Innovation sources and productivity: a quantile regression analysis” (Octubre 2007)
XREAP2007-09
Albalate, D. (PPRE-IREA)
“Shifting death to their Alternatives: The case of Toll Motorways” (Octubre 2007)
XREAP2007-10
Segarra-Blasco, A. (GRIT); Garcia-Quevedo, J. (IEB); Teruel-Carrizosa, M. (GRIT) “Barriers to innovation and public policy in catalonia”
(Novembre 2007) XREAP2007-11
Bel, G. (PPRE-IREA); Foote, J.
“Comparison of recent toll road concession transactions in the United States and France” (Novembre 2007)
XREAP2007-12
Segarra-Blasco, A. (GRIT);
“Innovation, R&D spillovers and productivity: the role of knowledge-intensive services” (Novembre 2007)
SÈRIE DE DOCUMENTS DE TREBALL DE LA XREAP
XREAP2007-13
Bermúdez Morata, Ll. (RFA-IREA); Guillén Estany, M. (RFA-IREA), Solé Auró, A. (RFA-IREA) “Impacto de la inmigración sobre la esperanza de vida en salud y en discapacidad de la población española” (Novembre 2007)
XREAP2007-14
Calaeys, P. (AQR-IREA); Ramos, R. (AQR-IREA), Suriñach, J. (AQR-IREA) “Fiscal sustainability across government tiers”
(Desembre 2007) XREAP2007-15
Sánchez Hugalbe, A. (IEB)
“Influencia de la inmigración en la elección escolar” (Desembre 2007)
2008
XREAP2008-01
Durán Weitkamp, C. (GRIT); Martín Bofarull, M. (GRIT) ; Pablo Martí, F. “Economic effects of road accessibility in the Pyrenees: User perspective” (Gener 2008)
XREAP2008-02
Díaz-Serrano, L.; Stoyanova, A. P. (CREB)
“The Causal Relationship between Individual’s Choice Behavior and Self-Reported Satisfaction: the Case of Residential Mobility in the EU” (Març 2008)
XREAP2008-03
Matas, A. (GEAP); Raymond, J. L. (GEAP); Roig, J. L. (GEAP) “Car ownership and access to jobs in Spain”
(Abril 2008) XREAP2008-04
Bel, G. (PPRE-IREA) ; Fageda, X. (PPRE-IREA)
“Privatization and competition in the delivery of local services: An empirical examination of the dual market hypothesis” (Abril 2008)
XREAP2008-05
Matas, A. (GEAP); Raymond, J. L. (GEAP); Roig, J. L. (GEAP) “Job accessibility and employment probability”
(Maig 2008) XREAP2008-06
Basher, S. A.; Carrión, J. Ll. (AQR-IREA)
Deconstructing Shocks and Persistence in OECD Real Exchange Rates (Juny 2008)
XREAP2008-07
Sanromá, E. (IEB); Ramos, R. (AQR-IREA); Simón, H.
Portabilidad del capital humano y asimilación de los inmigrantes. Evidencia para España (Juliol 2008)
XREAP2008-08
Basher, S. A.; Carrión, J. Ll. (AQR-IREA)
Price level convergence, purchasing power parity and multiple structural breaks: An application to US cities (Juliol 2008)
XREAP2008-09
Bermúdez, Ll. (RFA-IREA)
A priori ratemaking using bivariate poisson regression models (Juliol 2008)
SÈRIE DE DOCUMENTS DE TREBALL DE LA XREAP
XREAP2008-10
Solé-Ollé, A. (IEB), Hortas Rico, M. (IEB)
Does urban sprawl increase the costs of providing local public services? Evidence from Spanish municipalities (Novembre 2008)
XREAP2008-11
Teruel-Carrizosa, M. (GRIT), Segarra-Blasco, A. (GRIT) Immigration and Firm Growth: Evidence from Spanish cities (Novembre 2008)
XREAP2008-12
Duch-Brown, N. (IEB), García-Quevedo, J. (IEB), Montolio, D. (IEB)
Assessing the assignation of public subsidies: Do the experts choose the most efficient R&D projects? (Novembre 2008)
XREAP2008-13
Bilotkach, V., Fageda, X. (PPRE-IREA), Flores-Fillol, R.
Scheduled service versus personal transportation: the role of distance (Desembre 2008)
XREAP2008-14
Albalate, D. (PPRE-IREA), Gel, G. (PPRE-IREA)
Tourism and urban transport: Holding demand pressure under supply constraints (Desembre 2008)
2009
XREAP2009-01
Calonge, S. (CREB); Tejada, O.
“A theoretical and practical study on linear reforms of dual taxes” (Febrer 2009)
XREAP2009-02
Albalate, D. (PPRE-IREA); Fernández-Villadangos, L. (PPRE-IREA)
“Exploring Determinants of Urban Motorcycle Accident Severity: The Case of Barcelona” (Març 2009)
XREAP2009-03
Borrell, J. R. (PPRE-IREA); Fernández-Villadangos, L. (PPRE-IREA) “Assessing excess profits from different entry regulations”
(Abril 2009) XREAP2009-04
Sanromá, E. (IEB); Ramos, R. (AQR-IREA), Simon, H.
“Los salarios de los inmigrantes en el mercado de trabajo español. ¿Importa el origen del capital humano?” (Abril 2009)
XREAP2009-05
Jiménez, J. L.; Perdiguero, J. (PPRE-IREA)
“(No)competition in the Spanish retailing gasoline market: a variance filter approach” (Maig 2009)
XREAP2009-06
Álvarez-Albelo,C. D. (CREB), Manresa, A. (CREB), Pigem-Vigo, M. (CREB) “International trade as the sole engine of growth for an economy”
(Juny 2009) XREAP2009-07
Callejón, M. (PPRE-IREA), Ortún V, M. “The Black Box of Business Dynamics” (Setembre 2009)
XREAP2009-08 Lucena, A. (CREB)
“The antecedents and innovation consequences of organizational search: empirical evidence for Spain” (Octubre 2009)
SÈRIE DE DOCUMENTS DE TREBALL DE LA XREAP
XREAP2009-09
Domènech Campmajó, L. (PPRE-IREA) “Competition between TV Platforms” (Octubre 2009)
XREAP2009-10
Solé-Auró, A. (RFA-IREA),Guillén, M. (RFA-IREA), Crimmins, E. M.
“Health care utilization among immigrants and native-born populations in 11 European countries. Results from the Survey of Health, Ageing and Retirement in Europe”
(Octubre 2009) XREAP2009-11
Segarra, A. (GRIT), Teruel, M. (GRIT) “Small firms, growth and financial constraints” (Octubre 2009)
XREAP2009-12
Matas, A. (GEAP), Raymond, J.Ll. (GEAP), Ruiz, A. (GEAP) “Traffic forecasts under uncertainty and capacity constraints” (Novembre 2009)
XREAP2009-13 Sole-Ollé, A. (IEB)
“Inter-regional redistribution through infrastructure investment: tactical or programmatic?” (Novembre 2009)
XREAP2009-14
Del Barrio-Castro, T., García-Quevedo, J. (IEB)
“The determinants of university patenting: Do incentives matter?” (Novembre 2009)
XREAP2009-15
Ramos, R. (AQR-IREA), Suriñach, J. (AQR-IREA), Artís, M. (AQR-IREA) “Human capital spillovers, productivity and regional convergence in Spain” (Novembre 2009)
XREAP2009-16
Álvarez-Albelo, C. D. (CREB), Hernández-Martín, R.
“The commons and anti-commons problems in the tourism economy” (Desembre 2009)
2010
XREAP2010-01
García-López, M. A. (GEAP)
“The Accessibility City. When Transport Infrastructure Matters in Urban Spatial Structure” (Febrer 2010)
XREAP2010-02
García-Quevedo, J. (IEB), Mas-Verdú, F. (IEB), Polo-Otero, J. (IEB)
“Which firms want PhDs? The effect of the university-industry relationship on the PhD labour market” (Març 2010)
XREAP2010-03
Pitt, D., Guillén, M. (RFA-IREA)
“An introduction to parametric and non-parametric models for bivariate positive insurance claim severity distributions” (Març 2010)
XREAP2010-04
Bermúdez, Ll. (RFA-IREA), Karlis, D.
“Modelling dependence in a ratemaking procedure with multivariate Poisson regression models” (Abril 2010)
XREAP2010-05 Di Paolo, A. (IEB)
“Parental education and family characteristics: educational opportunities across cohorts in Italy and Spain” (Maig 2010)
XREAP2010-06
SÈRIE DE DOCUMENTS DE TREBALL DE LA XREAP
“Movilidad ocupacional de los inmigrantes en una economía de bajas cualificaciones. El caso de España” (Juny 2010)
XREAP2010-07
Di Paolo, A. (GEAP & IEB), Raymond, J. Ll. (GEAP & IEB) “Language knowledge and earnings in Catalonia”
(Juliol 2010) XREAP2010-08
Bolancé, C. (RFA-IREA), Alemany, R. (RFA-IREA), Guillén, M. (RFA-IREA) “Prediction of the economic cost of individual long-term care in the Spanish population” (Setembre 2010)
XREAP2010-09
Di Paolo, A. (GEAP & IEB)
“Knowledge of catalan, public/private sector choice and earnings: Evidence from a double sample selection model” (Setembre 2010)
XREAP2010-10
Coad, A., Segarra, A. (GRIT), Teruel, M. (GRIT)
“Like milk or wine: Does firm performance improve with age?” (Setembre 2010)
XREAP2010-11
Di Paolo, A. (GEAP & IEB), Raymond, J. Ll. (GEAP & IEB), Calero, J. (IEB) “Exploring educational mobility in Europe”
(Octubre 2010) XREAP2010-12
Borrell, A. (GiM-IREA), Fernández-Villadangos, L. (GiM-IREA)
“Clustering or scattering: the underlying reason for regulating distance among retail outlets” (Desembre 2010)
XREAP2010-13
Di Paolo, A. (GEAP & IEB)
“School composition effects in Spain” (Desembre 2010)
XREAP2010-14
Fageda, X. (GiM-IREA), Flores-Fillol, R.
“Technology, Business Models and Network Structure in the Airline Industry” (Desembre 2010)
XREAP2010-15
Albalate, D. (GiM-IREA), Bel, G. (GiM-IREA), Fageda, X. (GiM-IREA)
“Is it Redistribution or Centralization? On the Determinants of Government Investment in Infrastructure” (Desembre 2010)
XREAP2010-16
Oppedisano, V., Turati, G.
“What are the causes of educational inequalities and of their evolution over time in Europe? Evidence from PISA” (Desembre 2010)
XREAP2010-17 Canova, L., Vaglio, A.
“Why do educated mothers matter? A model of parental help” (Desembre 2010)
2011
XREAP2011-01
Fageda, X. (GiM-IREA), Perdiguero, J. (GiM-IREA)
“An empirical analysis of a merger between a network and low-cost airlines” (Maig 2011)
SÈRIE DE DOCUMENTS DE TREBALL DE LA XREAP
XREAP2011-02
Moreno-Torres, I. (ACCO, CRES & GiM-IREA)
“What if there was a stronger pharmaceutical price competition in Spain? When regulation has a similar effect to collusion” (Maig 2011)
XREAP2011-03
Miguélez, E. (AQR-IREA); Gómez-Miguélez, I. “Singling out individual inventors from patent data” (Maig 2011)
XREAP2011-04
Moreno-Torres, I. (ACCO, CRES & GiM-IREA)
“Generic drugs in Spain: price competition vs. moral hazard” (Maig 2011)
XREAP2011-05
Nieto, S. (AQR-IREA), Ramos, R. (AQR-IREA)
“¿Afecta la sobreeducación de los padres al rendimiento académico de sus hijos?” (Maig 2011)
XREAP2011-06
Pitt, D., Guillén, M. (RFA-IREA), Bolancé, C. (RFA-IREA)
“Estimation of Parametric and Nonparametric Models for Univariate Claim Severity Distributions - an approach using R” (Juny 2011)
XREAP2011-07
Guillén, M. (RFA-IREA), Comas-Herrera, A.
“How much risk is mitigated by LTC Insurance? A case study of the public system in Spain” (Juny 2011)
XREAP2011-08
Ayuso, M. (RFA-IREA), Guillén, M. (RFA-IREA), Bolancé, C. (RFA-IREA) “Loss risk through fraud in car insurance”
(Juny 2011) XREAP2011-09
Duch-Brown, N. (IEB), García-Quevedo, J. (IEB), Montolio, D. (IEB)
“The link between public support and private R&D effort: What is the optimal subsidy?” (Juny 2011)
XREAP2011-10
Bermúdez, Ll. (RFA-IREA), Karlis, D.
“Mixture of bivariate Poisson regression models with an application to insurance” (Juliol 2011)
XREAP2011-11
Varela-Irimia, X-L. (GRIT)
“Age effects, unobserved characteristics and hedonic price indexes: The Spanish car market in the 1990s” (Agost 2011)
XREAP2011-12
Bermúdez, Ll. (RFA-IREA), Ferri, A. (RFA-IREA), Guillén, M. (RFA-IREA)
“A correlation sensitivity analysis of non-life underwriting risk in solvency capital requirement estimation” (Setembre 2011)
XREAP2011-13
Guillén, M. (RFA-IREA), Pérez-Marín, A. (RFA-IREA), Alcañiz, M. (RFA-IREA) “A logistic regression approach to estimating customer profit loss due to lapses in insurance” (Octubre 2011)
XREAP2011-14
Jiménez, J. L., Perdiguero, J. (GiM-IREA), García, C.
“Evaluation of subsidies programs to sell green cars: Impact on prices, quantities and efficiency” (Octubre 2011)
SÈRIE DE DOCUMENTS DE TREBALL DE LA XREAP
XREAP2011-15 Arespa, M. (CREB)
“A New Open Economy Macroeconomic Model with Endogenous Portfolio Diversification and Firms Entry” (Octubre 2011)
XREAP2011-16
Matas, A. (GEAP), Raymond, J. L. (GEAP), Roig, J.L. (GEAP) “The impact of agglomeration effects and accessibility on wages” (Novembre 2011)
XREAP2011-17 Segarra, A. (GRIT)
“R&D cooperation between Spanish firms and scientific partners: what is the role of tertiary education?” (Novembre 2011)
XREAP2011-18
García-Pérez, J. I.; Hidalgo-Hidalgo, M.; Robles-Zurita, J. A. “Does grade retention affect achievement? Some evidence from PISA” (Novembre 2011)
XREAP2011-19 Arespa, M. (CREB)
“Macroeconomics of extensive margins: a simple model” (Novembre 2011)
XREAP2011-20
García-Quevedo, J. (IEB), Pellegrino, G. (IEB), Vivarelli, M. “The determinants of YICs’ R&D activity”
(Desembre 2011) XREAP2011-21
González-Val, R. (IEB), Olmo, J.
“Growth in a Cross-Section of Cities: Location, Increasing Returns or Random Growth?” (Desembre 2011)
XREAP2011-22
Gombau, V. (GRIT), Segarra, A. (GRIT)
“The Innovation and Imitation Dichotomy in Spanish firms: do absorptive capacity and the technological frontier matter?” (Desembre 2011)
2012
XREAP2012-01
Borrell, J. R. (GiM-IREA), Jiménez, J. L., García, C. “Evaluating Antitrust Leniency Programs”
(Gener 2012) XREAP2012-02
Ferri, A. (RFA-IREA), Guillén, M. (RFA-IREA), Bermúdez, Ll. (RFA-IREA) “Solvency capital estimation and risk measures”
(Gener 2012) XREAP2012-03
Ferri, A. (RFA-IREA), Bermúdez, Ll. (RFA-IREA), Guillén, M. (RFA-IREA) “How to use the standard model with own data”
(Febrer 2012) XREAP2012-04
Perdiguero, J. (GiM-IREA), Borrell, J.R. (GiM-IREA) “Driving competition in local gasoline markets” (Març 2012)
XREAP2012-05
D’Amico, G., Guillen, M. (RFA-IREA), Manca, R.
“Discrete time Non-homogeneous Semi-Markov Processes applied to Models for Disability Insurance” (Març 2012)
SÈRIE DE DOCUMENTS DE TREBALL DE LA XREAP
XREAP2012-06
Bové-Sans, M. A. (GRIT), Laguado-Ramírez, R.
“Quantitative analysis of image factors in a cultural heritage tourist destination” (Abril 2012)
XREAP2012-07
Tello, C. (AQR-IREA), Ramos, R. (AQR-IREA), Artís, M. (AQR-IREA)
“Changes in wage structure in Mexico going beyond the mean: An analysis of differences in distribution, 1987-2008” (Maig 2012)
XREAP2012-08
Jofre-Monseny, J. (IEB), Marín-López, R. (IEB), Viladecans-Marsal, E. (IEB)
“What underlies localization and urbanization economies? Evidence from the location of new firms” (Maig 2012)
XREAP2012-09
Muñiz, I. (GEAP), Calatayud, D., Dobaño, R.
“Los límites de la compacidad urbana como instrumento a favor de la sostenibilidad. La hipótesis de la compensación en Barcelona medida a través de la huella ecológica de la movilidad y la vivienda”
(Maig 2012) XREAP2012-10
Arqué-Castells, P. (GEAP), Mohnen, P.
“Sunk costs, extensive R&D subsidies and permanent inducement effects” (Maig 2012)
XREAP2012-11
Boj, E. (CREB), Delicado, P., Fortiana, J., Esteve, A., Caballé, A.
“Local Distance-Based Generalized Linear Models using the dbstats package for R” (Maig 2012)
XREAP2012-12
Royuela, V. (AQR-IREA)
“What about people in European Regional Science?” (Maig 2012)
XREAP2012-13
Osorio A. M. (RFA-IREA), Bolancé, C. (RFA-IREA), Madise, N.
“Intermediary and structural determinants of early childhood health in Colombia: exploring the role of communities” (Juny 2012)
XREAP2012-14
Miguelez. E. (AQR-IREA), Moreno, R. (AQR-IREA)
“Do labour mobility and networks foster geographical knowledge diffusion? The case of European regions” (Juliol 2012)
XREAP2012-15
Teixidó-Figueras, J. (GRIT), Duró, J. A. (GRIT)
“Ecological Footprint Inequality: A methodological review and some results” (Setembre 2012)
XREAP2012-16
Varela-Irimia, X-L. (GRIT)
“Profitability, uncertainty and multi-product firm product proliferation: The Spanish car industry” (Setembre 2012)
XREAP2012-17
Duró, J. A. (GRIT), Teixidó-Figueras, J. (GRIT)
“Ecological Footprint Inequality across countries: the role of environment intensity, income and interaction effects” (Octubre 2012)
XREAP2012-18
Manresa, A. (CREB), Sancho, F.
“Leontief versus Ghosh: two faces of the same coin” (Octubre 2012)
SÈRIE DE DOCUMENTS DE TREBALL DE LA XREAP
XREAP2012-19
Alemany, R. (RFA-IREA), Bolancé, C. (RFA-IREA), Guillén, M. (RFA-IREA) “Nonparametric estimation of Value-at-Risk”
(Octubre 2012) XREAP2012-20
Herrera-Idárraga, P. (AQR-IREA), López-Bazo, E. (AQR-IREA), Motellón, E. (AQR-IREA) “Informality and overeducation in the labor market of a developing country”
(Novembre 2012) XREAP2012-21
Di Paolo, A. (AQR-IREA)
“(Endogenous) occupational choices and job satisfaction among recent PhD recipients: evidence from Catalonia” (Desembre 2012)
2013
XREAP2013-01
Segarra, A. (GRIT), García-Quevedo, J. (IEB), Teruel, M. (GRIT) “Financial constraints and the failure of innovation projects” (Març 2013)
XREAP2013-02
Osorio, A. M. (RFA-IREA), Bolancé, C. (RFA-IREA), Madise, N., Rathmann, K.
“Social Determinants of Child Health in Colombia: Can Community Education Moderate the Effect of Family Characteristics?” (Març 2013)
XREAP2013-03
Teixidó-Figueras, J. (GRIT), Duró, J. A. (GRIT)
“The building blocks of international ecological footprint inequality: a regression-based decomposition” (Abril 2013)
XREAP2013-04
Salcedo-Sanz, S., Carro-Calvo, L., Claramunt, M. (CREB), Castañer, A. (CREB), Marmol, M. (CREB) “An Analysis of Black-box Optimization Problems in Reinsurance: Evolutionary-based Approaches” (Maig 2013)
XREAP2013-05
Alcañiz, M. (RFA), Guillén, M. (RFA), Sánchez-Moscona, D. (RFA), Santolino, M. (RFA), Llatje, O., Ramon, Ll. “Prevalence of alcohol-impaired drivers based on random breath tests in a roadside survey”
(Juliol 2013) XREAP2013-06
Matas, A. (GEAP & IEB), Raymond, J. Ll. (GEAP & IEB), Roig, J. L. (GEAP) “How market access shapes human capital investment in a peripheral country” (Octubre 2013)
XREAP2013-07
Di Paolo, A. (AQR-IREA), Tansel, A.
“Returns to Foreign Language Skills in a Developing Country: The Case of Turkey” (Novembre 2013)
XREAP2013-08
Fernández Gual, V. (GRIT), Segarra, A. (GRIT)
“The Impact of Cooperation on R&D, Innovation andProductivity: an Analysis of Spanish Manufacturing and Services Firms” (Novembre 2013)
XREAP2013-09
Bahraoui, Z. (RFA); Bolancé, C. (RFA); Pérez-Marín. A. M. (RFA) “Testing extreme value copulas to estimate the quantile”
(Novembre 2013) 2014
XREAP2014-01
Solé-Auró, A. (RFA), Alcañiz, M. (RFA)
“Are we living longer but less healthy? Trends in mortality and morbidity in Catalonia (Spain), 1994-2011” (Gener 2014)
SÈRIE DE DOCUMENTS DE TREBALL DE LA XREAP
Teixidó-Figueres, J. (GRIT), Duro, J. A. (GRIT)
“Spatial Polarization of the Ecological Footprint distribution” (Febrer 2014)
XREAP2014-03
Cristobal-Cebolla, A.; Gil Lafuente, A. M. (RFA), Merigó Lindhal, J. M. (RFA) “La importancia del control de los costes de la no-calidad en la empresa”
(Febrer 2014) XREAP2014-04
Castañer, A. (CREB); Claramunt, M.M. (CREB) “Optimal stop-loss reinsurance: a dependence analysis” (Abril 2014)
XREAP2014-05
Di Paolo, A. (AQR-IREA); Matas, A. (GEAP); Raymond, J. Ll. (GEAP)
“Job accessibility, employment and job-education mismatch in the metropolitan area of Barcelona” (Maig 2014)
XREAP2014-06
Di Paolo, A. (AQR-IREA); Mañé, F.
“Are we wasting our talent? Overqualification and overskilling among PhD graduates” (Juny 2014)
XREAP2014-07
Segarra, A. (GRIT); Teruel, M. (GRIT); Bové, M. A. (GRIT)
“A territorial approach to R&D subsidies: Empirical evidence for Catalonian firms” (Setembre 2014)
XREAP2014-08
Ramos, R. (AQR-IREA); Sanromá, E. (IEB); Simón, H.
“Public-private sector wage differentials by type of contract: evidence from Spain” (Octubre 2014)
XREAP2014-09
Bel, G. (GiM-IREA); Bolancé, C. (Riskcenter-IREA); Guillén, M. (Riskcenter-IREA); Rosell, J. (GiM-IREA) “The environmental effects of changing speed limits: a quantile regression approach”
(Desembre 2014)
2015
XREAP2015-01
Bolance, C. (Riskcenter-IREA); Bahraoui, Z. (Riskcenter-IREA), Alemany, R. (Risckcenter-IREA) “Estimating extreme value cumulative distribution functions using bias-corrected kernel approaches” (Gener 2015)
XREAP2015-02
Ramos, R. (AQR-IREA); Sanromá, E. (IEB), Simón, H.
“An analysis of wage differentials between full- and part-time workers in Spain” (Agost 2015)
XREAP2015-03
Cappellari, L.; Di Paolo, A. (AQR-IREA)
“Bilingual Schooling and Earnings: Evidence from a Language-in-Education Reform” (Setembre 2015)
XREAP2015-04
Álvarez-Albelo, C. D., Manresa, A. (CREB), Pigem-Vigo, M. (CREB) “Growing through trade: The role of foreign growth and domestic tariffs” (Novembre 2015)
XREAP2015-05
Caminal, R., Di Paolo, A. (AQR-IREA) Your language or mine?
(Novembre 2015) XREAP2015-06
Choi, H. (AQR-IREA), Choi, A. (IEB)
SÈRIE DE DOCUMENTS DE TREBALL DE LA XREAP
(Novembre 2015)
2016
XREAP2016-01
Castañer, A. (CREB, XREAP); Claramunt, M M. (CREB, XREAP), Tadeo, A., Varea, J. (CREB, XREAP) Modelización de la dependencia del número de siniestros. Aplicación a Solvencia II
(Setembre 2016) XREAP2016-02
García-Quevedo, J. (IEB, XREAP); Segarra-Blasco, A. (GRIT, XREAP), Teruel, M. (GRIT, XREAP) Financial constraints and the failure of innovation projects
(Setembre 2016) XREAP2016-03
Jové-Llopis, E. (GRIT, XREAP); Segarra-Blasco, A. (GRIT, XREAP) What is the role of innovation strategies? Evidence from Spanish firms (Setembre 2016)
XREAP2016-04
Albalate, D. (GiM-IREA, XREAP); Rosell, J. (GiM-IREA, XREAP)
Persistent and transient efficiency on the stochastic production and cost frontiers – an application to the motorway sector (Octubre 2016)
XREAP2016-05
Jofre-Monseny, J. (IEB, XREAP), Silva, J. I., Vázquez-Grenno, J. (IEB, XREAP) Local labor market effects of public employment
(Novembre 2016) XREAP2016-06
Garcia-López, M. A. (IEB, XREAP), Hemet, C., Viladecans-Marsal, E. (IEB, XREAP) Next train to the polycentric city: The effect of railroads on subcenter formation
(Novembre 2016) XREAP2016-07
Vayá, E. (AQR-IREA, XREAP), García, J. R. (AQR-IREA, XREAP), Murillo, J. (AQR-IREA, XREAP), Romaní, J. (AQR-IREA, XREAP), Suriñach, J. (AQR-IREA, XREAP),
Economic impact of cruise activity: the port of Barcelona (Desembre 2016)
XREAP2016-08
Ayuso, M. (Riskcenter, XREAP), Guillen, M. (Riskcenter, XREAP), Nielsen, J. P.
Improving automobile insurance ratemaking using telematics: incorporating mileage and driver behaviour data (Desembre 2016)
XREAP2016-09
Ruíz, A. (GEAP, XREAP), Matas, A. (GEAP, XREAP), Raymond, J. Ll.
How do road infrastructure investments affect the regional economy? Evidence from Spain (Desembre 2016)
2017
XREAP2017-01
Bernardo, V. (GiM-IREA, XREAP); Fageda, X. (GiM-IREA, XREAP) Globalization, long-haul flights and inter-city connections
(Octubre 2017) XREAP2017-02
Di Paolo, A. (AQR-IREA, XREAP); Tansel, A.
Analyzing Wage Differentials by Fields of Study: Evidence from Turkey (Octubre 2017)
XREAP2017-03
Melguizo, C. (AQR-IREA, XREAP); Royuela, V. (AQR-IREA, XREAP)
What drives migration moves across urban areas in Spain? Evidence from the great recession (Octubre 2017)
SÈRIE DE DOCUMENTS DE TREBALL DE LA XREAP
XREAP2017-04
Boonen, T.J., Guillén, M. (RISKCENTER, XREAP); Santolino, M. (RISKCENTER, XREAP) Forecasting compositional risk allocations
(Octubre 2017) XREAP2017-05
Curto‐Grau, M. (IEB, XREAP), Solé‐Ollé, A. (IEB, XREAP), Sorribas‐Navarro, P. (IEB, XREAP) Does electoral competition curb party favoritism?
(Novembre 2017) XREAP2017-06
Esteller, A. (IEB, XREAP), Piolatto, A. (IEB, XREAP), Rablen, M. D. Taxing high-income earners: tax avoidance and mobility
(Novembre 2017) XREAP2017-07
Bolancé, C. (RISKCENTER, XREAP), Vernic, R
Multivariate count data generalized linear models: Three approaches based on the Sarmanov distribution (Novembre 2017)
XREAP2017-08
Albalate, D. (GiM-IREA, XREAP), Bel-Piñana, P. (GiM-IREA, XREAP) Public Private Partnership management effects on road safety outcomes (Novembre 2017)
XREAP2017-09
Teruel, M. (GRIT, XREAP), Segarra, A. (GRIT, XREAP)
Gender diversity, R&D teams and patents: An application to Spanish firms (Novembre 2017)
XREAP2017-10
Cuberes, D., Teignier, M. (CREB, XREAP)
How Costly Are Labor Gender Gaps? Estimates by Age Group for the Balkans and Turkey (Novembre 2017)
XREAP2017-11
Murilló, I. P., Raymond, J. L. (GEAP, XREAP), Calero, J. (IEB, XREAP)
Efficiency in the transformation of schooling into competences: A cross-country analysis using PIAAC data (Novembre 2017)
XREAP2017-12
Giuntella, O., Mazzonnay, F., Nicodemo, C. (GEAP, XREAP), Vargas Silva, C Immigration and the Reallocation of Work Health Risks
(Desembre 2017) XREAP2017-13
Giuntella, O., Nicodemo, C. (GEAP, XREAP), Vargas Silva, C. The Effects of Immigration on NHS Waiting Times
(Desembre 2017) XREAP2017-14
Solé-Ollé, A. (IEB, XREAP), Viladecans-Marsal, E. (IEB, XREAP) Housing Booms and Busts and Local Fiscal Policy
(Desembre 2017) XREAP2017-15
Jové-Llopis, E. (GRIT, XREAP), Segarra-Blasco, A. (GRIT, XREAP) Eco-strategies and firm growth in European SMEs
SÈRIE DE DOCUMENTS DE TREBALL DE LA XREAP
2018
XREAP2018-01
Teruel, E. (GRIT, XREAP), Segarra-Blasco, A. (GRIT, XREAP) Gender diversity, R&D teams and patents: An application to Spanish firms (Febrer 2018)
XREAP2018-02
Palacio, S. M. (GiM, XREAP)
Detecting Outliers with Semi-Supervised Machine Learning: A Fraud Prediction Application (Abril 2018)
XREAP2018-03
Palacio, S. M. (GiM, XREAP)
Machine Learning Forecasts of Public Transport Demand: A comparative analysis of supervised algorithms using smart card data (Abril 2018)