DEMOGRAPHIC RESEARCH
VOLUME 30, ARTICLE 59, PAGES 1621
−
1638
PUBLISHED 22 MAY 2014
http://www.demographic-research.org/Volumes/Vol30/59/ DOI: 10.4054/DemRes.2014.30.59
Descriptive Finding
A geography of unmarried cohabitation
in the Americas
Antonio López-Gay
Anna Turu
Albert Esteve
Sheela Kennedy
Julian López-Colás
Benoît Laplante
Iñaki Permanyer
Ron Lesthaeghe
©2014 Antonio López-Gay et al.
This open-access work is published under the terms of the Creative Commons Attribution NonCommercial License 2.0 Germany, which permits use, reproduction & distribution in any medium for non-commercial purposes, provided the original author(s) and source are given credit.
1 Introduction 1622
2 Methodology 1623
3 Results 1625
4 Conclusions 1631
5 Acknowledgments 1632
References 1633
A geography of unmarried cohabitation in the Americas
Antonio López-Gay1
Albert Esteve2
Julian López-Colás3
Iñaki Permanyer4
Anna Turu5
Sheela Kennedy6
Benoît Laplante7
Ron Lesthaeghe8
Abstract
BACKGROUND
As the incidence of cohabitation has been rising in many parts of the world, efforts to determine the forces driving the cohabitation boom have also been intensifying. But most of the analyses of this issue conducted so far were carried out at a national level, and did not account for regional heterogeneity within countries.
OBJECTIVE
This paper presents the geography of unmarried cohabitation in the Americas. We offer a large-scale, cross-national perspective, together with small-area estimates of cohabitation. We created this map for several reasons. (i) First, our examination of the geography of cohabitation reveals considerable spatial heterogeneity, and challenges the explanatory frameworks which may work at the international level, but which have low explanatory power with regard to intra-national variation. (ii) Second, we argue that historical pockets of cohabitation can still be identified by examining the current
1 Centre d'Estudis Demogràfics, Universitat Autònoma de Barcelona, Spain. E-Mail: [email protected]. 2
Centre d'Estudis Demogràfics, Universitat Autònoma de Barcelona, Spain. 3 Centre d'Estudis Demogràfics, Universitat Autònoma de Barcelona, Spain. 4 Centre d'Estudis Demogràfics, Universitat Autònoma de Barcelona, Spain. 5 Centre d'Estudis Demogràfics, Universitat Autònoma de Barcelona, Spain. 6 University of Minnesota, U.S.A.
geography of cohabitation. (iii) Finally, our map serves as an initial step in efforts to determine whether the recent increase in cohabitation is an intensification of pre-existing traditions, or whether it has different roots that suggest that a new geography may be evolving.
METHODS
Census microdata from 39 countries and 19,000 local units have been pooled together to map the prevalence of cohabitation among women.
RESULTS
The results show inter- and intra-national regional contrasts. The highest rates of cohabitation are found in areas of Central America, the Caribbean, Colombia, and Peru. The lowest rates are mainly found in the United States and Mexico. In all of the countries, the spatial autocorrelation statistics indicate that there is substantial spatial heterogeneity.
CONCLUSIONS
Our results lead us to ask what forces may have shaped these patterns, and they remind us that these forces need to be taken into account when seeking to explain recent cohabitation patterns, and especially the rise in cohabitation.
1. Introduction
contrast, in countries with weak or non-existent traditions of cohabitation, social and regional heterogeneity in cohabitation patterns provide us with information about the social groups and regions that spearheaded the trend. While there is a sizeable amount of literature on the social gradient of cohabitation and its theoretical implications (Lesthaeghe and van de Kaa 1986; van de Kaa 1987; Perelli-Harris et al. 2010; Kenney and Goldstein 2012), scholars have devoted less attention to regional differences in cohabitation trends. Most of the existing research on cohabitation was carried out at a national level, and thus did not account for regional heterogeneity within countries (exceptions include Klüsener et al. 2013 and Coale and Watkins 1986).
To fill this gap in the research, we present in this article a detailed geography of unmarried cohabitation in the Americas. We have created a map of 39 countries extending from Canada to Argentina with more than 19,000 spatial units in which the percentages of cohabiting women among all women aged 25-29 who are in union are represented. By showing the spatial heterogeneity in cohabitation patterns, our goal is to reveal the marked regional differences that exist both across and within countries. Our map represents a first step toward explaining the roots and the causes of the recent cohabitation boom. Specifically, we examine the question of whether the current rise in cohabitation is basically an intensification of pre-existing traditions, and can therefore be seen as history’s “revenge;” or whether it has different roots and follows new geographic patterns. In either case, a time-based perspective will be needed to answer this question. At this stage, our map primarily documents the dominant picture of cohabitation in the year 2000, but not the degree to which this picture has changed over time. Although we have not traced developments over time, we argue that historical pockets of cohabitation can still be identified by examining the current geography of cohabitation9.
2. Methodology
The results presented in this paper were obtained using census data from the 2000 census round. Assembling these data involved working with more than 20 million individual records of women aged 25−29 from 39 countries and 19,191 administrative units. For each unit, we have computed the percentage of 25−29-year-old women in a
9 We have used local spatial autocorrelation statistics to examine the map of cohabitation in Brazil for 1980,
union who were cohabiting10 (See Appendix B). The method used to distinguish between cohabiting and married couples was similar across all of the countries except for the United States. In all of the Latin American countries and in Canada, the census includes an explicit category on cohabitation within the marital or relationship status questions. For the United States, cohabiting couples had to be identified based on their relationship to the head of household and marital status: the unmarried partner of an unmarried head of household is considered to be in a cohabiting union.11
In all of the countries except Bolivia, Chile, El Salvador, and Honduras, we used the lowest geographical level at which we could compute the prevalence of cohabitation among 25-29-year-old women in relationships. In Bolivia, for instance, we used the 314
secciones instead the 1,384 cantones; in Chile, we used 314 municipios instead of 2,881
distritos; in El Salvador, we used 261 municipios in place of 2,270 cantones; and in Honduras, we used 298 municipios instead of 3,727 aldeas. The primary reason for not using the lowest geographic detail in these four countries was that more than 50% of these areas had fewer than 25 women of our targeted ages, which added a considerable degree of local uncertainty. Even with these precautions, 5% of the areas considered in the final map had fewer than 25 women in the denominator; and of these areas, 25% had extreme estimates of cohabitation that were below 10% or above 90%. We used Spatial Empirical Bayes (SEB) techniques (see Assunçao et al. 2005) to smooth the rates in a particular area only when the estimate was based on a small sample size and differed significantly from the estimates of its neighboring units. The map with the unsmoothed rates does not differ significantly from the map with the smoothed rates (results and details are available from the authors).
10 The levels of cohabitation at ages 25−29 vary between men and women because women form unions at
earlier ages. However, the geography of cohabitation is essentially the same regardless of which sex is taken as a reference. Since the main focus of the paper is to identify the hotspots of cohabitation and not to compare patterns between men and women, and in order to avoid unnecessary repetition, we decided to show only results for women. The degree of correlation between female and male cohabitation rates across local units is 0.93. Concentrating on the 25−29 age group permitted us to compare successive cohorts at ages at which education has been completed and patterns of family formation are becoming clear. Analyses of alternative age groups yielded exactly the same spatial patterning. The degree of correlation between the cohabitation rates of females ages 25−29 and of females ages 35−39 across local units is 0.87.
11 Recent research has shown that this approach underestimates US cohabitation levels by 20% compared to
3. Results
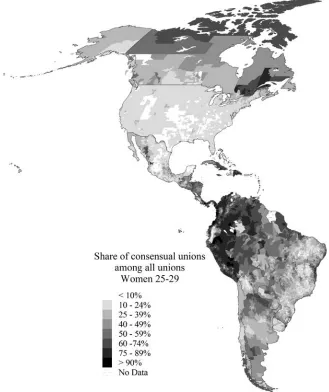
The spatial distribution of cohabitation in the Americas (as measured by the smoothed estimator) is shown in Map 1. Around the year 2000 across the Americas, the cohabitation rate among 25−29-year-old women in a relationship was approximately 35%. The highest rates of cohabitation were found in Central America, the Caribbean, Colombia, and Peru; while, the lowest cohabitation rates were mainly found in the United States and Mexico. Canada, Brazil, Bolivia, Paraguay, Argentina, Uruguay, and Chile occupied intermediate positions in 2000.
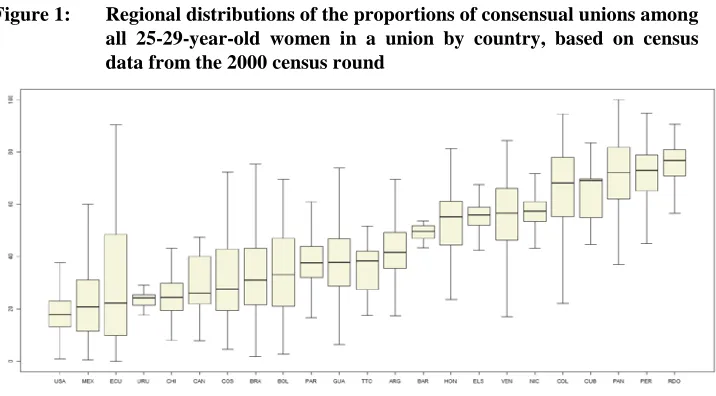
As we can clearly see in Map 1 and the boxplots in Figure 1, there is a huge degree of variation in the incidence of cohabitation both across and within countries. The lowest values are observed in the US, while the highest values are found in Panama, Peru, and the Dominican Republic. The boxplots graphically depict the lower, the median, and the upper quartiles for each country. The countries are ordered on the basis of their median values. Most of the Caribbean countries are not represented here because we had only one observation. The median values range from 11.5% in the United States to 78.9% in the Dominican Republic. The United States is the only country where the median value is below 20%. A very diverse set of countries can be found in the 20% to 40% range, including Mexico, Canada, Brazil, Uruguay, Argentina, Bolivia, Paraguay, Costa Rica, and Trinidad and Tobago. In the 40% to 60% range are Venezuela and Barbados as well as three Central American countries: El Salvador, Nicaragua, and Honduras. Five countries have median value above 60%: Colombia, Cuba, Panama, Peru, and the Dominican Republic.
Map 1: Share of consensual unions among all 25- to-29-year-old women in a union based on census data from the 2000 census round (color version*)
Figure 1: Regional distributions of the proportions of consensual unions among all 25-29-year-old women in a union by country, based on census data from the 2000 census round
Source: Authors’ own work based on census microdata from the represented countries (see Appendix B for the exact sources).
Figure 2: Distribution of the population by level of cohabitation of the administrative units
Source: Authors’ own work based on census microdata from the represented countries.
0% 10% 20% 30% 40% 50% 60% 70% 80% 90% 100%
USA MEX ECU URU CHI CAN COS BRA BOL PAR GUA TTO ARG BAR HON ELS VEN NIC COL CUB PAN PER RDO
To supplement the information in the boxplots, in Figure 2 we present the relative distributions of each country's population based on the level of cohabitation of the administrative unit in which they reside. The countries are ordered as in Figure 1. By 2000, 60% of the population in the United States lived in areas where cohabiting couples represented less than 20% of all unions. At the other extreme, virtually the whole population of the Dominican Republic resided in areas where cohabiting couples comprised of more than 60% of all unions. Generally, the higher the country's median level of cohabitation (as shown in Figure 1), the higher the share of the population who reside in areas where 40% of couples cohabit. Ecuador and Canada are the two exceptions to this rule. In both countries, and particularly in Canada, similar percentages of the population live in areas with both low and high levels of cohabitation.
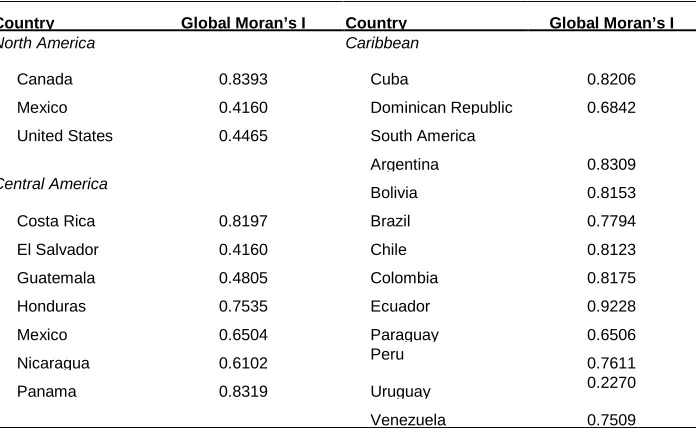
The dispersion results shown in Figure 1 are not informative in terms of the spatial distribution of cohabitation within countries. In Table 1, we report the degree of spatial autocorrelation using Global Moran’s I index12 for the largest countries of the Americas (the index cannot be computed for many Caribbean countries with a single administrative unit, as the computation requires a comparison of the levels of cohabitation between different administrative units within each country). Most countries have moderate to high levels of spatial autocorrelation. This is particularly true in Ecuador, Colombia, Chile, Bolivia, Argentina, Cuba, Panama, Costa Rica, and Canada, where Moran’s I index is above 0.8. A Global Moran value above 0.8 indicates that there is strong spatial clustering in these countries, which means that the observed levels of cohabitation are not randomly distributed within countries, but that there are clusters of local areas with high levels of cohabitation, and others with low levels. As we can see in Map 1, the parroquias in the Andean region of Ecuador have extremely low levels of cohabitation, whereas the parroquias in the Amazonian and coastal regions have very high levels of cohabitation. Canada has a level of clustering similar to that of Ecuador. The highest rates of cohabitation are clearly clustered in the province of Quebec. At the other extreme, the countries with the lowest values of the Global Moran index (Mexico and the United States) show the lowest levels of cohabitation. The low values observed in Uruguay (0.227) might have been influenced by the low degree of geographical detail in that country.
12The Global Moran’s I index is defined as 𝐼=� 𝑛
∑ ∑ 𝑤𝑖 𝑗 𝑖𝑗�
∑ ∑ 𝑤𝑖 𝑗 𝑖𝑗𝑧𝑖𝑧𝑗
∑ 𝑧𝑖𝑖2 where the observations zi,zj are in units of deviation from the mean, and the weights wij take a value of 1 whenever “”" and “j” are neighbors, and zero
Table 1: Global Moran’s I based on census data from the 2000 census round
Country Global Moran’s I Country Global Moran’s I
North America Caribbean
Canada 0.8393 Cuba 0.8206
Mexico 0.4160 Dominican Republic 0.6842
United States 0.4465 South America
Argentina 0.8309
Central America
Bolivia 0.8153
Costa Rica 0.8197 Brazil 0.7794
El Salvador 0.4160 Chile 0.8123
Guatemala 0.4805 Colombia 0.8175
Honduras 0.7535 Ecuador 0.9228
Mexico 0.6504 Paraguay 0.6506
Nicaragua 0.6102 Peru 0.7611
Panama 0.8319 Uruguay 0.2270
Venezuela 0.7509
Source: Authors’ own work based on census microdata from the represented countries (see Appendix B for the exact sources).
To find out where the geographical pockets of high and low cohabitation are, we calculated the Local Moran’s I for each spatial unit (Anselin 1995) in the Americas. In this exercise, we did not impose country boundaries. Map 2 allows for a visual inspection of the cluster analysis. The high-high and the low-low locations are referred to as spatial clusters, and the high-low and low-high locations are spatial outliers.
Map 2: Local indicators of spatial autocorrelation (LISA) of the share of consensual unions based on census data from the 2000 census round
Spatial clusters of areas with low levels of cohabitation are mainly found in North America, and cover virtually all areas in the United States, most areas of Mexico, and the areas located in the south-central part of Canada near the US border. In South America, low-low units are mainly found around the metropolitan area of Santiago de Chile, in the western regions of Bolivia, in the Ecuadorian Andes, in Uruguay, and in southern and eastern Brazil (with the exception of Brazil’s Atlantic coast). In Central America, low-levels are found only on the Pacific coast of Costa Rica.
4. Conclusions
In this paper we explored the distribution of cohabitation in the Americas with unprecedented levels of geographical coverage and detail. Using complete census microdata from virtually all of the countries in the region, we have presented a highly detailed map of cohabitation that includes more than 19,000 administrative units. Our study illustrates the power of geography to reveal considerable regional heterogeneity across and within countries. We have shown that the prevalence of cohabitation varies dramatically across the Americas, from low levels in the United States and Mexico to high levels in Central America, the Caribbean, and the Amazonian and tropical areas. The macro-regional patterning of cohabitation has to be re-examined in light of the substantial degree of heterogeneity within countries. The global indicators of spatial autocorrelation uncovered significant levels of spatial clustering, especially countries like Ecuador, Canada, and Brazil. At the continental scale, the US appears to be one of the most homogeneous countries in the Americas.
5. Acknowledgments
This research has been funded by the WorldFam project, European Research Council (ERC-2009-StG-240978) and the project “Inmigración internacional y familia en España: trayectorias de pareja en perspectiva transnacional” (CSO2011-24544)” funded by the Spanish Minister of Science and Innovation. Albert Esteve is the Principal Investigator of both projects.
References
Anselin, L. (1995). Local Indicators of Spatial Association—LISA. Geographical Analysis 27(2): 93−115. doi:10.1111/j.1538-4632.1995.tb00338.x.
Assunção, R.M., Schmertmann, C.P., Potter, J.E., and Cavenaghi, S.M. (2005). Empirical bayes estimation of demographic schedules for small areas.
Demography 42(3): 537−558. doi:10.1353/dem.2005.0022.
Binstock, G. (2008). Cambios en la formacion de la familia en Argentina: cuestion de tiempo o cuestion de forma? Paper presented at the Congress of the Latin American population Association (ALAP), Cordoba, Argentina, September 24−26.
Cabella, W., Peri, A., and Street, M.C. (2004). Dos orillas y una transicion ? La segunda transición demografica en Buenos Aires y Montevideo en perspectiva biografica. Paper presented at the Congress of the Latin American Population Association (ALAP), Caxambu MG, Brazil, September 18-20.
Castro-Martin, T. (2002). Consensual Unions in Latin America: Persistence of a Dual Nuptiality System. Journal of Comparative Family Studies 33(1): 35−55.
Cherlin, A.J. (2004). The deinstitutionalization of American marriage. Journal of Marriage and Family 66(4): 848−861. doi:10.1111/j.0022-2445.2004.00058.x. Coale, A.J. and Watkins, S.C. (eds.) (1986). The Decline of Fertility in Europe: The
Revised Proceedings of a Conference on the Princeton European Fertility Project. Princeton: Princeton University Press.
Esteve, A., Lesthaeghe, R., and López-Gay, A. (2012). The Latin American Cohabitation Boom, 1970–2007. Population and Development Review 38(1): 55−81. doi:10.1111/j.1728-4457.2012.00472.x.
Kennedy, S. and Bumpass, L.L. (2008). Cohabitation and children's living arrangements: New estimates from the United States. Demographic Research
19(47): 1663−1692. doi:10.4054/DemRes.2008.19.47.
Kenney, C.T. and Goldstein, J. (2012). Too poor to marry? A cross-national comparison of the SES-gradient in non-marriage. Paper presented at the Stockholm, European Population Conference, June 13−16.
Klüsener, S., Perelli-Harris, B., and Sánchez Gassen, N. (2013). Spatial Aspects of the Rise of Nonmarital Fertility Across Europe Since 1960: The Role of States and Regions in Shaping Patterns of Change. European Journal of Population 29(2): 137−165. doi:10.1007/s10680-012-9278-x.
Le Bourdais, C. and Lapierre-Adamcyk, É. (2004). Changes in conjugal life in Canada: Is cohabitation progressively replacing marriage? Journal of Marriage and Family 66(4): 929−942. doi:10.1111/j.0022-2445.2004.00063.x.
Lesthaeghe, R.J. and van der Kaa, D.J. (1986). Twee demografische transities? In: van der Kaa, D.J. and Lesthaeghe, R.J. (eds.). Bevolking: Groei en krimp. Deventer: Van Loghum Slaterus: 9−24.
Minnesota Population Center (2011). Integrated Public Use Microdata Series International: Version 6.1 [electronic resource]. Minneapolis: University of Minnesota. https://international.ipums.org/international/.
Perelli-Harris, B., Sigle-Rushton, W., Kreyenfeld, M., Lappegård, T., Keizer, R., and Berghammer, C. (2010). The Educational Gradient of Childbearing within Cohabitation in Europe. Population and Development Review 36(4): 775−801. doi:10.1111/j.1728-4457.2010.00357.x.
Quilodran, J. (2022). Atisbos de cambios en la formación de las parejas conyugales a fines del milenio. Papeles de Población 6(25): 9−19.
Van de Kaa, D.J. (1987). Europe's Second Demographic Transition. Population Bulletin
42(1): 3−57.
Appendix A
Table A1: Share of cohabiting women (ages 25-29) by country and census round
Country 1970 1980 1990 2000 2010 Dif, 2010-1970
Argentina 11.1% 13.0% 22.5% 41.3% 66.6% 55.5
Bolivia . . . 34.7%
Brazil 7.6% 13.0% 22.2% 39.3% 51.0% 43.4
Canada 21.4% 36.1% 44.9%
Chile 4.6% 6.7% 11.3% 24.6%
Colombia 19.7% 33.2% 49.2% 65.6%
Costa Rica 16.8% 19.4% . 32.6% 48.5% 31.7
Cuba . . . 55.8%
Ecuador 26.9% 29.4% 30.1% 37.4% 47.4% 20.5
El Salvador 53.1% 54.0%
Mexico 15.3% . 15.2% 22.7% 37.1% 21.8
Nicaragua 42.7% 54.9% 55.5%
Panama 58.9% 52.3% 53.2% 62.5% 73.9% 15.0
Peru . . 43.1% 69.8%
Puerto Rico 8.5% 5.2% 12.0%
United States 11.7% 18.4% 27.3%
Uruguay 9.6% 14.0% 23.5% 70.8% 61.2
Venezuela 30.8% 32.6% 36.9% 51.6%
Appendix B
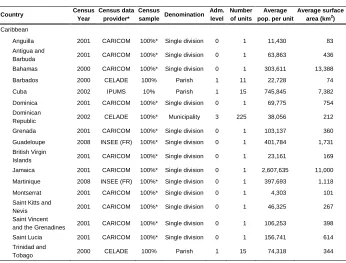
Table B1: Summary of the census data, boundary files, and geographic details used to analyze the prevalence of consensual unions in the Americas in the 2000 census round
Country Census
Year
Census data provider*
Census
sample Denomination Adm. level
Number of units
Average pop. per unit
Average surface area (km2
)
North America
Canada 2001 STATCAN 20% Census division 2 288 104,191 34,669
Mexico 2000 CELADE 100% Municipality 2 2,443 39,711 803
United States 2000 IPUMS 5% PUMA 3 2,071 135,887 4,744
Central America
Belize 2000 CARICOM 100%* Single division 0 1 232,111 21,989
Costa Rica 2000 CELADE 100% District 3 459 8,301 112
El Salvador 2007 CELADE 100% Municipality 2 262 21,924 77
Guatemala 2002 CELADE 100% Municipality 3 331 33,949 327
Honduras 2001 CELADE 100% Municipality 2 298 20,392 377
Nicaragua 2005 CELADE 100% Municipality 2 153 33,609 787
Panama 2000 CELADE 100% Corregimiento 3 592 4,793 126
South America
Argentina 2000 CELADE 100% Department 2 532 68,158 5,223
Bolivia 2001 CELADE 100% Section 3 314 26,351 3,442
Brazil 2000 CELADE 100% Municipality 3 5,507 30,847 1,543
Chile 2002 CELADE 100% Commune 3 342 44,200 2,220
Colombia 2005 DANE 100% Municipality 2 1,113 36,995 994
Ecuador 2001 CELADE 100% Parish 3 995 12,218 255
French Guyana 2008 INSEE (FR) 100%* Single division 0 1 219,266 83,299
Paraguay 2002 CELADE 100% Census District 2 241 21,424 1,655
Peru 2007 CELADE 100% District 3 1,833 14,955 702
Rep. of Guyana 2002 CARICOM 100%* Single division 0 1 751,230 209,739
Uruguay 1996 CELADE 100% Department 1 19 166,514 9,340
Table B1: (Continued)
Country Census
Year
Census data provider*
Census
sample Denomination Adm. level
Number of units
Average pop. per unit
Average surface area (km2) Caribbean
Anguilla 2001 CARICOM 100%* Single division 0 1 11,430 83
Antigua and
Barbuda 2001 CARICOM 100%* Single division 0 1 63,863 436
Bahamas 2000 CARICOM 100%* Single division 0 1 303,611 13,388
Barbados 2000 CELADE 100% Parish 1 11 22,728 74
Cuba 2002 IPUMS 10% Parish 1 15 745,845 7,382
Dominica 2001 CARICOM 100%* Single division 0 1 69,775 754
Dominican
Republic 2002 CELADE 100%* Municipality 3 225 38,056 212
Grenada 2001 CARICOM 100%* Single division 0 1 103,137 360
Guadeloupe 2008 INSEE (FR) 100%* Single division 0 1 401,784 1,731
British Virgin
Islands 2001 CARICOM 100%* Single division 0 1 23,161 169
Jamaica 2001 CARICOM 100%* Single division 0 1 2,607,635 11,000
Martinique 2008 INSEE (FR) 100%* Single division 0 1 397,693 1,118
Montserrat 2001 CARICOM 100%* Single division 0 1 4,303 101
Saint Kitts and
Nevis 2001 CARICOM 100%* Single division 0 1 46,325 267 Saint Vincent
and the Grenadines 2001 CARICOM 100%* Single division 0 1 106,253 398
Saint Lucia 2001 CARICOM 100%* Single division 0 1 156,741 614
Trinidad and
Tobago 2000 CELADE 100% Parish 1 15 74,318 344
Appendix C
Table C3: Share of consensual unions among all 25- to 29-year-old women in a union based on census data from the 2000 census round (black-and-white version)