118
Chapter 8. Determination of nitrate in soils using mid-infrared
spectroscopy
R. Linker
Civil and Environmental Engineering,
Technion-Israel Institute of Technology, Haifa 32000, Israel
Email: [email protected]
ABSTRACT
Excessive fertilization causes significant environmental damage, both in water
sources and in soils. The "precision agriculture" concept, whose goal is to adjust
fertilization based on crop needs and soil properties, has the potential of reducing the
amount of fertilizer used without diminishing yield. However, the lack of adequate
sensors, and in particular the lack of real-time sensors for soil nitrate, is preventing
large-scale implementation of this approach.
This paper presents several approaches based on mid-infrared spectroscopy that
have been recently developed for determination of nitrate in agricultural soils. The
first method is based on Attenuated Total Reflectance (ATR) spectroscopy. The main
drawbacks of this direct method is that the soil sample must be close to water
saturation and that soil constituents, and in particular calcium carbonate, may
interfere with nitrate determination. Several mathematical procedures that have been
developed to minimize the effect of the interferences and increase accuracy are
reviewed and compared. The two other methods are based on the combined use of
mid-infrared spectroscopy and ion-exchange membranes, which are considered to
mimic nutrient uptake by plants and have been used to estimate nutrient availability
in numerous studies. It is shown how mid-infrared spectroscopy can replace
standard chemical analysis to estimate the amount of ions sorbed onto the
membrane, using either transmittance (if membrane absorbance is sufficiently low) or
119
Introduction
Modern chemical fertilization, and in particular nitrogen fertilization, has led to
significant increase of crop yield. However, fertilizers tend to be applied in excess,
causing considerable pollution to both soil and ground water. In particular, nitrate has
been associated with various health and environmental problems (Castelnuovo,
1995; Addiscott et al., 1991). Fertilizer application could be significantly reduced by
implementing the “precision fertilization” concept, which aims at adjusting the
fertilization rate to the actual crop demand. One of the main obstacles to large-scale
implementation of this concept is the lack of reliable and fast sensors for direct
monitoring of soil nutrients (Roblin and Barrow, 2000; Robert, 2002). Promising
results toward the development of such sensors for nitrate have been reported with
various modern methods such as ion selective electrodes (Adsett et al., 1999), ion
sensitive field effect transistor (Birrell and Hummel, 2000), and near- and mid-infrared
spectroscopy (Ehsani et al., 1999, 2001; Shaviv et al., 2003). In addition to those
direct approaches, an indirect method based on ion-exchangers (membranes or
resins) has been developed. Ion-exchangers are believed to mimic closely the
physical process of nutrient uptake by plants, and can thus serve as reliable tools for
evaluating nutrient availability in agricultural fields or environmental systems (Qian
and Schoenau, 2002a,b). In particular, Qian and Schoenau (2005) have shown that
ion exchange membranes in the form of so-called “plant root simulator probes” could
be used to asses soil nitrogen-supply power (NSP). Nutrient availability is determined
by letting the ion-exchanger interact with the soil for a known period of time, after
which it is removed and eluted with strong extractants. Standard chemical methods
are used for quantitative determination of the nutrients in the extracts. Such
procedures are time consuming and ion-dependent, and require the use of chemicals
both for de-sorbing the ions and analyzing the extracts.
The present paper reviews recent developments related to the use of mid-infrared
spectroscopy for fast and accurate determination of nitrate in agricultural soils. Three
approaches are briefly described and compared: Attenuated Total Reflectance (ATR)
for direct determination of nitrate in saturated pastes, combined use of ion-exchange
membranes and transmittance spectroscopy, and combined use of ion-exchange
membranes and photoacoustic spectroscopy.
Attenuated total reflectance of soil pastes
Attenuated total reflectance (ATR) is commonly used for analysis of liquids and
120
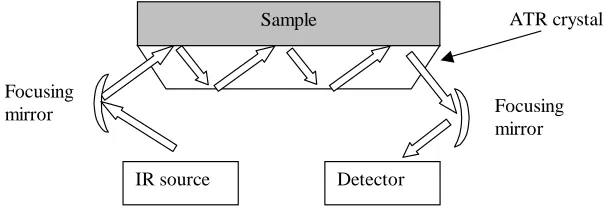
Aochi, 1996). The method relies on a crystal with a high refractive index that serves
as a waveguide in which the IR radiation propagates. During the measurement, the
crystal is in contact with the sample and the beam is directed in such a way that it
hits the crystal/sample interface several times before being directed to the detector
(Fig. 1). Whenever it hits the interface, the beam penetrates a few microns into the
sample, so that the signal that reaches the detector contains information about the
absorbance of the sample. Since the penetration depth is limited to a few microns,
very good contact between the sample and the crystal is required, which for nitrate
determination in soil can be achieved by working with samples close to water
saturation (Shaviv et al., 2003, Linker et al., 2004, 2005, 2006). However, water
absorbance in the mid-infrared range is very strong and, as shown below, the
presence of water interferes with nitrate determination.
IR source Detector Focusing
mirror Focusing
[image:3.595.115.420.332.439.2]mirror Sample ATR crystal
Fig. 1. Schematic description of the attenuated total reflectance (ATR) spectroscopy
approach
Figure 2 shows typical spectra of de-ionized water and de-ionized water and sandy
soil with 1000 mg[nitrate N]/kg[water]. Two absorbance bands characteristic of water
(e.g. Libnau et al., 1994) are clearly visible in all three spectra. The water band
centered around 1640 cm-1 is much larger than the nitrate band visible around 1350
cm-1. It can also been seen the spectra are slightly biased or tilted relative to each
other (see the circled regions in Fig. 2), and the magnitude of these changes is
similar to the size of the nitrate band itself despite the unrealistically high nitrate
concentration used in the Figure. For realistic nitrate concentrations, these changes
are an order of magnitude larger than the nitrate band itself. As a result, the spectra
need to be properly corrected prior to quantitative analysis, which can be achieved by
careful subtraction of the water contribution to the spectrum and baseline correction
121
Fig. 2. Typical ATR spectra of de-ionized water (bold), de-ionized water with 1000
mg[nitrate N]/kg[water] (thin) and sandy soil paste with 1000 mg[nitrate N]/kg[water]
(dashed).
Figure 3 shows typical water-subtracted spectra of saturated soil pastes. The nitrate
band (around 1350 cm-1) is clearly visible in the spectra of the sandy soils (Soils
#1-3), but for calcareous soils (Soils #4-6) a strong interference band due to calcium
carbonate appears around 1450 cm-1 and the nitrate band is hardly visible. As a
result, although a strong correlation exists between the nitrate absorbance band and
the nitrate concentration, this correlation is soil dependent. Straightforward
quantitative analysis, such as using the area under the nitrate band as a predictor
regardless of the soil type, leads to very poor results (not shown). Quantitative
analysis of the spectra must therefore be conducted with chemometrics tools such as
partial least squares (PLS) (Linker et al., 2004), neural networks (NN) (Linker et al.,
2005) or wavelets (Jahn et al., 2006). Determination accuracy can further be
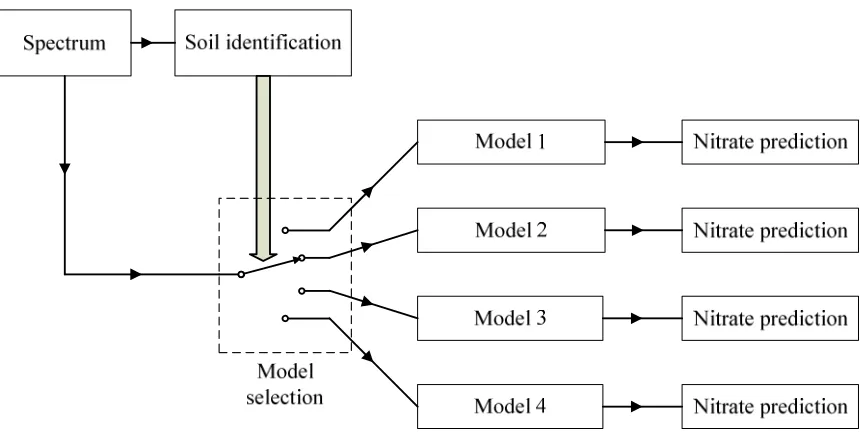
improved by using a two-step approach according to which the soil type is
122
be used (Fig. 4). Soil identification can be achieved by comparing the ATR spectrum
of the sample to a reference library, using either simple correlation calculations or
more sophisticated classifiers such as neural networks (Linker et al., 2005, 2006).
800 1000 1200 1400 1600 -0.1 0 0.1 0.2 0.3 0.4 0.5 Soil #6 800 1000 1200 1400 1600 -0.1 0 0.1 0.2 0.3 0.4 0.5 Soil #2 800 1000 1200 1400 1600 -0.1 0 0.1 0.2 0.3 0.4 0.5 Soil #4 A b s o rb a n c e u n it s 800 1000 1200 1400 1600 -0.1 0 0.1 0.2 0.3 0.4 0.5 Soil #1 A b s o rb a n c e u n it s 800 1000 1200 1400 1600 -0.1 0 0.1 0.2 0.3 0.4 0.5 Soil #5
Wavenumber, cm-1
[image:5.595.102.471.159.460.2]800 1000 1200 1400 1600 -0.1 0 0.1 0.2 0.3 0.4 0.5 Soil #3 NO 3 CO 3
Fig. 3. Water subtracted and baseline corrected spectra of six soils commonly used
in Israeli agriculture. In each frame, the various lines correspond to increasing nitrate
concentrations. The top frames correspond to light sandy soils and the bottom
123
Fig. 4. Schematic representation of the two-step approach proposed by Linker et al.
(2005, 2006)
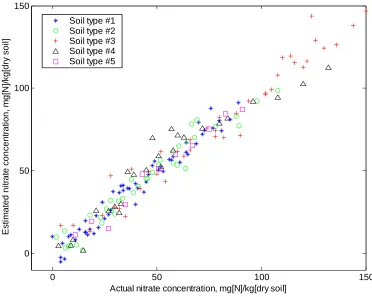
Typical results are presented in Fig. 5, which shows the actual vs. estimated nitrate
concentration in five soil types that differ in terms of calcium carbonate, clay and
organic matter content. The determination errors range from 5mg[N]/kg[dry soil] for
light sandy soils (soil type #1) to 8mg[N]/kg[dry soil] for clay soils with high calcium
carbonate concentration (soil type #3). Similar results were reported in Linker et al.
(2004, 2005, 2006), and consistently indicated that high carbonate content is the
124
0 50 100 150
0 50 100 150
Actual nitrate concentration, mg[N]/kg[dry soil]
E s ti m a te d n it ra te c o n c e n tr a ti o n , m g [N ]/ k g [d ry s o il ]
Soil type #1 Soil type #2 Soil type #3 Soil type #4 Soil type #5
Fig. 5. Actual vs. estimated nitrate concentration for five soil types. Nitrate
determination based on ATR spectra of saturated soil pastes, soil identification, and
soil-dependent partial last squares models.
Transmittance analysis of ion exchange membranes
As mentioned in the Introduction, ion-exchange membranes are commonly used in
studies dealing with nutrient availability, and standard chemical methods are used to
determine the amount of nutrients sorbed onto the membranes. Recently, Linker and
Shaviv (2006) showed that transmittance spectroscopy could replace such chemical
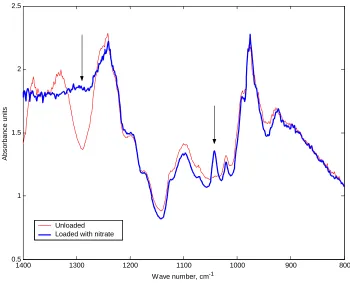
analyses. Figure 6 shows the spectra of unloaded and loaded membranes (BDH
55164-2S). The membranes were loaded by placing them into one-to-one soil pastes
for 30 minutes, after which they were rinsed with water and wiped dry with sterile
wipes. The spectrum of the loaded membrane shows two regions that can be
associated with nitrate loading (indicated by arrows). Linker and Shaviv (2006)
investigated the use of these two regions for quantitative analysis and concluded that
the small but well-defined band centered at 1040 cm-1 yields more accurate
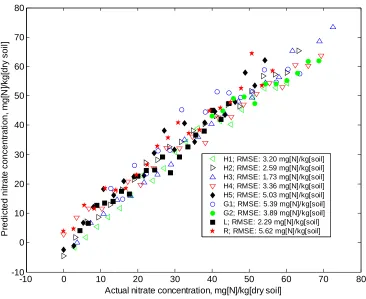
predictions. Typical results are shown in Fig. 7, and the high correlation between
[image:7.595.98.470.90.387.2]125
error is approximately 1.3 µeq, which for the pastes used corresponds to 3.6
mg[N]/kg[dry soil]. Such determination errors are significantly lower than those
achieved with the ATR approach. In addition, contrary to the ATR results, the
determination accuracy is not affected by calcium carbonate content or other soil
constituents, and the method is very robust.
800 900
1000 1100
1200 1300
1400 0.5
1 1.5 2 2.5
Wave number, cm-1
A
b
s
o
rb
a
n
c
e
u
n
it
s
[image:8.595.121.471.185.468.2]Unloaded Loaded with nitrate
Fig. 6. Transmittance spectra of unloaded and loaded BDH membrane. The arrows
126
-10 0 10 20 30 40 50 60 70 80
-10 0 10 20 30 40 50 60 70 80
Actual nitrate concentration, mg[N]/kg[dry soil]
P re d ic te d n it ra te c o n c e n tr a ti o n , m g [N ]/ k g [d ry s o il ]
[image:9.595.103.469.88.387.2]H1; RMSE: 3.20 mg[N]/kg[soil] H2; RMSE: 2.59 mg[N]/kg[soil] H3; RMSE: 1.73 mg[N]/kg[soil] H4; RMSE: 3.36 mg[N]/kg[soil] H5; RMSE: 5.03 mg[N]/kg[soil] G1; RMSE: 5.39 mg[N]/kg[soil] G2; RMSE: 3.89 mg[N]/kg[soil] L; RMSE: 2.29 mg[N]/kg[soil] R; RMSE: 5.62 mg[N]/kg[soil]
Fig. 7. Actual vs. estimated charge on BDH membrane for four soil types: light sandy
soils (H); clay soils with high calcium carbonate and medium (G) and high (L) clay
content; and soil with very high calcium carbonate content (R).
Photoacoustic analysis of ion exchange membranes
The main limitation of the transmittance-based method presented in the previous
section is the requirement that the membrane be sufficiently transparent in the mid-IR
range. Unfortunately, a wide variety of commercially-available ion exchange
membranes, and in particular those used for water purification, are too thick for
transmittance measurements. In such a case, photoacoustic spectroscopy (PAS) can
be used instead. Photoacoustic spectroscopy is based on the absorption of
electromagnetic radiation by the sample and non-radiative relaxation that leads to
local warming of the sample. Pressure fluctuations are then generated by thermal
expansion, which can be detected by a very sensitive microphone (Fig. 8). In this
fashion, highly absorbing solid samples can be analyzed without any special
127
Fig. 8. Schematic description of photoacoustic spectroscopy
Typical photoacoustic spectra of ion-exchange membranes (AR103, Ionics Inc.)
unloaded and loaded with nitrate are shown in Fig. 9 and the nitrate band is clearly
visible in the 1300-1500 cm-1 interval. Quantitative results obtained by applying PLS
to the 1200-1550 cm-1 interval are shown in Fig. 10. The average determination error
is about 2.2 µeq (6.3 mg[N]/kg[dry soil]). Although this is about 50% higher than the
error achieved with the transmittance technique, such errors are similar to the ones
obtained with ATR and show that for ion exchange membranes for which
transmittance measurements are not possible (such as the AR103 used in this
study), reasonably accurate quantitative analysis can be achieved by photoacoustic
spectroscopy.
Modulated IR radiation
Sample
KBr
Heliu
Compute
IR
128 500 1000 1500 2000 2500 3000 3500 40000 0.1 0.2 0.3 0.4 0.5 0.6
Wavenumber, cm-1
[image:11.595.160.471.88.343.2]P A S u n it s Unloaded membrane Loaded membrane
Fig. 9. Photoacoustic spectra of unloaded and loaded AR103 membrane.
-5 0 5 10 15 20 25 30 35 40
-5 0 5 10 15 20 25 30 35 40
Actual charge in soil paste, µeq
E s ti m a te d m e m b ra n e l o a d in g
, µ
e
q
Fig. 10. Actual vs. estimated charge on AR103 membrane. The various symbols
[image:11.595.159.473.407.659.2]129
Conclusion
Mid-infrared spectroscopy appears to be a very promising tool for rapid determination
of nitrate concentration in agricultural soils, either directly or in combination with ion
exchange membranes. Direct determination by ATR spectroscopy requires minimal
sample preparation, but advanced data processing is necessary to minimize
interferences due to water and soil constituents, in particular calcium carbonate that
has an absorbance band that overlaps with the nitrate one. Typical determination
errors range from 5 to 8 mg[N]/kg[dry soil], with the lowest errors corresponding to
light sandy soils.
When used together with ion-exchange membranes, mid-infrared spectroscopy can
replace the standard chemical methods that are traditionally used to estimate the
ions sorbed onto the membrane. If the membrane is sufficiently transparent in the
mid-IR range, transmittance spectroscopy can be used and very accurate
determination can be achieved (average determination error less than 4 mg[N]/kg[dry
soil]). For membranes that are not transparent in the mid-IR range, photoacoustic
spectroscopy can be used. Although the determination errors are larger (about 6
mg[N]/kg[dry soil]), such errors would still be acceptable for most agricultural
applications.
Acknowledgments
This study has been supported by the US-Israel Binational Research and
Development Fund (BARD Project US-3293-20c) and by the Grand Water Research
Institute (GWRI) at the Technion-ITT.
References
Adsett JF, Thottan JA and Sibley KJ 1999 Development of an automated on-the-go
soil nitrate monitoring system. Applied Engineering in Agriculture 15, 351-356.
Birrell SJ and Hummel JW 2000 Membrane selection and ISFET configuration
130
Addiscott TM, Whitmore AP and Powlson DS 1991 Farming, fertilizers and the
nitrate Problem (C.A.B. International, Wallingford, UK).
Castelnuovo R 1995 Environment concerns driving site-specific management in
agriculture. In Proceedings of the Second International Conference on Site-Specific
Management for Agricultural Systems. Eds. PC Robert, R H Rush and WE Larson
(ASA-CSSA-SSSA, Madison, Wisconsin, USA).
Ehsani MR, Upadhyaya SK, Slaughter D, Shafii S and Pelletier M 1999 A NIR
technique for rapid determination of soil mineral nitrogen. Precision agriculture 1,
217-234.
Ehsani MR, Upadhyaya SK, Fawcett WR, Protsailo LV and Slaughter DC 2001
Feasibility of detecting soil nitrate content using a mid-infrared technique.
Transactions of the ASAE 44, 1931-1940.
Jahn B R, Linker R, Upadhyaya SK, Shaviv A, Slaughter DC and Shmulevich I 2006
Mid infrared spectroscopic determination of soil nitrate content. Biosystems
Engineering 94, 505-515.
Johnston CT and Aochi YO 1996 Fourier transform infrared and Raman
spectroscopy. In Methods of Soil Analysis, Part 3. Soil Science. Eds. JM Bartels and
JM Bigham (ASA-CSSA-SSSA, Madison, Wisconsin, USA).
Libnau FO, Kvalheim OM, Christy AA and Toft J 1994 Spectra of water in the near-
and mid-infrared region. Vibrational Spectroscopy 7, 243-254.
Linker R, Kenny A, Shaviv A, Singher L and Shmulevich I 2004 FTIR/ATR nitrate
determination of soil pastes using PCR, PLS and cross-correlation. Applied
131
Linker R, Shmulevich I, Kenny A and Shaviv A 2005 Soil identification and
chemometrics for direct determination of nitrate in soils using FTIR-ATR
mid-infrared spectroscopy. Chemosphere 61, 652-658.
Linker R and Shaviv A 2006 Nitrate determination using anion exchange membrane
and mid-infrared spectroscopy. Applied Spectroscopy 60,
1008-1012.
Linker R, Weiner M, Shmulevich I and Shaviv A 2006 Nitrate determination in soil
pastes using FTIR-ATR mid-infrared spectroscopy: Improved accuracy via soil
identification. Biosystems Engineering 94, 111-118.
Qian P and Schoenau JJ 2002a Practical applications of ion exchange resins in
agricultural and environmental soil research. Canadian Journal of Soil Science
82, 9-21.
Qian P and Schoenau JJ 2002b Availability of nitrogen in solid manure
amendments with different C:N ratios. Canadian Journal of Soil Science 82,
219-225.
Qian P and Schoenau JJ 2005 Use of ion-exchange membrane to assess
nitrogen-supply power of soils. Journal of Plant Nutrition 28, 2193-2200.
Rahmelow K and Hübner W 1997 Infrared spectroscopy in aqueous solution:
Difficulties and accuracy of water subtraction. Applied Optics 51, 160-170.
Robert PC 2002 Precision agriculture: a challenge for crop nutrition management.
Plant and Soil 247, 143-149.
Roblin P and Barrow DA 2000 Microsystems technology for remote monitoring and
132
Shaviv A, Kenny A, Shmulevich I, Singher L, Reichlin Y and Katzir A 2003 IR
fiberoptic systems for in situ and real time monitoring of nitrate in water and
![Fig. 2. Typical ATR spectra of de-ionized water (bold), de-ionized water with 1000 mg[nitrate N]/kg[water] (thin) and sandy soil paste with 1000 mg[nitrate N]/kg[water] (dashed)](https://thumb-us.123doks.com/thumbv2/123dok_us/8134373.243113/4.595.78.503.112.425/typical-spectra-ionized-ionized-nitrate-sandy-nitrate-dashed.webp)