RETINAL IMAGE CLASSIFICATION AS NORMAL
AND ABNORMAL USING SUPPORT VECTOR
MACHINE
Kumudham R ECE Department, Vels University Pallavaram, Chennai, Tamil Nadu, India
ABSTRACT
Diabetic Macular Edema (DME) is a common retinal complication associated with diabetes. It is a major cause of permanent vision loss. Therefore early detection will be highly beneficial in controlling the progress of the disease. Since the ratio of people affected with the disease is very high when compared to the number of eye specialist, there is a need for automated diagnostic system for DME, so that only diseased persons can be referred to the specialist for further intervention and treatment. In order to assess DME, Detection of Hard Exudates is now considered as a standard method. In this paper the Hard Exudates are segmented using Fuzzy Clustering algorithm. Local Binary Pattern features are extracted from the segmented regions and are input to the Support Vector Machine (SVM) Classifer. The SVM classifier classifies the image as Normal and Abnormal.
Keywords— Diabetic Macular Edema, Vision Loss, Diabetic Retinopathy, Retinal Complication, Hard Exudate, Fuzzy Clustering, Support Vector Machine.
1. INTRODUCTION
Diabetic Macular Edema is caused by complications of diabetes, which can ultimately lead to permanent vision loss. It is an ocular manifestation which affects up to 80% of all patients who have diabetes for 10 years or more. Wisconsin Epidemiologic Study of diabetic retinopathy reported the 14-year incidence of DME in type I diabetics to be 26%. Despite these intimidating statistics, research indicates that at least 90% of these new cases could be minimised if there was proper and vigilant treatment and checking of the eyes. The longer a person has diabetes, the higher is the chance of developing Diabetic Macular Edema.
The screening of diabetic patients, who have the chance of developing diabetic macular edema, can potentially moderate the risk of blindness in these patients. Early screening enables laser therapy to be performed to prevent or delay visual loss and may be used to encourage improvement in diabetic control. Current methods of assessment of diabetic macular edema are expensive and require trained eye specialists. Hard Exudates are one of the primary signs of Diabetic Macular Edema. Automatic exudates detection would be helpful for Diabetic Macular Edema screening process.
Screening programmes are launched in many countries and colour fundus images are used by medical experts for manual assessment. Such manual assessment is not suitable in large scale scenario. In such a scenario automated system reduce the load of experts by limiting the referrals to those cases that require immediate attention. The ratio of normal patients to the ones showing disease symptoms is high in Diabetic Macular Edema screening. Several attempts have been reported towards building an automated solution for Diabetic Macular Edema detection. This has motivated us in developing a solution for automatic assessment of Diabetic Macular Edema from colour fundus images. Such a solution will add value to the existing infrastructure of Diabetic Macular Edema screening.
2. RELATED WORK
normal fundus images. A feature extraction technique is used to capture the global characteristics of the fundus images and discriminate the normal from DME images. Disease severity is detected using a rotational asymmetry measure by examining the symmetry of macular region. The detection performance has a sensitivity of 100% with specificity between 74% and 90%. Jebarani et al. [10] extracted Texture Features: Mean- average intensity, Standard deviation- average contrast, Relative Smoothness, Uniformity, Entropy- measure of randomness. Optic Disc was segmented using Fuzzy C-Means (FCM) clustering. They were unable to deal with the problems of varying image quality, such as contrast and brightness. Lili Xu and Shuqian Luo in [11] used a Support Vector Machine classifier to identify hard exudates from digital retinal images. Priya.R, et al. [12] used Fuzzy C Means Clustering (FCM) for segmenting the blood vessels. They have compared the classifiers Probabilistic Neural Network (PNN) and Support Vector Machine (SVM) for the diagnosis of Diabetic Retinopathy.
3. PROPOSED WORK
This section outlines the objective and methodology used for the assessment of Diabetic Macular Edema. The main objective is to:
Enhance the Hard Exudates regardless of their size. Classify the normal and abnormal images
Evaluate the performance of the Diabetic Macular Edema detection method.
Diabetic Macular Edema (DME) is generally detected directly or indirectly. Direct method is by using ophthalmoscopy for manual examination. Since quality assurance is difficult for manual assessment the indirect method is opted. Detecting the presence of hard exudates (HE) in different areas of retina is now considered as an indirect method to assess Diabetic Macular Edema (DME) from colour fundus images. In this paper an automated approach for the assessment of Hard Exudates is presented. The block diagram for the detection of hard exudates is shown in Fig. 1.
Fig.1 Block Diagram for Detection of Hard Exudates
Fuzzy Image Processing
Fuzzy Image Processing techniques serves as a tool for automated detection of DME, which assists the medical experts in diagnosis of the disease.
1) Need for Fuzzy Image Processing: In the medical field, the Doctors diagnose the patient by physical examination, the symptoms the patient describes, by referring to the case history of the patient, scan reports, laboratory results etc. He cannot completely rely on this information for treatment, because the information is not fully accurate. There exists varying degrees of uncertainty, imprecision, vagueness in the information obtained. This infers that, the state and symptoms known by the doctors is only with a limited degree of precision. This prompted attempts to use Fuzzy sets in Image Processing. These models help the medical experts in the diagnosis of specified categories of disease.
3.1 Acquisition of Retinal Images
Retinal Images are acquired from the MESSIDOR dataset. The MESSIDOR dataset comprises of macula centred colour fundus images (1200), acquired at multiple resolutions, of patients showing different symptoms of DR. All the abnormal images are obtained at Serviced’Ophtalmologie-Hopital Lariboisiere Paris. Some of these images are used.
3.2 Preprocessing Stage
In detecting abnormalities associated with fundus image, the images have to be pre-processed in order to correct the problems of uneven illumination problem. The image noise is reduced, and contrast enhancement is made in the preprocessing stage. The techniques involved are Median Filtering, Contrast Limited Adaptive Histogram Equalization.
Median filter
Median filter is a nonlinear digital filtering method, often used to remove noise. That noise reduction is a typical pre-processing step to improve the results of later processing (for example, edge detection on an image). It is very widely used in digital image processing because it preserves edges while removing noise, under certain conditions.
3.3 Contrast Enhancement
Images having low contrast can result from inadequate illumination, wrong lens aperture settings, or lack of dynamic
range in the imaging sensor. Contrast enhancement increases the dynamic range of an image. Contrast Limited Adaptive Histogram Equalization is used to improve contrast in the images.
3.4 Segmentation-Fuzzy Clustering
image into multiple regions. The aim of segmentation is to simplify the representation of an image into something that is more meaningful and easier to analyze. We have chosen Fuzzy clustering algorithm for the segmentation of Hard Exudates. In real applications there is very often no sharp boundary between clusters so that fuzzy clustering is often better suited for the data. Exudates region will be clearly detected and it will give best result for overlapped data set.
4.FEATURE EXTRACTION
The purpose of feature extraction is to reduce the original data set by measuring certain properties or features that distinguish one input pattern from another pattern. The next step in this paper is to extract a set of features for each region and classify the region as exudates and non exudates based on the generated feature vectors. Abdolhossein Fathi et al. [13] have used Local Binary Pattern (LBP) as texture descriptor to extract the features of Blood vessels and Adaptive neuro-fuzzy inference system for classification. Loris et al. [14] used Local Binary Pattern (LBP) as texture descriptor for representation of Biomedical Images. Their future work is to study the performance of the proposed texture descriptors when the feature extraction is performed from images that have been pre-processed using the different methods (e.g. Gabor filters).T. Ojala et al. [15] considered the joint occurrences of LBP and contrast in a 3x3 neighbourhood. LBP texture operator has become popular nowadays in various applications like face recognition, texture analysis, Pap smear test, etc. We have used LBP operator to extract the features from the fuzzy clustered segmented images, due to its computational simplicity, efficiency and robustness to illumination variations.
5.CLASSIFICATION FOR RETINAL IMAGE
The local binary pattern features are input to the classifier to classify the retinal images as Normal and Abnormal. We have chosen the Support Vector Machine (SVM) classifier for classifying the images. SVM described by Vapnik [19] is a robust technique for data classification. SVM is widely used in object detection & recognition, content-based image retrieval, text and speech recognition, biometrics, etc. SVM has better classification performance to a limited training set and it has good generalization ability. The classification task involves separating data into training and testing sets and to predict the labels of new input data. The performance of classification was evaluated by computing sensitivity, specificity and Accuracy. Sensitivity = TP/TP+FN, Specificity = TN/TN+FP, Accuracy = TP+TN/TP+FN+TN+FP.
6.RESULTS
In this paper the retinal image obtained is preprocessed using Median Filtering and Contrast Limited Adaptive Histogram Equalization Techniques. The Fuzzy Clustering algorithm used helps to automatically segment the exudates pixels.
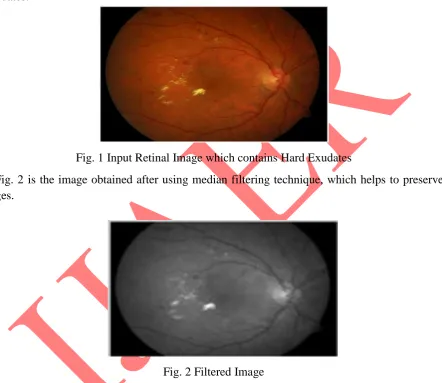
Fig. 1 is the input retinal image obtained from messidor dataset, which contains hard exudates.
Fig. 1 Input Retinal Image which contains Hard Exudates
Fig. 2 is the image obtained after using median filtering technique, which helps to preserve edges.
Fig. 2 Filtered Image
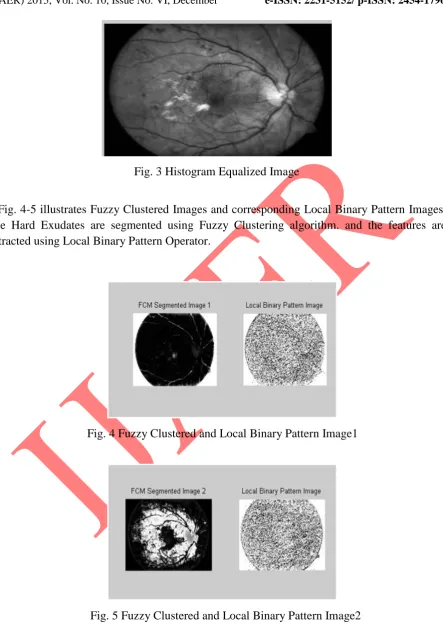
Fig. 3 Histogram Equalized Image
Fig. 4-5 illustrates Fuzzy Clustered Images and corresponding Local Binary Pattern Images. The Hard Exudates are segmented using Fuzzy Clustering algorithm. and the features are extracted using Local Binary Pattern Operator.
Fig. 4 Fuzzy Clustered and Local Binary Pattern Image1
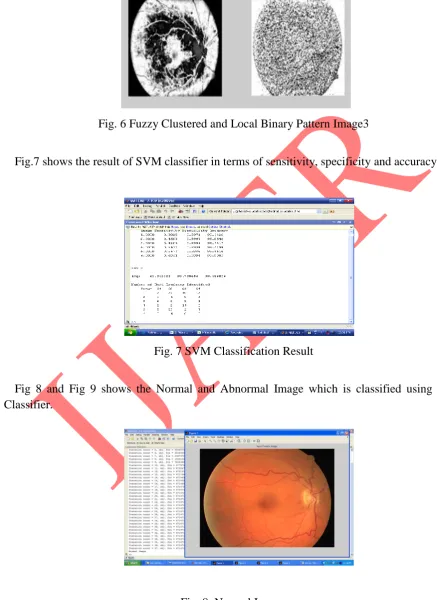
Fig. 6 Fuzzy Clustered and Local Binary Pattern Image3
Fig.7 shows the result of SVM classifier in terms of sensitivity, specificity and accuracy.
Fig. 7 SVM Classification Result
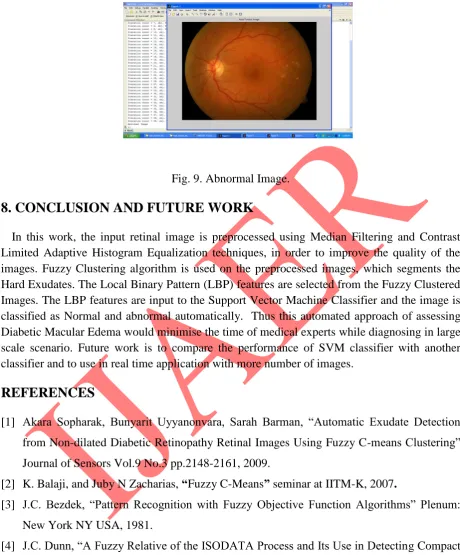
Fig 8 and Fig 9 shows the Normal and Abnormal Image which is classified using SVM Classifier.
Fig. 9. Abnormal Image.
8. CONCLUSION AND FUTURE WORK
In this work, the input retinal image is preprocessed using Median Filtering and Contrast Limited Adaptive Histogram Equalization techniques, in order to improve the quality of the images. Fuzzy Clustering algorithm is used on the preprocessed images, which segments the Hard Exudates. The Local Binary Pattern (LBP) features are selected from the Fuzzy Clustered Images. The LBP features are input to the Support Vector Machine Classifier and the image is classified as Normal and abnormal automatically. Thus this automated approach of assessing Diabetic Macular Edema would minimise the time of medical experts while diagnosing in large scale scenario. Future work is to compare the performance of SVM classifier with another classifier and to use in real time application with more number of images.
REFERENCES
[1] Akara Sopharak, Bunyarit Uyyanonvara, Sarah Barman, “Automatic Exudate Detection from Non-dilated Diabetic Retinopathy Retinal Images Using Fuzzy C-means Clustering” Journal of Sensors Vol.9 No.3 pp.2148-2161, 2009.
[2] K. Balaji, and Juby N Zacharias, “Fuzzy C-Means” seminar at IITM-K, 2007.
[3] J.C. Bezdek, “Pattern Recognition with Fuzzy Objective Function Algorithms” Plenum: New York NY USA, 1981.
[4] J.C. Dunn, “A Fuzzy Relative of the ISODATA Process and Its Use in Detecting Compact Well- Separated Clusters” J. Cyber 32-57, 1973.
[6] W. Hsu, P. Pallawala, M. L. Lee, and K.-G. A. Eong, “The role of domain knowledge in the detection of retinal hard exudates,” in Proc. 2001 IEEE Comput. Soc. Conf. Comput. Vis. Pattern Recognit. (CVPR2001), 2001, vol. 2, pp. II-246–II-251.
[7] S. Kavitha, K. Duraiswamy, “Automatic Detection of Hard and Soft Exudates in Fundus Images Using Color Histogram Thresholding”, European Journal of Scientific Research ISSN 1450-216X Vol.48 No.3, 2011.
[8] MESSIDOR Jun. 2011 [Online]. Available: http://messidor.crihan.fr/index-en.php.
[9] K. Sai Deepak, Jayanthi Sivaswamy, “Automatic Assessment of Macular Edema From Color Retinal Images” IEEE Transactions on Medical Imaging VOL. 31 NO. 3, 2012. [10]Ms. P.N. Jebarani Sargunar, Dr. R. Sukanesh, "Exudates Detection and Classification In
Diabetic Retinopathy Images By Texture Segmentation Methods“ International Journal of Recent Trends in Engineering, Vol 2, No. 4, November 2009.
[11]Lili Xu, Shuqian Luo,” Support Vector Macidne Based Method For Identifying Hard Exudates In Retinal Images”, IEEE, 2009.
[12]Priya.R , Aruna.P, “SVM and Neural Network based Diagnosis of Diabetic Retinopathy”, International Journal of Computer Applications (0975 – 8887) Volume 41– No.1, March 2012.
[13]Abdolhossein Fathi, Ahmad Reza Naghsh-Nilchi, "Integrating adaptive neuro-fuzzy inference system and local binary pattern operator for robust retinal blood vessels segmentation" Springer-Verlag London Limited 2012.
[14]Loris Nanni, Alessandra Lumini, Sheryl Brahnam, “Local binary patterns variants as texture descriptors for medical image analysis”, www.elsevier.com/locate/aiim.
[15]T. Ojala, M. Pietikäinen, and D. Harwood, "A Comparative Study of Texture Measures with Classification Based on Feature Distributions", Pattern Recognition, vol. 29, pp. 51-59, 1996.
[16]Shu Liao and Albert C. S. Chung, “Texture Classification By Using Advanced Local Binary Patterns And Spatial Distribution Of Dominant Patterns”, 1424407281/07/$20.00 ©2007 IEEE, ICASSP 2007.
[18]Ms. P.N. Jebarani Sargunar, Dr.R.Sukanesh, “Exudates Detection and Classification In Diabetic Retinopathy Images By Texture Segmentation Methods”, International Journal of Recent Trends in Engineering, Vol 2, No. 4, November 2009.