Open Access
Proceedings
Comparison of strategies for identification of regulatory
quantitative trait loci of transcript expression traits
Nora Franceschini*
1, Mary K Wojczynski
2, Harald HH Göring
3,
Juan Manuel Peralta
3, Thomas D Dyer
3, Xia Li
1, Hao Li
4and Kari E North
1Address: 1Department of Epidemiology, University of North Carolina Chapel Hill, Bank of America Center, 137 East Franklin Street, Suite 306, CB #8050, Chapel Hill, North Carolina 27514, USA, 2Department of Biostatistics, University of Alabama-Birmingham, 1665 University Boulevard, Ryals Public Health Building 414, Birmingham, Alabama 35294, USA, 3Southwest Foundation for Biomedical Research, PO Box 760459, San Antonio, Texas 78245-0549, USA and 4Glaxo-Smith-Kline, 17.2136A Sanders Building, 5 Moore Drive, Research Triangle Park, North Carolina 27709, USA
Email: Nora Franceschini* - [email protected]; Mary K Wojczynski - [email protected];
Harald HH Göring - [email protected]; Juan Manuel Peralta - [email protected]; Thomas D Dyer - [email protected]; Xia Li - [email protected]; Hao Li - [email protected]; Kari E North - [email protected]
* Corresponding author
Abstract
In order to identify regulatory genes, we determined the heritability of gene transcripts, performed linkage analysis to identify quantitative trait loci (QTLs), and evaluated the evidence for shared genetic effects among transcripts with co-localized QTLs in non-diseased participants from 14 CEPH (Centre d'Etude du Polymorphisme Humain) Utah families. Seventy-six percent of transcripts had a significant heritability and 54% of them had LOD score ≥ 1.8. Bivariate genetic analysis of 15 transcripts that had co-localized QTLs on 4q28.2-q31.1 identified significant genetic correlation among some transcripts although no improvement in the magnitude of LOD scores in this region was noted. Similar results were found in analysis of 12 transcripts, that had co-localized QTLs in the 13q34 region. Principal-component analyses did not improve the ability to identify chromosomal regions of co-localized gene expressions.
from Genetic Analysis Workshop 15
St. Pete Beach, Florida, USA. 11–15 November 2006
Published: 18 December 2007
BMC Proceedings 2007, 1(Suppl 1):S85
<supplement> <title> <p>Genetic Analysis Workshop 15: Gene Expression Analysis and Approaches to Detecting Multiple Functional Loci</p> </title> <editor>Heather J Cordell, Mariza de Andrade, Marie-Claude Babron, Christopher W Bartlett, Joseph Beyene, Heike Bickeböller, Robert Culverhouse, Adrienne Cupples, E Warwick Daw, Josée Dupuis, Catherine T Falk, Saurabh Ghosh, Katrina A Goddard, Ellen L Goode, Elizabeth R Hauser, Lisa J Martin, Maria Martinez, Kari E North, Nancy L Saccone, Silke Schmidt, William Tapper, Duncan Thomas, David Tritchler, Veronica J Vieland, Ellen M Wijsman, Marsha A Wilcox, John S Witte, Qiong Yang, Andreas Ziegler, Laura Almasy and Jean W MacCluer</editor> <note>Proceedings</note> <url>http://www.biomedcentral.com/content/pdf/1753-6561-1-S1-info.pdf</url> </supplement>
This article is available from: http://www.biomedcentral.com/1753-6561/1/S1/S85 © 2007 Franceschini et al; licensee BioMed Central Ltd.
Background
There is a breadth of information being generated by the Human Genome Project and the interpretation of these data has been a major area of research. For simple Mende-lian disorders, the identification of genetic effects is fairly straightforward due to understanding the biology that drives these disorders. However, for complex oligogenic or polygenic disorders, understanding all the interconnec-tions between genes influencing a trait is a difficult task because the understanding of the biology of many of these disorders is still evolving. Multiple gene × gene and gene × environment interactions can influence the expression of phenotypes. Genes can interact by modifying the expression of other genes and therefore function as regu-latory genes [1].
In an effort to dissect some of these complexities, we per-formed linkage analysis of gene expression transcripts of members of Centre d'Etude du Polymorphisme Humain (CEPH) Utah families to determine the heritability of transcripts and the evidence for regulatory quantitative trait loci (QTLs) and we performed pairwise bivariate link-age analysis and principal-component analysis (PCA) for data-reduction to evaluate the evidence for shared genetic effects. The ability to assess gene expression traits simulta-neously and to link them to QTLs offers the possibility of identifying previously unknown underlying molecular processes for future investigation.
Methods
Population and phenotypes
We used the Genetic Analysis Workshop 15 (GAW 15) Problem 1 microarray gene expression profiles for the analyses. Data were available for 14 three-generation CEPH Utah families. Expression levels of genes were obtained from lymphoblastoid cells using the Affymetrix Human Focus Arrays [2]. We were provided with data on 3554 transcripts that showed greater variation between individuals than within the same individual.
Family members were genotyped for 2882 autosomal and X-linked single-nucleotide polymorphisms (SNP) gener-ated by the SNP Consortium http://snp.cshl.org/. Genetic map positions were obtained using the SNP Mapping web application developed by the University College Dublin Conway Institute of Biomolecular and Biomedical Research http://actin.ucd.ie/software.html, which uses the Rutgers Combined Linkage-Physical Map of the Human Genome and data taken from the NCBI dbSNP Build 123 (in Kosambi centimorgans). This information was used to calculate multipoint identity by descent matrices (MIBDs) with Merlin and Minx [3], after removal of Mendelian inconsistencies and double recombinants with Preswalk (based on Simwalk mistyping probabili-ties) [4]. MIBDs were used for linkage analyses.
Transcript distributions were normalized using an inverse normalization transformation of z-scores of individual transcripts regressed on the mean individual transcript level. We further adjusted for the effects of age, age2, sex, age × sex and age2 × sex interaction using predictive linear regression models in SAS 9.1 (Cary, NC). We generated these residuals as part of our processing of the transcripts for linkage analyses.
Heritability estimation and linkage analysis
Heritability was estimated using maximum likelihood variance decomposition methods in SOLAR [5,6]. Genome scans were performed using multipoint variance-components models that test for linkage between traits and genetic variants by partitioning the variance of the expression level into its additive genetic and environmen-tal variance components [7]. For transcripts with co-local-ized QTLs, we performed bivariate linkage analysis to identify shared genetic effects. The bivariate polygenic model estimates correlations caused by residual additive genetic effects (ρG) and correlations caused by random environmental effects (ρE) [8]. To test for additive genetic correlation among pairs of traits, the log likelihood of a model in which ρG is constrained to 0 (null hypothesis, no correlation) or ρG = 1 (null hypothesis, complete shared genetic effect) is compared to that of a model in which ρG is estimated for the traits. Significant differences among the models (ρG ≠ 0) suggest that some of the same genes influence both traits. We also performed linkage analysis using the factors obtained from the PCA in a sample of transcripts with co-localized QTLs.
Principal-component analysis
amount of variance contributed by each factor. Only fac-tors with eigenvalues higher than 1 were considered for linkage analysis.
Integrating data from linkage analysis for gene co-expression
Linkage signals of individual transcript expressions were recorded and the location of QTLs was compared to the location of the transcript gene in order to identify trans -regulatory sites. In addition, the location and LOD scores of QTLs identified in single individual transcript analysis (univariate analysis) were compared with the location of the QTLs identified using bivariate analysis or factors of the PCA. This allowed a determination of whether the bivariate analysis or PCA data reduction analysis improved our evidence for linkage, and if so, a more in-depth examination of the transcripts included in the prin-cipal components needs to be examined for biologic inter-actions on complex disorders.
Results
Among 194 individuals from 14 families, 17 individuals with missing information on age were excluded. Seventy-six percent (n = 2688) of the transcripts had significant heritability (p < 0.05) and were considered for the linkage analysis. Of this, 1448 (54%) transcripts displayed sugges-tive evidence of linkage (had a maximum LOD score ≥ 1.8 [12]). The QTLs of 1661 transcripts (759 of which with LOD ≥ 1.8) were localized in a different region than the gene transcript (trans-regulatory sites). We used two differ-ent chromosomal regions with co-localized transcript QTLs, chromosomes 4q28.2-q31.1 and 13q34, for more in-depth analyses.
Chromosome 4q28.2-q31.1 region
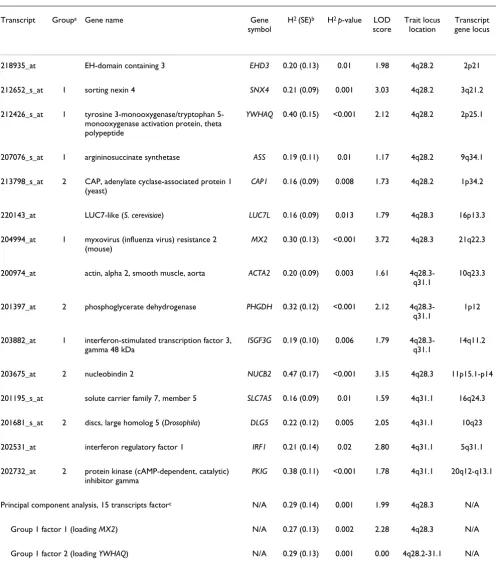
Table 1 reports the results for the chromosome 4q28.2-q31.1 region. Fifteen transcripts co-localized in this region in the univariate linkage analysis, and the LOD scores ranged from 1.17 to 3.72. The strongest linkage signals were observed for the transcripts of the MX2, NUCB2, and SNX4 genes. Using PCA, we obtained five factors from the 15 transcripts with eigenvalues greater than 1. Only one factor, with a high positive loading for the MX2 gene tran-script, had a significant heritability and a LOD score ≥ 1.8. The linkage analysis using this factor identified the chro-mosome region for the MX2 gene, but the LOD score was lower than the one obtained by single linkage analysis of the MX2 transcript.
We then performed bivariate analysis of all pairwise co-localized transcripts on 4q28.2-q31.1 and found evidence for genetic correlation of co-localized genes, although without much increase in the magnitude of the LOD score (Figure 1). This analysis identified two networks of gene expressions (Figure 1). We obtained two factors using
PCA of the first network (Group 1, SNX4, YWHAQ, ASS, MX2, and ISGF3G gene transcripts). Both factors had sig-nificant heritability; however, only Factor 1, loading heav-ily on the MX2 gene, localized to the 4q28.2-q31.1 region (Table 1), and the magnitude of the LOD score was lower than that of the univariate MX2 gene transcript analysis (LOD = 2.28). The heritability of one factor obtained using PCA for Group 2 transcripts was not significant and further analysis was not performed.
Chromosome 13q34 region
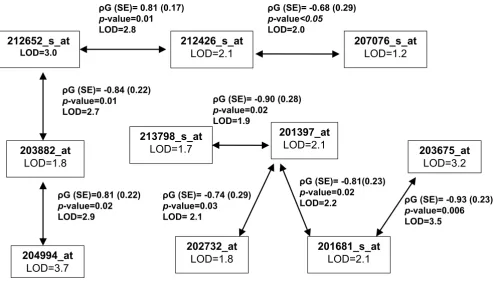
We performed analysis in an additional chromosome region of co-localized transcripts, 13q34 region, and noted similar results. Using univariate analysis, 12 tran-scripts co-localized in this region; and bivariate analysis revealed an intricate network of correlated traits (Table 2 and Figure 2). Using PCA, we obtained five factors, three of them with significant heritability. Similar to our previ-ous findings on chomosome 4, PCA factors did not improve the magnitude of the LOD scores when com-pared to univariate analysis.
Discussion
In this study, we identified co-localized QTLs of individ-ual transcripts and compared the univariate and bivariate linkage results using single transcripts to those using fac-tors obtained from PCA. By using facfac-tors that accounted for the variance of multiple transcripts with co-localized QTLs, we attempted to reduce the number of linkage anal-yses performed as well as possibly identifying previously unknown patterns of associated gene expression profiles. The PCA did in fact reduce the number of linkage analyses performed, but it did not improve the magnitude of sig-nals in the target QTLs as compared with univariate or bivariate analyses. In fact, in at least one case, PCA was unable to detect a linkage signal for the main gene tran-script loading in the factor (Table 1, Group 1, Factor 2).
Table 1: Univariate transcript heritability and linkage analysis compared to principal-component approach: chromosome 4q28.2-31.1 region
Transcript Groupa Gene name Gene
symbol
H2 (SE)b H2 p-value LOD
score
Trait locus location
Transcript gene locus
218935_at EH-domain containing 3 EHD3 0.20 (0.13) 0.01 1.98 4q28.2 2p21
212652_s_at 1 sorting nexin 4 SNX4 0.21 (0.09) 0.001 3.03 4q28.2 3q21.2
212426_s_at 1 tyrosine 3-monooxygenase/tryptophan 5-monooxygenase activation protein, theta polypeptide
YWHAQ 0.40 (0.15) <0.001 2.12 4q28.2 2p25.1
207076_s_at 1 argininosuccinate synthetase ASS 0.19 (0.11) 0.01 1.17 4q28.2 9q34.1
213798_s_at 2 CAP, adenylate cyclase-associated protein 1 (yeast)
CAP1 0.16 (0.09) 0.008 1.73 4q28.2 1p34.2
220143_at LUC7-like (S. cerevisiae) LUC7L 0.16 (0.09) 0.013 1.79 4q28.3 16p13.3
204994_at 1 myxovirus (influenza virus) resistance 2 (mouse)
MX2 0.30 (0.13) <0.001 3.72 4q28.3 21q22.3
200974_at actin, alpha 2, smooth muscle, aorta ACTA2 0.20 (0.09) 0.003 1.61 4q28.3-q31.1
10q23.3
201397_at 2 phosphoglycerate dehydrogenase PHGDH 0.32 (0.12) <0.001 2.12 4q28.3-q31.1
1p12
203882_at 1 interferon-stimulated transcription factor 3, gamma 48 kDa
ISGF3G 0.19 (0.10) 0.006 1.79
4q28.3-q31.1
14q11.2
203675_at 2 nucleobindin 2 NUCB2 0.47 (0.17) <0.001 3.15 4q28.3 11p15.1-p14
201195_s_at solute carrier family 7, member 5 SLC7A5 0.16 (0.09) 0.01 1.59 4q31.1 16q24.3
201681_s_at 2 discs, large homolog 5 (Drosophila) DLG5 0.22 (0.12) 0.005 2.05 4q31.1 10q23
202531_at interferon regulatory factor 1 IRF1 0.21 (0.14) 0.02 2.80 4q31.1 5q31.1
202732_at 2 protein kinase (cAMP-dependent, catalytic) inhibitor gamma
PKIG 0.38 (0.11) <0.001 1.78 4q31.1 20q12-q13.1
Principal component analysis, 15 transcripts factorc N/A 0.29 (0.14) 0.001 1.99 4q28.3 N/A
Group 1 factor 1 (loading MX2) N/A 0.27 (0.13) 0.002 2.28 4q28.3 N/A
Group 1 factor 2 (loading YWHAQ) N/A 0.29 (0.13) 0.001 0.00 4q28.2-31.1 N/A
aGroup 1 and 2 have transcripts correlated using bivariate analysis. Transcripts without correlation on bivariate analyses were not assigned a group. b H2, heritability; SE, standard error; N/A, not apply.
Chromosome 4 co-localized gene transcripts univariate and bivariate analyses results (n = 15 transcripts) Figure 1
Chromosome 4 co-localized gene transcripts univariate and bivariate analyses results (n = 15 transcripts). Each box has the transcript name (in bold) and the univariate transcript LOD score. Genetic correlation (ρG) between two tran-scripts and p-values are displayed in the outside box along with the bivariate LOD scores. We found two potential networks of regulatory genes among 15 co-expressed transcripts on the 4q28.2 to 4q31.1 region. Five transcripts did not have significant genetic correlation with any other transcript and are not included in this graph.
ȡG (SE)= -0.93 (0.23)
p-value=0.006 LOD=3.5
203882_at
LOD=1.8
204994_at
LOD=3.7
213798_s_at
LOD=1.7
201397_at
LOD=2.1
202732_at
LOD=1.8 201681_s_atLOD=2.1
203675_at
LOD=3.2
212652_s_at
LOD=3.0 212426_s_atLOD=2.1 207076_s_atLOD=1.2
ȡG (SE)=0.81 (0.22)
p-value=0.02 LOD=2.9
ȡG (SE)= -0.84 (0.22)
p-value=0.01 LOD=2.7
ȡG (SE)= 0.81 (0.17)
p-value=0.01 LOD=2.8
ȡG (SE)= -0.68 (0.29)
p-value<0.05
LOD=2.0
ȡG (SE)= -0.90 (0.28)
p-value=0.02 LOD=1.9
ȡG (SE)= -0.74 (0.29)
p-value=0.03 LOD= 2.1
ȡG (SE)= -0.81(0.23)
p-value=0.02 LOD=2.2
Table 2: Univariate transcript heritability and linkage analysis compared to principal-component approach: chromosome 13q34 region
Transcript Gene Name Gene Symbol
H2 (SE)a H2 p-value LOD
score
Trait locus location
Transcript gene locus
200805_at lectin, mannose-binding 2 LMAN2 0.25(0.10) 0.0003 1.3 13q33.2-q34 5q35.3 209375_at xeroderma pigmentosum, complementation
group C
XPC 0.23 (0.13) 0.007 1.8 13q33.2-q34 3p25
211564_s_at PDZ and LIM domain 4 PDLIM4 0.20 (0.13) 0.01 2.0 13q34 5q31.1 203366_at polymerase (DNA directed), gamma POLG 0.21 (0.11) 0.002 2.0 13q34 15q25 210502_s_at peptidylprolyl isomerase E (cyclophilin E) PPIE 0.40 (0.13) <0.001 1.8 13q34 1p32 217922_at Mannosidase, alpha, class 1A, member 2 MAN1A2 0.21 (0.10) 0.003 1.6 13q34 1p13 209715_at chromobox homolog 5 (HP1 alpha homolog,
Drosophila)
CBX5 0.28 (0.11) <0.001 2.4 13q34 12q13.13
203880_at COX17 homolog, cytochrome c oxidase assembly protein (yeast)
COX17 0.28 (0.11) 0.0004 1.3 13q34 3q13.33
201145_at HCLS1 associated protein X-1 HAX1 0.33 (0.14) 0.0004 2.0 13q34 1q21.3 201157_s_at N-myristoyltransferase 1 NMT1 0.31 (0.11) 0.0002 2.0 13q34 17q21.31 209219_at RD RNA binding protein RDBP 0.36 (0.11) <0.001 1.6 13q34 6p21.3 217932_at mitochondrial ribosomal protein S7 MRPS7 0.11 (0.08) 0.05 1.0 13q34 17q25 Principal component analysis, factor 2 (loading HAX1)b N/A 0.28 (0.13) 0.001 1.6 13q34 N/A
factor 3 (loading MRPS7) N/A 0.21 (0.10) 0.003 1.1 13q33.1-33.2 N/A factor 5 (loading NMT1) N/A 0.20 (0.12) 0.02 1.9 13q34 N/A
aH2, heritability; se, standard error; N/A, not apply.
The chromosome regions selected for detailed analyses were arbitrarily chosen as we identified multiple other regions with co-localized linkage of gene expressions. The results from our univariate genome scan differ markedly from those reported by Morley et al. [2] because we included a smaller sample of individuals so that adjust-ment for covariate effects of age could be made. Our anal-ysis strategy also adjusted for the effects of age and sex, which could also add to the observed differences [13]. Finally, our definition of genome window size for co-localized gene expressions was twice larger than the one described in the study of Morley et al.
Conclusion
We identified several chromosomal regions of co-local-ized trans-regulatory genes with significant heritability. Some of these regulatory genes displayed strong additive
genetic correlations, and may be part of genetic networks. However, when compared to univariate analysis, linkage analysis of bivariate phenotypes and factor scores obtained from PCA did not improve the ability to identify chromosomal regions of co-localized gene expressions.
List of Abbreviations
CEPH: Centre d'Etude du Polymorphisme Humain
GAW: Genetic Analysis Workshop
H2: heritability
LOD: logarithm of the odds
MIBD: multipoint identity-by-descent matrices Chromosome 13 co-localized gene transcriptsunivariate and bivariate analyses results (n = 12 transcripts)
Figure 2
Chromosome 13 co-localized gene transcriptsunivariate and bivariate analyses results (n = 12 transcripts). See legend to Figure 1 for explanation of symbols.
ȡG(SE)=-0.73 (0.33) p-value=0.04 LOD=2.0 209219_at
LOD=1.6
ȡG(SE)=0.74 (0.32) p-value=0.04 LOD=2.2 ȡG(SE)=0.74 (0.34)
p-value=0.04 LOD=1.8
ȡG(SE)=0.95 (0.16) p-value=0.0004 LOD=1.6 201157_s_at
LOD=1.3
203366_at LOD=2.0
203880_at LOD=1.3
200805_at LOD=1.3 210502_s_at
LOD=1.8
217922_at LOD=1.6
ȡG(SE)=0.77 (0.28) p-value=0.03 LOD=2.1
ȡG(SE)=-0.64 (0.22) p-value=0.03 LOD=1.4 ȡG(SE)= -0.79 (0.24)
p-value=0.007 LOD=1.7 ȡG(SE)=-0.80 (0.26) p-value=0.02 LOD=2.2
ȡG(SE)=-0.59 (0.27) p-value=0.05 LOD=1.7
209375_at LOD=1.8
ȡG(SE)=0.86 (0.16) p-value=0.001 LOD=1.5
201145_at LOD=2.0 ȡG(SE)=0.84 (0.28)
p-value=0.02
LOD=2.1 211564_at
LOD=2.0
Publish with BioMed Central and every scientist can read your work free of charge "BioMed Central will be the most significant development for disseminating the results of biomedical researc h in our lifetime."
Sir Paul Nurse, Cancer Research UK
Your research papers will be:
available free of charge to the entire biomedical community
peer reviewed and published immediately upon acceptance
cited in PubMed and archived on PubMed Central
yours — you keep the copyright
Submit your manuscript here:
http://www.biomedcentral.com/info/publishing_adv.asp
BioMedcentral N/A: not apply
NCBI: National Center for Biotechnology Information
PCA: principal-component analysis
QTL: quantitative trait loci
SE: standard error of the mean
SNP: single-nucleotide polymorphism
SOLAR: Sequential Oligogenic Linkage Analysis Routines
Competing interests
The author(s) declare that they have no competing inter-ests.
Acknowledgements
This article has been published as part of BMC Proceedings Volume 1 Sup-plement 1, 2007: Genetic Analysis Workshop 15: Gene Expression Analysis and Approaches to Detecting Multiple Functional Loci. The full contents of the supplement are available online at http://www.biomedcentral.com/ 1753-6561/1?issue=S1.
References
1. Hubner N, Yagil C, Yagil Y: Novel integrative approaches to the identification of candidate genes in hypertension. Hypertension
2006, 47:1-5.
2. Morley M, Molony CM, Weber TM, Devlin JL, Ewens KG, Spielman RS, Cheung VG: Genetic analysis of genome-wide variation in human gene expression. Nature 2004, 430:743-747.
3. Abecasis GR, Cherny SS, Cookson WO, Cardon LR: Merlin – rapid analysis of dense genetic maps using sparse gene flow trees.
Nat Genet 2002, 30:97-101.
4. Sobel E, Papp JC, Lange K: Detection and integration of genotyp-ing errors in statistical genetics. Am J Hum Genet 2002,
70:496-508.
5. Hopper JL, Mathews JD: Extensions to multivariate normal models for pedigree analysis. Ann Hum Genet 1982, 46:373-383. 6. Lange K, Boehnke M: Extensions to pedigree analysis. IV. Cov-ariance components models for multivariate traits. Am J Med Genet 1983, 14:513-524.
7. Almasy L, Blangero J: Multipoint quantitative-trait linkage anal-ysis in general pedigrees. Am J Hum Genet 1998, 62:1198-1211. 8. Almasy L, Dyer TD, Blangero J: Bivariate quantitative trait
link-age analysis: pleiotropy versus co-incident linklink-ages. Genet Epi-demiol 1997, 14:953-958.
9. Stevens J: Applied Multivariate Statistics for Social SciencesRahwah, NJ: Lawrence Erlbaum Associates; 1996.
10. Peterson LE: Partitioning large-sample microarray-based gene expression profiles using principal components analy-sis. Comput Med Prog Biomed 2003, 70:107-119.
11. Cureton EE, D'Agostino RB: Factor Analysis: An Applied Approach Hills-dale, NJ: Lawrence Erlbaum Associates; 1983.
12. Rao DC, Gu C: False positives and false negatives in genome scans. Adv Genet 2001, 42:487-498.