1085
THE DYNAMIC RELATIONSHIP BETWEEN STOCK VOLATILITY AND TRADING VOLUME
Muhammad Irfan Javaid Attari1 Saubana Rafiq2 Hayat Muhammad Awan3
ABSTRACT
The objective of the study is to measure the relationship between trading volume and returns; and
change in trading volume and returns of stocks in Pakistan.Various techniques such as Unit root tests and GARCH have been applied on the data to determine the relationship between aforesaid
variables. For this purpose, weekly data of Karachi Stock Exchange (KSE-100 index) has been collected and analyzed from January 2000 to March 2012.The GARCH results indicate a significant positive relationship between trading volume and returns; and change in trading volume
and returns.This relationship is of great importance to individuals from investment and policy making perspective as trading volume reflects information about market expectations, and its
relationship with price can have important implications for trading, speculation, forecasting and hedging activities.
Key Words: Stock Returns, Trading Volume, Karachi Stock Exchange, ARCH/GARCH.
1He holds M.Sc. Accounting & Finance and M.Phil. Finance degrees. He has been enrolled as a HEC -Funded-Ph.D. Scholar
in SZABIST, Islamabad, since 2010. He is currently Visiting Lecturer in Air University, Islamabad (Multan Campus). He
has produced several research articles and a book.Now a day, he is working on different issues of accounting, finance &
economics. E-mail: [email protected]
2
She is currently doing her MBA (Finance) from Air University, Islamabad (Multan Campus) and her primary area of
interest in research is financial econometrics. E-mail: [email protected]
3
He is currently offering his services as Director of Air University, Islamabad (Multan Campus) and Head of Department of
Business Administration as well. He had served in Bahauddin Zakariya University, Multan as the Director of IMS; Dean of
Commerce, Law and Management Sciences; and Vice Chancellor. He is author of more than 50 research articles in the
journal of international repute. E-mail: [email protected]
Asian Economic and Financial Review
1086
INTRODUCTION
The small and developing economies, like Pakistan, are facing the problem of high volatility and great uncertainty in various areas including financial sector. Volatility adversely effects the functioning of the financial system and hence economic performance. Higher returns encourage the investors to invest and increase the capital inflow, whereas in volatile environments the returns are not certain and hard to predict effecting investment eventually.Risk is the major factor that determines the return. Higher the risk, higher will be the return. The analysis of the current study revolves around the volume and price, also known as volume-return relationship. The objective of this study is to measure the relationship between trading volume and returns in the stock market of Pakistan. Most of the research in order to measure this relationship has been undergone at the international level, but relatively little work has been undertaken in our local market.
The empirical studies show that trading volume and stock returns are interrelated. Risk or volatility can be the result of company-related factors, like projects are not going up to projected expectations, potential growth with expected limits, competition from inside and outside of the country, and changes which are taking place in the management and within the financing patterns. This is unsystematic risk and can be eliminated.The other type of risk is said to be as market risk or systematic risk. It is affected by factors such as fiscal budget, agricultural production, foreign exchange reserves and market sentiments, through which stock prices is pushed up/down within different times. The rate of fluctuation depends upon relationship of stock with the whole market. Investors use this information to assess the efficiency of management team, to decide on buy/hold/sell strategy and to readjust their portfolio of assets (Bundoo, 2000).
This research paper focuses on relationship of Risk-Return-Volume in Karachi Stock Exchange (KSE). The causal as well as contemporaneous relationship has been investigated by using GARCH and Granger causality tests. The main purpose is to impart inside knowledge of the relationship between volume and returns and help the investors and other stakeholders in Pakistan in making investment decisions. This study will open new dimensions of research for future researchers as KSE is the biggest and best performing stock market of the country.
The rest of the article has the following sequence. Section 2 describes a literature review of theory and previous empirical research. Section 3 presents the data and measurement variables. Section 4 is about the results of the methodology, and Section 5 offers some concluding remarks.
LITERATURE REVIEW
1087
(1978); and Tauchen and Pitts (1983)had investigated the relationship between contemporaneous price change and trading volume.Epps and Epps(1976) had measured the relationship between the variance of price change and trading volume.Clark (1973); and Harris (1986) had estimated the relationship between squared price changes and trading volume.
Numerous studies have focused on the relationship between trading volume and returns.Karpoff (1987) had given four reasons for the importance of this relationship. First, there is the need to understand the financial market structure. Second, it has great significance for event studies. Third, it is an integral part of speculation. And fourth, it can provide insight into future markets.A study undergone by Jain and Joh (1988) had stated that there exists a significant relationship between returns and trading volume. The data comprised of common stock volume and returns of New York Stock Exchange (NYSE).
To test for causal relationship, Hiemstra and Jones (1994) had used Granger test to find linear and non-linear causal relationship and found bidirectional linear causality between volume and returns in NYSE. Muradoglu, Berument and Metin (1999) had examined how determinants of volatility and stock returns change with financial crisis in an emerging market such as that of Pakistan. They have found that during a financial crisis in an emerging market, risk-return relationship and the factors that determine this relationship change.
Chen, Firth and Rui (2001) had investigated this relationship in nine major stock markets, i.e. U.S., Japan, U.K., France, Canada, Italy, Switzerland, Netherlands and Hong Kong and their results showed significant positive association between trading volume and returns.Gunduz and Hatemi-J (2005) carried out a research to investigate the causality between returns and volume in the emerging markets of Czech Republic, Hungary, Poland, Russia and Turkey. There is no causal relationship between the variables in the Czech Republic. In Hungary and Poland, there is evidence of bidirectional causality between stock prices and volume. Returns cause volume in case of Russia and Turkey i.e. there is a unidirectional causal relationship.
A study conducted by Henry and McKenzie (2006)had supported the similar outcomes in Hong Kong but causality was non-linear. Further, Mala and Reddy (2007) studied stock market volatility in Fiji, a developing economy, and found that 7 out of 16 listed firms exhibited volatile traits. It was also found that interest rates have a major impact on stock's volatility.Floros and Vougas (2007) had studied the relationship between trading volume and returns in Greek Stock Index Futures Market and found significant positive contemporaneous relationship between the two in FTSE/ASE-20. However, the results for FTSE/ASE Mid 40 show no evidence of relationship between returns and volume.
1088
Singapore and Thailand. In four countries except Philippines, a unidirectional causality running from returns to volume was found and no results could be derived in Philippines.Pathirawasam (2008)had conducted a study using stock volume and returns from Colombo Stock Exchange and found that stock returns are positively related to changes in volume, but negatively to past trading volume. He attributed this negative cause to misspecification and illiquidity issues.
Khan and Rizwan (2008) had conducted the same study before using the data of KSE 100 index for the period 2001-2007 and deduced a positive contemporaneous relationship between the trading volume and returns. Furthermore, VAR was used to find a feedback relationship, which implies that there is a bidirectional causal relationship between volume and returns. Tripathy(2011) had investigated the dynamic causal relationship between stock return and trading volume of Indian stock Market and found bi-directional causality between the two. Also, the results of Johansen’s co integration test depicted long-run relationship between volume and returns.
Another study was conducted by Darwish (2012) who used GARCH model and found strong relationship between returns and volume in the Palestine stock exchange and deduced bidirectional causal relationship.Similarly,a research of 98 companies listed in Karachi Stock Exchange (KSE) of Pakistan by Rehman, Burhan, Shah and Mushtaq (2012) revealed a strong positive relation between returns and trading volume.In the case of emerging markets, numerous literatures can be found that had discussed this return-volume relationship and how volatility can be understood in this context.
RESEARCH METHODOLOGY AND DATA DESCRIPTION
The sample of data used in this current study comprises weekly stock price index and trading volume of the KSE 100 index. The daily data is converted into weekly basis by taking the average of the whole week stock price index and trading volume. The weekly data is used because of the small market size, thin trading and to avoid the day- of- the week effect (Darwish, 2012). The realization period has covered from January 2000 to April 2012 and has been collected from Bloomberg data base and business recorder data base. From the values of the closing index, the weekly rate of return (Rt) was calculated as:
𝑅𝑡 = 𝑙𝑛(𝑃𝑡/𝑃𝑡 −1) (1)
Where Pt is the closing index price on week (t).Thevolume (Vt) can take only positive values.Therefore,besidesthe volume,an estimatedchange inthe volume(ΔVt)is alsotaken intoaccount to cover both thepositive and negative values i.e. increases in volume as well as the decreases.The changes in trading value (ΔVt) were calculated as:
1089
Where Vt is the raw trading volume. The study examines whether rising price leads to higher volume or vice versa. This is what a contemporaneous relationship depicts. For this purpose, the below mentioned regression equation was tested:
𝑅𝑡=∝1+ 𝛽1𝑅𝑡−1+ 𝑏1𝑉𝑡+∈𝑡1 (3)
Then another equation that was tested:
𝑅𝑡=∝2+ 𝛽2𝑅𝑡−1+ 𝑏2∆𝑉𝑡+∈𝑡2 (4)
Where𝑅𝑡 stands for return, 𝑉𝑡 is trading volume and∆𝑉𝑡 is the change in trading volume at time
t.𝑅𝑡−1is included in the equations to account for serial correlation in returns series.
ARCH (q) Model
The data used is time series and is prone to high and low volatility periods. So the value of the disturbance term can be greater in certain periods as compared to others. The assumption of homoskedasticity is limiting in such cases and to model the behavior of conditional variance, ARCH model is used. The conditional variance is denoted by:
𝜎𝑡2= 𝑣𝑎𝑟 𝑒𝑡 𝑒𝑡−1𝑒𝑡−2…, . = 𝐸[(𝑒𝑡− 𝐸 𝑒𝑡 2) 𝑒𝑡−1𝑒𝑡−2… .] (5)
Since𝐸 𝑒𝑡 = 0, the above equation becomes:
𝜎𝑡2= 𝑣𝑎𝑟 𝑒𝑡 𝑒𝑡−1𝑒𝑡−2…, . = 𝐸[𝑒2 𝑒𝑡−1𝑒𝑡−2…,.] (6)
Ordinary Least Squares (OLS) has been used to estimate an ARCH(q) model. Engle (1982) suggested that the lag length or (q) of ARCH errors can be tested with the help of Lagrange multiplier test as follows:
1. Assess the best fitautoregressive modelAR(q).
𝑦𝑡= 𝑎0 + 𝑎1𝑦𝑡−1 + …. + 𝑎𝑞𝑦𝑡−𝑞 + ∈𝑡 = 𝑎0 + 𝑎𝑖 𝑞
𝑖=1 𝑦𝑡−𝑖 + ∈𝑡 (7)
2. Obtain the squares of the error and regress them on a constant and q lagged values:
∈𝑡2 = 𝛼 0 + ∝𝑖 𝑞
𝑖=1 ∈𝑡−𝑖2 (8)
1090
3. The t-statTR² has distribution with q degrees of freedom in a data of T residuals. If the
value of TR² is larger than the chi-square value, null hypothesis is rejected and ARCH effect exists. If TR² has smaller value than Chi-square, null hypothesis is accepted.
GARCH (p, q) Model
Generalized Autoregressive Conditional Hetroskedasticity (GARCH) model was used to investigate about the relationship between trading volume and returns. GARCH includes the lagged conditional variance terms as autoregressive terms, one of the drawbacks of ARCH model. TheGARCH (p, q) model (where p is the order of the GARCH terms and q is the order of the ARCH terms ( ) is given by
𝜎𝑡2 = ∝0 + ∝1∈𝑡−12 + … + ∝𝑞∈𝑡−𝑞2 + 𝛽1𝜎𝑡−12 + … + 𝛽𝑝𝜎𝑡−𝑝2 = ∝0 + ∝𝑖 𝑞
𝑖=1 ∈𝑡−𝑖2 + 𝛽𝑖
𝑝
𝑖=1 𝜎𝑡−𝑖2
(9) ANALYSIS
The descriptive statistics has been estimated in order to analyze the high returns and riskiness through mean and standard deviation respectively. The results are shown in Table 1:
Table-1.Descriptive Statistics of Return, Volume and Change in Volume of KSE-100
1091
highly significant results at 1% level and the acceptance of hypothesis that the series are not normally distributed.
Augmented Dickey Fuller (ADF) Unit Root test and Phillips Perron(PP) Unit Root testhas been used to check that the economic variables are stationary. The ADF test includes constant with no trend at level I(0) and first difference I(1) of variables. The lag differences (k) are chosen according to Schwarz Info Criterion (SIC). ADF unit root test is commonly applied to measure the existence of stationary, but it’s not very powerful tool for infinite samples, for this Phillips and Perron (1988) have introduced another alternative, Phillips-Peron (PP) unit root test. The PP test includes constant with no trend at level I(0)and first difference I(1) of variables. The bandwidth (t) is chosen according to Bartlett Kernel. The test results had shown in Table 2:
Table-2.ADF Unit Root Test and PP Unit Root Test Statistic
The test result shown in Table 2, indicates that the time series data at level I(0) is stationary at 1% level of significance at different lags. The deterministic trend means that the time series is now completely predictable and not variable. So, all the times series of the variables are stationary, this implies that all the shocks that would be temporary and their effects would be eliminated over time as the series regress to their long term variance.
1092 Table -3.Cointegrating Vectors Using OLS
The previous studies had suggested that the relationship between return and volume, return and change in volume is positive (Khan &Rizwan, 2008; Darwish, 2012). The results that are presented in above Table 3 show that the both coefficient of volume and change in volume are statistically significant and positive. It means that rising market go with the rising volume and vice versa. The results also support the theoretical evidence that the information content of volume has affected the future stock return.
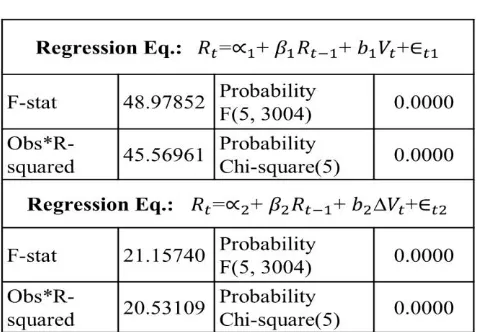
Before estimating the GARCH model in order to analyze the portfolio risk, there is a need to determine whether the series is characterized by the ARCH effect in the portfolio return. Engle (1982) had introduced the concept in which the variance depends on the size of the squared error term lagged one period. The results of ARCH test have shown in Table 4:
1093
The results of Table 4 shows that the LM stat and p-value of ARCH test reject null hypothesis i.e. there is homokedasticity. Therefore, the ARCH (1) effect is present and also effects in the portfolio return series.
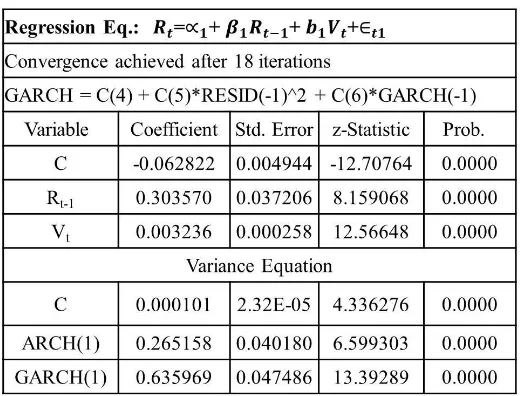
Moreover, the GARCH(1,1) model has been estimated in order to explain the conditional variance and volatility clustering. The results of GARCH test have shown in Table 5 and Table 6 by using eq. (3) and eq. (4):
Table -5.GARCH Model for KSE
1094
In Table 5 and Table 6, the coefficients of both the squared of residual (ARCH (1)) and of the conditional variance (GARCH (1)) are highly statistically significant at 1%, level. In the variance equation, the intercept coefficient is very small (but significant) and similarly the coefficient of the ARCH (1) is equal to 0.2 and 0.4 respectively. It has been expected, that in a typical GARCH model for financial data the coefficient of GARCH is statistically significant, as shown in Table 5 and Table 6, which depicts that the shocks to the conditional variance are consistent and that major changes in the conditional variance are followed by other great changes and small changes are followed by other minor changes. The coefficient of GARCH in the conditional variance equation of volume is greater than the change volume. Thisindicates thata minor marketshockleads torelativelylarge changesin futurevolatility. Moreoverthe coefficientsof volume andchanges in volume are positive and statisticallysignificant by using GARH (1, 1) model.
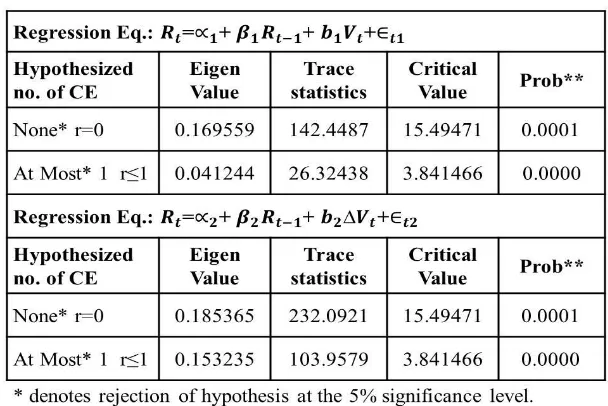
Economically speaking, long run equilibrium relationship exists among the variables, because they are integrated at same order. The cointegration relationship between variables is shown in Table 7:
Table-7.Cointegration Test Statistic
1095 Table-8.Granger Causality Results
The test results show that there is bidirectional causality between volume and return, i.e. the volume had two way effects on the return of Pakistan. But there is no causal relationship between change in volume and return.
CONCLUSION
This paper empirically examines the dynamic relationship between stock returns and volume in the context of Pakistan’s market. A sample of listed companies on Karachi Stock Exchange (KSE) was taken for the period from January 2000 to March 2012. It has found a significant positive relationship between returns and volume, indicating that rising market goes with rising volume and vice versa. This finding depicts that information content of volume affects future stock return.
It has also been the existence of bi-directional granger causality between volume and return, i.e. the volume had two way effects on the return of Pakistan. But there is no causal relationship between change in volume and return. The explanation of this finding with regard to literature is that volume which is affected by market information, leads to price changes. And higher capital gains that depict positive price changes, lead to increase in volume, encouraging buying or long transactions of traders.
1096
These results suggest that regulators like speculators and hedgers can use past information of stock price and trading volume to foresee future trends in stock price and use it for sale and purchase decisions. Future research might be conducted by including KSE 30 index and all-share index as additional variables.
REFERENCES
Bundoo, S. K. (2000)"The Mauritius stock exchange: sectorial analysis, risk and return" Department of Economics and Statistics, Faculty of Social Studies and Humanities, University of Mauritius, Reedit, Mauritius.
Chen, G., Firth, M. and Rui, O. M. (2001) "The dynamic relation between stock returns, trading volume and volatility" The Financial Review Vol.38, pp. 153-174.
Clark, W. (1973)"The economics of overexploitation "Science Vol. 181, pp. 630-634.
Crouch, R. L. (1970)"The volume of transactions and price changes on the New York stock exchange" Financial Analysts Journal Vol.26, pp. 104-109.
Darwish, M. J. (2012) "Testing the contemporaneous and causal relationship between trading volume and return in the Palestine exchange" Interdisciplinary Journal of Contemporary Research in Business Vol.3, pp. 55-64.
Engle, R. (1982) "Autoregressive Conditional Heteroskedasticity with Estimates of the Variance of United Kingdom Inflation "Econometrical Vol. 50, pp. 987-1007.
Epps, T. W., and Epps, M. L. (1976)"The stochastic dependence of security price changes and transaction volumes: implications for the mixture of distributions hypothesis"Econometrica Vol. 44, pp.305-321.
Floros, C. and Vougas, D. V. (2007)"Trading volume and returns relationship in Greek stock index futures market: GARCH vs. GMM "International Research Journal of Finance and Economics Vol. 12, pp. 98-115.
Granger, C. W. J., and Morgenstern, O. (1963) "Spectral analysis of New York Stock Market Prices" International Review for Social Sciences Vol. 16, pp. 1–27.
Gunduz, L., and Hatemi-J, A. (2005) "Stock Price and Volume Relation in Emerging Markets" Emerging Markets Finance and Trade Vol.41, pp. 29-44.
Harris, L. E. (1986)"Cross–security tests of the mixture of distributions hypothesis "Journal of Financial and Quantitative AnalysisVol. 21, pp. 39-46.
Henry, O. T. and McKenzie, M. (2006)"The impact of short selling on the price‐volume relationship: Evidence from Hong Kong" The Journal of Business Vol.79, pp. 671-691.
Hiemstra, C. and Jones, J.D. (1994) "Testing for linear and nonlinear granger causality in the stock price- volume relation" The Journal of Finance Vol.49,pp. 1639-1664.
Jain, P.C. and Joh, G.H. (1988) "The dependence between hourly prices and trading volume" The Journal of Financial and Quantitative AnalysisVol. 23, pp. 269-283.
1097 Khan, S. and Rizwan, F.(2008)"Trading volume and stock returns: evidence from Pakistan’s stock
market" International Review of Business Research Pipersville. 4, pp. 151-162.
Mala, R. and Reddy, M.(2007) "Measuring stock market volatility in an emerging economy" International Research Journal of Finance and Economics, Vol. 8, pp. 126-133.
Muradoglu, G., Berument, H., and Metin, K. (1999) "Financial crisis and changes in determinants of risk and return: an empirical investigation of an emerging market "Multinational Finance Journal Vol. 3, pp. 223–252.
Pathirawasam, C. (2011)"The relationship between trading volume and stock returns" Journal of CompetitivenessVol. 3, pp. 41-49.
Pisedtasalasai, A., and Gunasekarage, A. (2008)"Causal and dynamic relationships among stock returns, return volatility and trading volume: Evidence from emerging markets in South-East Asia"Asia-Pacific Finance MarketsVol. 14, pp. 277–297.
Rehman, A., Burhan, M., Shah, S. Z. A., and Rizwan, M. (2012) "The empirical relationship between risk-return and trading volume in Karachi stock exchange" Journal of Risk and Diversification Vol. 4, pp. 36-43.
Rogalski, R. J. (1978)"The dependence of prices and volume "Review of Economics and Statistics Vol. 60, pp. 268-274.
Tauchen, G. E., and Pitts, M. (1983)"The price variability-volume relationship on speculative markets" Econometrical: Econometric Society Vol. 51, No. 2, pp. 485-505.
Tripathy, N. (2011)"The relation between price changes and trading volume: a study in Indian stock exchange"Interdisciplinary Journal of Research in Business Vol. 51, No.2, pp. 485-505.