© 2018, IRJET | Impact Factor value: 6.171 | ISO 9001:2008 Certified Journal | Page 799
Sensor Node Placement Methods Based on Computational Geometry in
Wireless Sensor Networks: A Review
Sunita Saha
11Student, M.Tech, Dept. of Computer Science and Engineering, NERIST, Nirjuli
Arunachal Pradesh, India
---***---Abstract -Sensor node Placement scheme has the straight
and strong impact on performance and lifetime of a Wireless Sensor Network. To obtain a satisfied performance of Wireless Sensor Network, an adaptable sensor placement for various applications is essential. It is a challenging task to optimally deploy a limited number of sensors in an environment which is harsh. An efficient decision of locating the sensors in WSN can lead obtaining a required degree of 3D coverage and connectivity. The emerging computational geometric data structure, the Delaunay Triangulation, the Voronoi approach has a unique advantage for maximizing the coverage in a WSN. In most of the research, it has played a vital role in sensor deployment scheme with respect to the field of WSN. This article aims at investigation and analysis of the sensor node deployment methods those are based on Computational Geometric data structures.
Key Words: Wireless Sensor Network, Performance, Lifetime, Deployment, Computational Geometry, Delaunay Triangulation, Voronoi Approach.
1. INTRODUCTION
Sensors in a Wireless Sensor Network (WSN) should be located in a region to sense events and transmit the collected information to sink node for further operation.
A robust sensor deployment method [21] is essential to obtain a satisfied QoS of a Wireless Sensor Network for various applications. The degree of sensor coverage is a key performance metric of sensor deployment method. There are plenty of research is going on, for WSN node deployment scheme. Each work proposes a new method for sensor location based on different evaluation factor of a network. Deployment of sensors in a WSN with Computational geometric data structures has been extensively studied and analyzed in the last decade. In this paper, the existing deployment methods based on Delaunay Triangulation and Voronoi approach in a wireless sensor network are summarized and discussed.
The paper is organized as follows: In Section II, the computational geometry data structures Delaunay Triangulation and Voronoi diagram are described and its impact on WSN is summarized. Section III includes the performance and lifetime evaluation of a WSN. In Section IV, the related studies on deployment methods based on
Delaunay Triangulation and Voronoi approach are reviewed and the paper is concluded in Section V.
2. COMPUTATIONAL GEOMETRY
In the late 70s, Computational Geometry has emerged from the field of algorithm design and analysis. It studies various problems of computer graphics, geographic information system, robotics, wireless sensor networks recently and others in which geometric objects can play fundamental roles. Most of the geometric algorithms are designed to study the structural properties like convex hull, triangulation; both regular or Delaunay, Voronoi approach, and so on.
2.1 Delaunay Triangulation
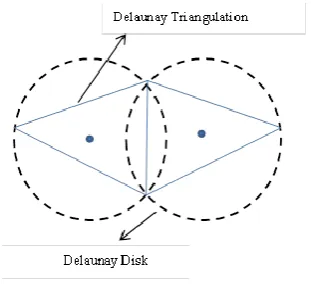
A Delaunay Triangulation is a data structure of Computational Geometry proposed by Boris Delaunay in 1934 [17]. A Delaunay Triangulation of set of points is defined as every triangle in the triangulation such that no point of the dataset is inside the circumcircle of the triangle. This is an optimized algorithm [22] as it maximizes the minimum angle of each triangle, making the triangles as equiangular as possible. So, it has a benefit to maximize the network coverage.
Fig -1: Delaunay Triangulation
2.2 Voronoi Diagram
[image:1.595.346.502.517.659.2]© 2018, IRJET | Impact Factor value: 6.171 | ISO 9001:2008 Certified Journal | Page 800
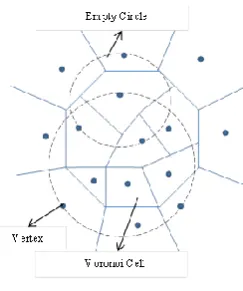
property [6] i.e. for each edge in Delaunay triangulation, a circle can be found that passes through the edge’s endpoints enclosing no other points of the dataset.
Fig -2: Voronoi Diagram
Computational Geometry plays a vital role in designing a WSN providing an estimated environment to work on. Also, it has a great advantage on performance evaluation of WSN in terms of coverage and connectivity of the network dealing with some of the geometric data structures. Delaunay Triangulation and Voronoi Diagram data structures [18, 20] are used to solve many applications as follows:
Collision Detection
Pattern Recognition
Geographical Optimization
Geometric Clustering
Closest pair Algorithms
K-nearest-neighbor queries and so on.
3. EVALUATION OF WSN
The evaluation of a WSN is basically on the basis of two major parameters of the network those are network performance and lifetime of the network.
The performance [29] of a WSN is the measurement of how well the network is sensed with an excellent quality of throughput. And the lifetime is how long the network is giving a quality of throughput.
Performance and lifetime of a WSN are related to each other. A good degree of network performance can maximize the lifespan of the network. Performance and lifetime of a network with QoS [16] ensure the quality of coverage and connectivity, quality of throughput, less energy consumption. There are various factors which may reduce the performance of a network and create a bad condition to make the network idle or completely damaged. The factors are as follows:
Sensor localization
Sensing quality
Routing Algorithms
Environment to be sensed.
Presence of obstacles on the field
Superposition with respect to sensor count
and so on.
4. SENSOR DEPLOYMENT IN WSN
Deployment of the sensors in a WSN is the process of setting up a new position of the sensors from where it is ready for doing productive work in a real environment. Localization of the sensors can hamper the network performance and lifetime as well [7 - 9]. It can be measured with the coverage and connectivity rate obtained after the placement of the sensor. The degree of coverage and connectivity can be improved placing the sensors in an appropriate position in a WSN [16].
There are various methods for placing a sensor in a WSN, but Delaunay Triangulation based method has become the center of attraction in most of the research providing a satisfied degree of QoC [27] in 3D WSN to discretize the surface. In [10, 23] it was shown that Delaunay based deployment is better compared to grid-based deployment considering various network parameters. The main concern of this paper is to study the various sensor deployment methods those are based on Computational Geometric data structures.
4.1 Coverage holes: Delaunay Triangulation-Score (DT Score)
DT-Score is a centralized deterministic sensor placement approach with a fixed number of sensors [5]. The aim of the algorithm is to maximize the area coverage in presence of obstacles. The algorithm consists of two phases of deployment. Largest empty circle property was used to get the best location for the sensors.
In the first phase, contour based deployment is used to eliminate the coverage holes near the boundary of the field and then the obstacles. In placing the sensors near the boundary of the field a distance of 2R/√2 (where R is sensing radius) between the sensors is maintained to ensure the full coverage along the boundary with the least number of sensors. And while placing the sensors along the obstacles a distance of R/√2 is maintained from the obstacles based on the slope and 2R/√2 distance between each pair of sensors.
[image:2.595.90.212.127.273.2]© 2018, IRJET | Impact Factor value: 6.171 | ISO 9001:2008 Certified Journal | Page 801
The complete algorithm for DT-Score placement method [5] is as follows:
Algorithm DT-Score ()
1. sensor_num=0;
2. /*initialization step*/
3. Initialize obstacle vector with coordinates of
obstacles;
4. Initialize sensor vector with coordinates of the
sensor points;
5. /*contour points generation step*/
6. Add sensors along the boundary of sensing area
and the edges of obstacles;
7. while (sensor_num<limit_num)
8. /*Candidate generation step*/
9. Construct Delaunay triangulation from the
sensor vector;
10. for (all circumscribed circles of the triangles)
11. Find a center p with the largest radius;
12. if (p is not located on any obstacles)
13. add p to candidate[];
14. if(candidate[]has k elements) break;
15. /* candidates scoring and sensor addition step*/
16. Score(candidate[]);
17. Add a candidate with the highest score to sensor
vector;
18. sensor_num++;
End of DT-Score
In [5], evaluation of the DT-score algorithm was done with a comparison to grid-based deployment algorithm and MAX_MIN_COV [31] algorithm and a random deployment method. And the result showed that the area coverage in DT-Score is better than that of the two methods in most of the cases. The DT-Score can achieve higher coverage as the number of deployable sensor increasing.
4.2 Coverage Measurement Method: Delaunay Triangulation
In this method, partitioning is done via triangulation of the sensor locations to identify the coverage level in different area fields. For a network with more than three sensors, Delaunay triangulation (DT) is an optimized with the following properties as shown in [12].
The outer polygon of the triangulation for set points
is convex.
Each sensor is connected by triangle edges to its
closest neighbor.
If no three sensors lie in a one shared straight line,
each sensor has a degree of two.
The circumcircle of each triangle contains no other
sensors.
In [12], DT is modified slightly in two phases to get the quality of coverage.
Phase1: Add extra sensors in the corners of the area
field, assuming convex.
Phase2: If three sensors are collinear i.e. cannot
form a triangle, move them by a random multiple of 0.5m to let the DT create the triangulation.
Largest empty circle property was used to determine the uncovered area [12] rather than the best position of the sensor in the network [5].
In [11, 30], Delaunay triangulation based method is used for node deployment to get the coverage of total target field. In [30], the analysis was done with respect to Watson’s Algorithm and found that DT based method gives an efficient result for an irregular area field to partition the field in a number of triangles and each triangle was covered by the sensors.
4.3 Coverage and Connectivity: Dual Delaunay Triangulation
In this method, the positions of the sensors are selected based on the maximum area coverage and existence of communication among them. The position selection process considers the vertices of the triangles generated from the Delaunay triangulation as the candidate position.
In this placement method, the field or the surface where to place the sensors is discretized with the Delaunay triangulation approach, splitting the geometric domain into a number of triangles.
In [25], the problem of minimum set coverage was solved using the dual Delaunay triangulation placement method for the node deployment. And the results were significant, with coverage area between 84% and 95% for distinct types of reliefs.
4.4 Fault Tolerant and Energy Saving: Constrained Delaunay Triangulation
A constrained Delaunay triangulation (CDT) is the generalized version of Delaunay triangulation that forces certain required segments into the triangulation. Delaunay triangulation is unique for a given set of points but CDT is most likely to contain some edges which are not Delaunay.
© 2018, IRJET | Impact Factor value: 6.171 | ISO 9001:2008 Certified Journal | Page 802
reducing the communication with the help of CDT and concluded that CDT approach performed better than Delaunay triangulation approach.
4.5 Complete Coverage: Improved Delaunay Triangulation (IDT)
In this method, original Delaunay Triangulation is improved excluding boundary effect issues on coverage. The boundary effect is caused by the fact that the coverage status in the bordering region is different from the center region. In [4], IDT was implemented and applied as follows:
IDT Algorithm run at sensor s ()
1. Collect 1-hop neighbor information
2. Construct the local Delaunay triangulation based on
the existing algorithm [5]
3. For each triangle 3 sensors at its vertices s, t, u do
4. Determine weighted centroid for each triangle
5. mx= {E(s)*sx+E(t)*tx+E(u)*ux}/{E(s)+E(t)+E(u)}
%E(s,t,u) are current residual energy of the sensors in the vertices s, u, t %
6. my= {E(s)*sy+E(t)*ty+E(u)*uy}/{E(s)+E(t)+E(u)}
7. s.R=max(s.R,||sm||) %assign sensing range %
8. end for
9. sensors at border increase the sensing range
10. if s has the highest priority among all the neighbors
&& NOT complete perimeter covered then
11. Adjust the sensing range to max Rs
12. Ask all useful neighbor nodes to adjust the sensing
range to max Rs
13. End if
In [4], IDT was compared to the original Delaunay triangulation (ODT) based deployment for the coverage and proved that IDT gives complete coverage in all the cases improving the network lifetime as well, where ODT fails.
4.6 Energy efficient Deployment: Voronoi Diagram
Energy consumption in a WSN can be minimized with a proper node deployment strategy while locating the nodes in the network. A considerable number of approaches use the Voronoi diagram in the network to deploy an optimal arrangement for the sensors. Since Voronoi diagram simple and stable geometric structure so it has a great impact on the implementation of the network design with its robustness [20].
4.6.1 Optimal Deployment: Centroidal Voronoi Partition
In this method, the surface or the field for the sensor deployment is partitioned with the Voronoi approach for sensor location. Surface parameterization is used to extend the centroidal Voronoi partition on a planar convex shape to 3D surfaces by projecting computed 2D results back to 3D based on the inverse of the surface mapping. There are multiple matured algorithms to compute the Voronoi partition of a set of discrete objects on a planar domain [17].
Centroidal Voronoi placement ()
1. Build the Voronoi partition of a set of sensors
deployed inside a convex shape on a plane.
2. Compute the centroid of each planar Voronoi region,
and move each sensor onto its respective centroid.
3. Repeat step 1 and 2 until the moving distance of
every sensor in step 2 is smaller than the threshold.
In [19], the optimal surface deployment problem was formulated by a general function to measure the sensing unreliability of the entire network on the field. And it was proven that the optimal sensor deployment problem can be solved under a generalized centroidal Voronoi partition.
4.7 Improvement of Node Interference: Geometric Algorithm
In this method, the node deployment problems are converted to geometry problems and then the problems are solved using Geometric Algorithms. The algorithm includes plane sweep method for detection of line intersection, Voronoi approach to search neighboring nodes and Delaunay triangulation to reduce the interference among the nodes. In [14], Geometric Algorithm based method was used to solve the interference problem in stepwise as follows:
Interference Reduction ()
1. Deploy the nodes and position them
2. Broadcast the locations of the nodes
3. Transform the deployment issues to geometric
problems
4. if (line of intersection==true) % Plane Sweep
Algorithm %
5. {Search for the neighboring nodes Voronoi ()}
6. else Triangulate the topology with Delaunay
Triangulation()
7. Path Modification
8. Transmission power adjustment
9. if(Insertion or Deletion of node ==1)
© 2018, IRJET | Impact Factor value: 6.171 | ISO 9001:2008 Certified Journal | Page 803
In [14], it was proved that this method is effective in reducing the interference problem in O (n log n) time with increasing throughput with respect to the delay and loss data rate.
5. CONCLUSION
Sensor deployment in a WSN is a key aspect and depends on various applications, the WSN is designed for. Sectoring the WSN with Computational Geometric data structures can produce a quality of network performance. There is various research is going on to improve the deployment strategy in a WSN with the computational geometric approach on 3-dimensional surfaces.
From the above studies on sensor placement method based on computational geometry, it is observed that most of the critical and real-world applications deal with the Delaunay and Voronoi data structures for designing the network topology with a promising result.
REFERENCES
[1] Anvesha Katti, D.K.Lobiyal, “Node Deployment Strategies
and Coverage Prediction in 3D Wireless Sensor Network with Scheduling”, Advances in Computational Science and Technology, ISSN: 0973-6107, Volume 10, November 2017, 2243-2255.
[2] A. P. Laturkar, P. Malathi, “Coverage Optimization
Techniques in WSN using PSO: A Survey”, International Journal of Computer Application, ISSN: 0975-8887, National Conference on Emerging Trends in Advanced Communication Technologies (NCETACT’15), Venue:
Vellore, Tamil Nadu, 8th and 9th September 2015.
[3] Chih-Yung Chang, Chao-Tsun Chang, Yu-Chieh Chen,
Hsu-Ruey Chang, “Obstacle Resident Deployment Algorithms for Wireless Sensor Network”, IEEE, Volume 58, No. 6, Page No. 2925-2941, 2009.
[4] Chinh T. Vu, Yingshu Li, “Delaunay-triangulation based
complete coverage in wireless sensor networks”, Pervasive Computing and Communication: IEEE International Conference on, ISBN: 978-1-4244-3304-9,
Page No. 1-5, Venue: Galveston, TX, USA, 9-13th March
2009.
[5] Chun-Hsien Wu, Kuo-Chuan Lee, Yeh-Ching Chung, “A
Delaunay Triangulation based method for wireless sensor network deployment”, ISSN: 0140-3664, Volume 30, Issues 14–15, 15 October 2007, Pages 2744-2752.
[6] F. Aurenhammer, “Voronoi Diagrams-A survey of
fundamental Geometric Data Structure”, ACM Computing Surveys, Volume 23, No. 3, pp. 345-405,1991.
[7] Gaojuan Fan, Ruchuan Wang, Haiping Huang, Lijuan Sun,
Chao Sha, “Coverage Guaranteed Sensor Node Deployment Strategies for Wireless Sensor Network”, IEEE, ISSN: 1424-8220, Volume 10, Page No. 2064-2087, 2010.
[8] Gayatri Devi, Rajeeb Sankar Bal, Sasmita Manjari Nayak,
“Node Deployment and Coverage in Wireless Sensor Network”, International Journal of Innovative Research in Advanced Engineering (IJIRAE), ISSN: 2349-2163, Issue 1, Volume 2, January 2015.
[9] Gayatri Devi, Rajeeb Sankar Bal, “Node Deployment
Coverage in Large Wireless Sensor Network”, Journal of Network Communications and Emerging Technologies (JNCET), Issue 2, Volume 6, February 2016.
[10] Guneet Kaur, Parikshit Singla, “Strategy Used to Solve
Coverage on Wireless Sensor Network”, International Journal of Emerging Research in Management & Technology, ISSN: 2278-9359, Volume 3, Issue 4, Page No. 187-193, April 2014.
[11] Hassan Chizari, Majid Hosseini, Shukar Abd Razak,
Abdul Hanan Abdullah, “Triangle Area Segmentation for Coverage Measurement in Wireless Sensor Network”, International Journal of Computer Communications and Network (IJCCN), Volume 1, Issue 1, December 2011.
[12] Hassan Chizari, Majid Hosseini, Timothy Poston, Shukar
Abd Razak, Abdul Hanan Abdullah, “Delaunay Triangulation as a New Coverage Measurement Method in Wireless Sensor Network”, Sensors Journal, ISSN: 1424-8220, Page no. 3163-3176, March 2011.
[13] Haitao Zhang, Cuiping Liu, “A Review on Node
Deployment of Wireless Sensor Network”, International Journal of Computer Science, ISSN (online): 1694-0814, Issue 6, No. 3, Volume 9, November 2012, 378-383.
[14] Hung-Chin Jang, “APPLICATION OF GEOMETRIC
ALGORITHMS TO REDUCE INTERFERENCE IN WIRELESS MESH NETWORK”, Journal on Applications of Graph Theory in Wireless Ad-hoc Network and Sensor Network (J GRAPH-HOC), Volume 2, No. 1, March 2010.
[15] In Dong Choi, Jin Seok Park, Kyeong Hyo Lee,
Byeong-Kyun Oh, “The three-dimensional node deployment in sensor network”, IEEE Computer Society, Advanced Software Engineering and its Application, ISSN: 76995-3432, 2008.
[16] Ji Li, L. H. Andrew, Chuan Heng Foh, Moshe Zukerman,
Hsiao-Hwa Chen, “Connectivity, Coverage, and Placement in Wireless Sensor Networks”, IEEE, ISSN: 1424-8220, Volume 9, pp. 7664-7693, 2009.
[17] Mark De Berg, Otfried Cheong, Marc van Kreveld, Mark
147-© 2018, IRJET | Impact Factor value: 6.171 | ISO 9001:2008 Certified Journal | Page 804
170 and Chapter 9, Page no. 191-215, Springer Berlin Heidelberg.
[18] Meysam Argany, Mir Abolfazl Mostafavi, Farid
Karimipour, “Voronoi-based Approaches for Geosensor Networks Coverage Determination and Optimization: A Survey”, Voronoi Diagrams in Science and Engineering (ISVD), 2010 International Symposium on, Venue:
Quebec, QC, Canada, IEEE, 28-30th June 2010.
[19] Miao Jin, Guodong Rong, Hongyi Wu, Liang Shuai, Xiaohu
Guo, “Optimal Surface Deployment Problem in Wireless Sensor Networks”, 2012 Proceedings IEEE INFOCOM, and ISSN: 4673-0775, Issue 1, Volume 8; Page No.
2345-2353, Venue: Orlando, FL, USA, 25-30th March 2012.
[20] Mitali R. Ingle, Narendra Bawane, “An Energy Efficient
Deployment of Nodes in Wireless Sensor Network using
Voronoi Diagram”, Proceeding of 3rd International
Conference on International Electronics Computer Technology (ICECT), Venue: Kanyakumari, India, Volume 6, IEEE,2011, Page No. 307-311.
[21] Numan Unaldi, Samil Temel, “Wireless Sensor
Deployment Method on 3D Environments to Maximize Quality of Coverage and Quality of Network Connectivity”, Proceedings of the World Congress Engineering and Computer science, Volume 2, WCECS 2014, ISSN: 2078-0966, 22-24 October 2014, Venue: San Francisco, USA.
[22] O. Devillers, “Improved incremental randomized
Delaunay triangulation”, ISBN: 0-89791-973-4, pp. 106-115, ACM Press, Venue: Minneapolis, Minnesota, USA, June 07 - 10, 1998
[23] Parveen Kumari, Yudhvir Singh, “Comparative Analysis
of Delaunay Triangulation and Square Grid Coverage Strategy for Wireless Sensor Network”, International Journal of Advance Research in Computer Science, ISSN: 0976-5697, Volume 2, No. 4, July-August 2011.
[24] Ramnesh Dubey, “Constrained Delaunay Triangulation
for Wireless Sensor Network”, ISSN: 2278-0661, ISBN: 2278-8727, Volume 8, Issue 4, Page No. 46-53, Jan-Feb 2013.
[25] Renan Nespolo, Leandro Alves Neves, Guilherme
Roberto, Matheus Ribeiro, “Method Based on Triangulation for Sensor Deployment on 3D Surfaces”,
IEEE, 29th SIBGRAPI Conference on Graphics, Patterns
and Images, ISBN: 9781509035694, Venue: Sao Paulo,
Brazil, Volume 1, Pages 464, 4-7th October 2016.
[26] Samil Temel, Numan Unaldi, Okyay Kaynak, “On
Deployment of Wireless Sensors on 3D Terrains to Maximize Sensing Coverage by Utilizing Cat Swarm Optimization with Wavelet Transform”, IEEE, ISSN: 2168-2216, Volume 44, No. 1, Page No. 111-120, January 2014.
[27] SANGEETHA S, RAMA LAKSHMI K, “A Survey on
Coverage Problems in Wireless Sensor Networks”, International Journal of Advanced Research in Computer Engineering and Technology (IJARCET), ISSN: 2278-1323, Volume 1, Issue 10, December 2012.
[28] Sema Oktug, Anar Khailov, Hakan Tezcan, “3D Coverage
Analysis under Heterogeneous Deployment Strategies in Wireless Sensor Networks”, the Fourth Advanced International Conference on Telecommunications, IEEE, ISBN: 978-0-7695-3162-5, Page No. 199-204, Venue:
Athens, Greece, 8-13th June 2008.
[29] Shruti Prabha Shakhawat, O.P. Sharma, “Node
Deployment Models and Performance Parameters for Wireless Sensor Network: A Perspective”, International Journal of Computer Application, ISSN: 0975-887, Volume 88, No. 9, February 2014.
[30] S. Surekha, M. KalyanRam, “Coverage of total Target
Field to Form WSN using Delaunay Triangulation”, International Journal of Computer Science and Information Technologies (IJCSNT), ISSN: 0975-9646, Volume 4, Issue 6, Page no. 796-799, 2013.
[31] S. S. Dhillon, K. Chakraborty, “Sensor placement for
effective coverage and surveillance in distributed sensor
networks”, Proceedings of IEEE Wireless
Communications and Networking Conference, ISSN: 1525-3511, Volume 3, Page No. 1609-1614, Venue: New
Orleans LA USA, USA, 16-20th March 2003.
[32] Titiksha Bhagat, Prof. Sonal Honale, “A Review on
Network Connectivity and Coverage Issues in WSN”, International Journal on Recent and Innovation Trends in Computing and Communication, ISSN: 2321-8169, Issue 4, Volume 4; Page No. 996-1000, April 2016.
[33] Vikrant Sharma, R. B. Patel, H. S. Bhadauria, D. Prasad,
“Deployment schemes in wireless sensor network to achieve blanket coverage in large-scale open area: A Review”, ISSN: 1110-8665, Volume 17, Page No. 45-56, September 2015.
[34] Wenyong Gong, Yong-Jin Liu, Kai Tang, Tieru Wu,”