Please cite this article as: N. Mehranfar, M. Hajiaghaei-Keshteli, A. M. Fathollahi-Fard, A Novel Hybrid Whale Optimization Algorithm to Solve a Production-Distribution Network Problem Considering Carbon Emissions, International Journal of Engineering (IJE), IJE TRANSACTIONS C: Aspects Vol. 32, No. 12, (December 2019) 1781-1789
International Journal of Engineering
J o u r n a l H o m e p a g e : w w w . i j e . i rA Novel Hybrid Whale Optimization Algorithm to Solve a Production-Distribution
Network Problem Considering Carbon Emissions
N. Mehranfara, M. Hajiaghaei-Keshtelib, A. M. Fathollahi-Fard*c
a Department of Industrial Engineering, Shomal University, Amol, Iran
b Department of Industrial Engineering, University of Science and Technology of Mazandaran, Behshahr, Iran c Department of Industrial Engineering and Management Systems, Amirkabir University of Technology, Tehran, Iran
P A P E R I N F O
Paper history: Received 29 March 2019
Received in revised form 11 November 2019 Accepted 26 January 2020
Keywords:
Production-Distribution Networks Optimization
Carbon Emissions Nature-inspired Algorithm Whale Optimization Algorithm Simulated Annealing
A B S T R A C T
Nowadays, there is a great deal of attention for regulations of carbon emissions to enforce the decision-makers of production and distribution networks to redesign their systems satisfactorily. The literature has seen a rapid interest in developing novel metaheuristics to solve this problem as a complicated optimization problem. Such difficulties motivate us to address a production-distribution network design problem considering carbon emissions policies among the first studies in this area by a novel hybrid whale optimization algorithm. Accordingly, a mixed integer non-linear programming model has been developed. To tackle the proposed problem, a new hybrid metaheuristic based on whale optimization algorithm and simulated annealing as a successful optimizer is employed to solve the proposed problem. The calibration of the algorithms has been designed by Taguchi method, comprehensively. Finally, an extensive analysis has been evaluated through a comparative study along with some assessment metrics of Pareto solutions.
doi: 10.5829/ije.2019.32.12c.11
1. INTRODUCTION1
The production-distribution systems have been investigated and analyzed in the recent years due to a rapid growth in sustainability attentions [1]. The sustainability should be considered in all of organizations due to recent governments’ policies in the developed countries [2]. Generally, the sustainability dimensions should be adjusted based on economic, environmental and social aspects for a production-distribution supply chain system [3]. Similarly, recent years have seen a rapid interest in environmentalism to consider the carbon emissions to design the supply chain network [4-6]. In most of case studies, optimization of a supply chain is based on economic factors (profit maximization or cost minimization), with less or no regards to the negative impacts on the environment [7-9]. By another point of view, recent protocols committed by international organizations and governments are mainly decided to
*Corresponding Author Email: [email protected] (A. M. Fathollahi-Fard)
control and to reduce the carbon emission levels, more efficiently till 2020 [7]. Therefore, mitigating and reducing carbon emissions are one of main concerns in developing the sustainable supply chain network design [10]. This reason has been motivated to redesign of supply chain networks to incorporate goals from all dimensions of sustainability based on the triple line, i.e., economic, environmental and social aspects [1-3].
eliminated and reduced from a robust production-distribution supply chain system [12-15].
It is generally believed that assigning effective and efficient operations among design and management of supply chain networks, especially with carbon policies is a great challenge [17-20]. Therefore, reduction of emissions at each stage of the supply chain will induce an overall reduction in emissions [21]. A sustainable supply chain emphasizes on being environmentally balanced while being economically viable [22, 23]. This includes strict carbon capping indicating some firms which should be regulated the main emissions of a sustainable production-distribution supply chain [24, 25]. The main limitations are regularly to set the carbon taxation [26], carbon capping and trading [27], and buying carbon credits from another firm [28]. All in all, this study employs all these three carbon policies to consolidate in a sustainable production-distribution and inventory control decisions model. There are many works concerning the sustainable supply chain network design in the last decades. As explored by Sahebjamnia et al. [28], only seven papers in high rank related journals have been published for the period of 2015 to 2017 to address the sustainable supply chain network design problem. As mentioned earlier, economic, environmental and social aspects are three main sustainability dimensions [25, 29]. One of suppositions of environmental aspects is considering the carbon policies. In regards to the both single period and single stag, the study conducted by Zhang and Xu [10] revealed that more efforts on considering carbon emissions to evaluate multi-item supply chain networks are needed to be investigated. Xiaoping et al. [30] studied the same problem to indicate that one of main issues of Pareto improvements in supply chain networks is to consider the green technology. Recently, Hajighaei-Keshteli and Fathollahi-Fard [25] emphasized that more attemps on the environmental sustainabiliy aspects such as carbon emissions policies are needed to be evluatd. This reason motivate our attempts to contribute a new production-distribution system considering carbon emissions policies.
The rest of the paper is organized as follows. Section 2, addresses the proposed problem along with main assumptions and formulation. Section 3, the introduced hybrid algorithm along with its encoding scheme are explained. Computational results are investigated in section 4. Finally, discussion and suggestions for the future works are investigated in section 5.
2. PROBLEM DESCRIPTION AND MODLING
This work aims to develop a new sustainable supply chain network with three echelons as a type of location and allocation problems by considering the carbon emissions policies. Generally, the model provides these
important factors to design a sustainable supply chain network including the manufacturing cost, the holding cost, the transportation cost, the ordering cost, the regular and overtime of manufacturing process and the environmental emissions regarding the transportation, manufacturing and holding cost of system. As mentioned earlier, there are three carbon emissions policies in this study including strict carbon capping, carbon taxation and considering the cap-and-trade of carbon. In this regard, a Mixed Integer Non-Linear Programming (MINLP) model has been developed with two conflicting objective functions including the minimization the total cost of system and carbon emissions considerations. Overall, there are three echelons in our study including suppliers (A), manufacturers (B) and distributers (C). A planning horizon with multiple time and a set of routings (I) have been considered. In regards to illustrated problem, following assumptions are set for the model proposed:
• There is no flow between the same facilities in each echelon.
• All demand must be satisfied.
• The lead-time of manufacturer B to the item I is a fixed parameter.
• The standard normal distribution value is fixed for all members of supply chain network.
• There is no capacity limitation for the order quantity.
• The setup times of products are considered by the times of assembly and obtained shortage item to assemble the eventual products.
• Similar to other production systems, there is only one upstream node for a set of initial input products for each facility B. In this regard, it is possible that there are several upstream nodes for each facility B. There are a group of external suppliers or some other plants for manufacturing. In this case, an external supplier can supply facility B with several products.
Overall, the used sets, parameters and decision variables are presented as follows:
Sets:
A Suppliers
B Manufacturers
C Distributers
I Items to be supplied to manufacturers P Products delivered to distributers
D Demand
t Time of periods
Parameters: LTBI Lead time
rBI Reorder point
Z1-α Service level of proposed supply chain
𝜕𝐿𝑇 Demand variance during the lead time HCBI Holding cost of item I at manufacturer B
QBI Order quantity for the item I at manufacturer B
FB Opening cost of manufacturer B
µCP Mean demand of products
𝜕𝐶𝑃 Variance demand of products
HCCP Holding cost at distributer C for product P
CBpt Regular time production cost per unit CCPBt Cost of per unit over-time production
TCBAI Cost of transforming each unit item I from supplier A to manufacturer B
TCCBP Cost of transforming each unit product P from manufacturer B to distributer C
EMFB Fixed emissions from manufacturer B EMVB Variable emissions from manufacturer B
EOFPB Fixed environmental emissions due to transportation of product P from manufacturer B
EOVPB Variable environmental emissions due to
transportation of product P from manufacturer B
EOFIA Fixed environmental emissions due to transportation of item I from supplier A
EOVIA Variable environmental emissions due to transportation of item I from supplier A
EIPC Environmental emissions due to inventory at distributer C
EIPBt Environmental emissions due to inventory at manufacturer B
Τ Carbon Tax
F Fine at exceeding carbon cap Ψ Trading cost of carbon credits CCap Carbon cap
M A big scalar
Decision variables:
XB It gets 1, if the manufacturer B is open; otherwise 0.
YCBP
It gets 1, if the materials P transported to distributer C from manufacturer B; otherwise 0.
ZBAI
It gets 1, if supplier A serves item I to manufacturer B; otherwise 0.
QRCPBt Regular time of production quantity QOCPBt Over-time of production quantity
Here, the proposed formulation has been presented. The model has been inspired by the main previous works in this area i.e. [29-31]. For a distributer, the inventory would be stocked by supplying the demand of customers based on 1-α probability during the lead time LTBI. Therefore, following function may be used to estimate this probability.
Pr(𝐷(𝐿𝑇𝐵𝐼) ≤ 𝑟𝐵𝐼) = 1 − 𝛼 (1)
where D(LTBI) during the lead time is item demand D. So, as may be seen in the following equation, a normal distribution function is utilized to estimate the reordering point:
𝑟𝐵𝐼= 𝐸(𝐷𝐵𝐼) × 𝐸(𝐿𝑇𝐵𝐼) + 𝑍1−𝛼×
√(𝐸𝐷𝐵𝐼)2× 𝜕𝐿𝑇2+ 𝐸(𝐿𝑇𝐵𝐼× 𝑉𝐵𝐼)
(2)
Similar to other production systems, the variance may be neglected due to the lead time is fixed. As a result, the reordering point can be reconsidered as follows:
𝑟𝐵𝐼= 𝐷𝐵𝐼× 𝐿𝑇𝐵𝐼+ 𝑍1−𝛼× √𝐿𝑇𝐵𝐼× 𝑉𝐵𝐼 (3)
where the value of standard normal distribution value is calculated by Z1-α. As suggested in Equation (3), the computation of holding cost has been illustrated. From the calculation presented by Equation (4), the first term computes the holding cost average of ordering quantity. As such, the safety stock cost is calculated in the second term.
(𝐻𝐶𝐵𝐼× 𝑄𝐵𝐼)/2 + 𝐻𝐶𝐵𝐼× 𝑍1−𝛼× √𝐿𝑇𝐵𝐼× √𝑉𝐵𝐼 (4)
Taken together, all cost of holding and order system can be estimated as seen in Equation (5).
∑ ∑ 𝐻𝐶𝐵 𝐼 𝐵𝐼× 𝑍1−𝛼× √𝐿𝑇𝐵𝐼× √𝑉𝐵𝐼+(𝐻𝐶𝐵𝐼×
𝑄𝐵𝐼)/2 +𝑂𝐶𝐵𝐼𝑄𝐵𝐼×𝐷𝐵𝐼
(5)
As mentioned earlier, there is no capacity constraints in our proposed formulation. Hence, there is a set of differences between Equation (5) in terms Q and equating it to zero. To do this end, the following formula is calculated:
𝐻𝐵𝐼
2 +
𝑂𝐶𝐵𝐼×𝐷𝐵𝐼 𝑄𝐵𝐼2 = 0
(6)
Based on the Equation (6), the amount of 𝑄𝐵𝐼is equal to:
𝑄𝐵𝐼= √2×𝑂𝐶𝐵𝐼×𝐷𝐵𝐼𝐻𝐶𝐵𝐼 (7)
After the calculation of Equations (7) and (5), the total cost of production and distribution system can be given in the first objective function as seen in Equation (8). In this equation, the first term considers the opening cost which is required to open the manufactures. The second term considers the ordering and holding cost of manufacturers. As such, the third term computes the buffer stock holding cost. The knowledge of manufacturing cost for manufacturers is imparted by the fourth term. At the end, the two last terms give the transportation costs between the suppliers and manufacturers as well as the manufacturers and distributers.
min 𝑍1= ∑ 𝐹𝐵 𝐵× 𝑋𝐵+ ∑ ∑ √2 × 𝐻𝐶𝐵 𝐼 𝐵𝐼× 𝑂𝐶𝐵𝐼+
∑ ∑ 𝐻𝐶𝐵 𝐼 𝐵𝐼× 𝑍1−𝛼× √𝐿𝑇𝐵𝐼× √𝑉𝐵𝐼+∑ ∑ 𝜇𝐶 𝑃 𝐶𝑃×
𝐻𝐶𝐶𝑃+ ∑ ∑ ∑ ∑ [𝑄𝑅𝐶 𝐵 𝑃 𝑡 𝐶𝐵𝑃𝑡× 𝐶𝐵𝑃𝑡+ 𝑄𝑂𝐶𝐵𝑃𝑡×
𝐶𝐶𝐵𝑃𝑡] + ∑ ∑ ∑ 𝑇𝐶𝐵 𝐴 𝐼 𝐵𝐴𝐼× 𝐷𝐵𝐼× 𝑍𝐵𝐴𝐼+
∑ ∑ ∑ 𝑇𝐶𝐶 𝐵 𝑃 𝐶𝐵𝑃× 𝜇𝐶𝑃× 𝑌𝐶𝐵𝑃
(8)
distributers. The fourth term of second objective function provides the carbon emissions by the inventory.
min 𝑍2= ∑ [𝐸𝑀𝐹𝐵 𝐵× 𝑋𝐵+ 𝐸𝑀𝑉𝐵(𝑄𝑅𝐶𝑃𝐵𝑡+
𝑄𝑂𝐶𝑃𝐵𝑡)] + ∑ ∑ ∑ (𝑌𝐶 𝑃 𝐵 𝐶𝐵𝑃× 𝐸𝑂𝐹𝐵𝐼+ 𝐸𝑂𝑉𝑃𝐵×
𝜇𝐶𝐵) + ∑ ∑ ∑ [𝐸𝑂𝐹𝐴 𝐵 𝐼 𝐼𝐴× 𝑍𝐵𝐴𝐼+ 𝐸𝑂𝑉𝐼𝐴×
𝐷𝐵𝐼] + ∑ ∑ ∑ (𝐸𝐼𝐶 𝐵 𝑃 𝐶𝑃× 𝜇𝐶𝑃+ ∑ 𝐸𝐼𝑡 𝑃𝐵𝑡×
𝑍1−𝛼× ∑ √𝐿𝑇𝐼 𝐵𝐼× √𝑉𝐵𝐼)
(9)
Regarding the carbon taxation, certain tax may be considered as the total emissions computed by Equation (9). There is a supposition for each environmental emissions unit; we assumed the tax to be τ. Accordingly, Equation (10) presents the total cost of supply chain system with the supposition of carbon tax:
𝑍1+ τ 𝑍2 (10)
As such, there is a limitation for the carbon emissions amount to be under strict carbon policy, there is a constraint on the amount of carbon emitted across the supply chain network under the presented carbon policy. Here, this supposition is existed to impose the cap on the entire of all supply chain network. Assume that Ccap is the amount of carbon cap. Accordingly, a limitation would be considered as follows:
𝑍2≤ Ccap (11)
As discussed before, the carbon cap-and-trade policy is also considered by this study. Generally, there are two cases based on a positive and negative value of carbon credit as the result of Equation (12). If the environmental emissions are greater than the cap, a positive carbon credit would be considered. Conversely, if the environmental emissions are lower than the cap, a negative carbon credit value would be traded.
𝑍2− Ccap (12)
If it is assumed that ψ would be the unit carbon emission cost. Accordingly, the total cost of proposed system after the conditions of carbon cap and trade would be as follows:
𝑍1+ ψ × (𝑍2− 𝐶𝑐𝑎𝑝) (13)
The other constraints of model can be listed as follows:
∑ 𝑌𝐵 𝐶𝐵𝑃= 1; ∀𝐶, 𝑃 (14)
∑ 𝑍𝐴 𝐵𝐴𝐼= 𝑋𝐵; ∀𝐼, 𝐵 (15)
∑ ∑ 𝐷𝐴 𝐼 𝐵𝐼× 𝑆𝐼× 𝑍𝐵𝐴𝐼≤ 𝑆𝑐𝑎𝑝𝐵× 𝑋𝐵; ∀𝐵 (16)
∑ ∑ 𝜇𝐶 𝑃 𝐶𝑃×𝑇𝑃× 𝑌𝐶𝐵𝑃≤ 𝑃𝑐𝑎𝑝𝐵𝑃; ∀𝐵, 𝑃 (17)
∑ ∑ 𝜇𝐶 𝐼 𝐶𝑃×𝑏𝑃𝐼× 𝑌𝐶𝐵𝑃≤ ∑ 𝐷𝐼 𝐵𝐼; ∀𝐵, 𝑃 (18)
∑ ∑ 𝜎𝐶 𝑃 𝐶𝑃×𝑌𝑉𝐵𝑃× 𝑏𝑃𝐼2 = 𝑉𝐵𝐼; ∀𝐵, 𝐼 (19)
𝐿𝐶𝑃(𝑡−1)+ 𝑄𝑅𝐶𝐵𝑃𝑡= 𝐿𝑛𝑃𝑡; ∀𝐶, 𝐵, 𝑃, 𝑡 (20)
∑ ∑ 𝑄𝑅𝐶 𝑃 𝐶𝐵𝑃𝑡× 𝑇𝑃≤ 𝑇𝑃𝐵𝑡; ∀𝐵, 𝑡 (21)
∑ 𝐿𝑃 𝑁𝐶𝑃𝑡× 𝑈𝑃≤ 𝑆𝑐𝑎𝑝𝐶; ∀𝐶, 𝑡 (22)
∑ (𝑄𝑅𝑡 𝐶𝐵𝑃𝑡+ 𝑄𝑂𝐶𝐵𝑃𝑡) ≤ 𝑌𝐶𝐵𝑃𝑡× 𝑀; ∀𝐶, 𝐵, 𝑃 (23)
𝑋𝐵, 𝑌𝐶𝐵𝑃, 𝑍𝐵𝐴𝐼∈ {0,1} (24)
𝑄𝑅𝐶𝐵𝑃𝑡, 𝑄𝑂𝐶𝐵𝑃𝑡≥ 0 (25)
As detailed by Equation (14), this constraint guarantees that for all products, the demand of distributers (warehouses) should be satisfied by only one established manufacturer or plant center. As being indicated by Equation (15), the supplier A must provide its supplying, operationally. As such, Equations (15) and (16) also proposed that manufacturer B is restricted by a specific capacity storage and production limitation. To compute the average and variance of production to manufacture at manufacturer B, Equations (17) and (18) are provided to do this end. An interaction between the demand of distributors by considering previous, current and the production quantity periods for each product P as the main inventory decisions is considered by Equation (19). The production quantities restriction during regular and overtime hours are decided by Equations (20) and (21). The distributer capacity storage is determined by Equation (22). To support that a product P can be manufactured by only an opened manufacturer B, Equation (23) confirms this issue. At the end, the binary variables are guaranteed by Equation (24). Similarly, the positive continuous variables are ensured by Equation (25).
To the best of our knowledge, the presented model has not been introduced by a similar study. Hence, the proposed model has addressed a sustainable production-distribution supply chain network with carbon emissions policies. Generally, the simplest case of a location-allocation problem is NP-hard [31-33]. In this regard, the presented model as a type of location-allocation problem is very difficult to solve due to inventory and multi-period decisions as well as considering a multi-echelon supply chain network. Therefore, metaheuristics are needed to be considered for solving such models when especially the size of problem increases.
3. PROPOSED HYBRID METAHEURISTIC
ALGORITHM
algorithms i.e. SA [34], WOA [35] and a Hybrid of WOA and SA (HWS) has been applied.
Generally, the proposed HWS considers WOA as the main loop and SA as the local loop. Due to the best of our knowledeg, there is no similar algorithm to combine these two algorithms by our methodology. In the developed HWS, instead of spiral updating positions of each search agent, a local search based on SA is considered for each agent. Actually, in the proposed algorithm, SA does the local search based on the spiral procedures and accepting and or rejecting of solutions have been formulated regarding the SA structure. Based on our treatments, this SA rules help the algorithm to improve both intensification and diversification phases. Except of this operation of WOA, the other steps of HWS is completely similar to the main original idea of WOA. Note that this applied optimizer is also developed in a multi-objective version. To consider more details about the proposed HWS, its pseudo-code is provided as shown in Figure 1.
3. 1. Encoding Scheme Whenever a metaheuristic
procedure is used, coding and decoding the solution of mathematical problem is required [26-30]. The proposed problem has three main binary decision variables i.e.
𝑋𝐵, 𝑌𝐶𝐵𝑃 and 𝑍𝐵𝐴𝐼. Two other continuous variables i.e.
𝑄𝑅𝐶𝐵𝑃𝑡 and 𝑄𝑂𝐶𝐵𝑃𝑡can be calculated based on the binary
variables. Among them, 𝑋𝐵 is a type of location variables.
As such, 𝑌𝐶𝐵𝑃 and 𝑍𝐵𝐴𝐼are two allocation variables. For
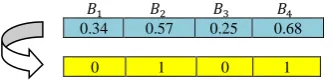
both groups, a popular technique called random-key is utilized to transform an infeasible representation to a feasible one. Figure 2 shows the representation for selection of manufacturers. Regarding this example, there are four potential sites for manufactures and among them, only two of them must be selected to be opened. In the first step, a number of random numbers distributed by uniform function (0, 1) has been generated. Accordingly, if this value greater than 0.5, it get 1 to be considered as an open manufacturer. Otherwise, it gets 0. Notably, the higher values generally get 1. Based on this rule, the second and fourth manufacturer should be opened. More details can be seen in Figure 2, as well.
Regarding the allocation variables, based on the located manufacturers, a priority-based representation has been utilized similar to recent similar studies [7-8]. The considered example for representation of allocation has been considered in Figure 3. There are two suppliers and three distributers by considering two items to be supplied from suppliers to manufacturers as well as four
products delivered from manufacturers to distributers. Note that all items and products should be assigned in all levels. Therefore, as represented in Figure 3, for each selected manufacturer, a number distributed by uniform function (0, 2) is generated. As such, for each distributer, based on the selected manufacturers, a uniform distributed function should be designed. Therefore,
Tune the parameters of HWS. Initialize the whale’s population.
Calculate the fitness of each search agents by considering the proposed encoding schemes.
Set the Pareto optimal solutions. while (t< maximum number of iteration)
for each search agent
Update A, a, C, l, and p; */they are some random parameters of WOA/*
if1 (p<0.5) if2 (|A|< l)
Update the position of current search agent by Encircle prey.
elseif2 (|A|> l)
Select a random search agent;
Update the position of current search agent by search for prey.
endif2 elseif1 (p≥0.5)
Do the spiral updating procedures and
generate
x
newfor each search agent.if ∆𝑓1≤ 0 && ∆𝑓2≤ 0
Update this search agent
else if ∆𝑓1≥ 0 && ∆𝑓2≤ 0 || ∆𝑓1≤
0 && ∆𝑓2≥ 0
Put this solution in Pareto set else ∆𝑓1≥ 0 && ∆𝑓2≥ 0
𝑃1= exp ( −∆𝑓1
𝑇 ) , 𝑃2= exp ( −∆𝑓2
𝑇 ) , h=rand
if h<𝑃1 && h< 𝑃2
Update this search agent endif
endif1 endfor
Check if any search agents goes beyond the search space and amend it.
Update T and its reduction rate. Update the Pareto optimal frontiers. t=t+1;
endwhile
return the non-dominated solutions;
Figure 1. The pseudo-code of proposed multi-objective of HWS
𝐵1 𝐵2 𝐵3 𝐵4
0.34 0.57 0.25 0.68
0 1 0 1
Figure 2. The used technique for selecting manufactures to be opened
from Figure 2, a uniform distributer between (1,2) and (3,4) was considered. Taken together, supplier one was allocated to both selected manufacturers. As such, the second manufacturer is considered for the first and third distributers. The fourth manufacturer is assigned to the second and fourth distributers, as well. More details are given by Figure 3.
4. COMPUTATIONAL EXPERIMENTS
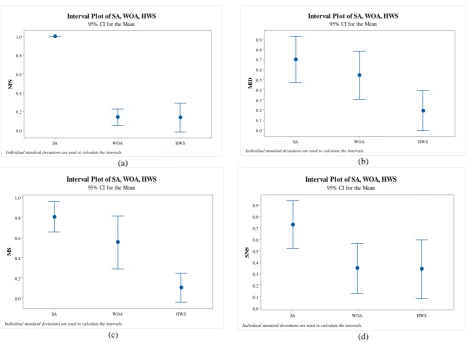
A number of efficient evaluation metrics is required to assess the metaheuristics in an efficient way. Considerably, this study utilizes four well-known evaluation metrics including Number of Pareto Solutions (NPS) [28, 34], Mean Ideal Distance (MID) [25-27], Spread of Non-dominance Solution (SNS) [1-2] and Maximum Spread (MS) [29-30]. Thus, these metrics are well-known and have been utilized in several studies, more explanations along with their formulations are referred to their main papers referred to literature [25-29]. Note that all test problems are generated using a benchmarked method from the literature [25-29].
From Table 1, the results obtained by each algorithm based on the evaluation metrics under each instances are reported. The best values in each test problem are revealed in bold. Except the MID, for other metrics,
higher values are more preferable. Meanwhile, the lower value of MID brings the better capability of algorithms. Overall, from the tables, the proposed HWS shows a better performance in comparison of other algorithms.
Figure 4 divides into four sub-figures to show the LSD interval regarding each assessment metric. Regarding the NPS (Figure 4(a)), there is a clear difference between the performance of SA and two other algorithms. As can be seen, the SA is the worst optimizer. However, WOA is slightly better than WHS in this item. Based on the MID (Figure 4(b)), it can be resulted that the proposed HWS is clearly outperformed both WOA and SA. As such, the SA brings the worst capability in this analysis. Similar to the MID, as can be seen from the MS (Figure 4(c)), the HWS is generally better than other metaheuristics. At the last, as can be resulted from Figure 4(d), the results of SA in the issue of SNS is the worst behaviour. In addition, there is a set of similarities between the WOA and HWS. Nevertheless, the WOA is better than the HWS in this case.
Overall, the performance of both WOA and HWS provides a competitive result. Although the WOA shows a better performance in term of NPS and SNS, the proposed HWS generally outperform the other algorithms. Note that the main demerit of HWS is the computational time of algorithm.
0.31 0.52 1.95 3.68 1.92 3.47
1 1 2 4 2 4
Figure 3. The used technique for allocation of suppliers to manufacturers and manufacturers to distributers
TABLE 1. Comparison of applied optimizers based on the evaluation metrics of Pareto optimal frontiers
Test problem
NPS MID MS SNS
SA WOA HWS SA WOA HWS SA WOA HWS SA WOA HWS
P1 5 9 8 2.3656 1.4909 2.1668 322971 364337 367835 357683 284855 252546
P2 9 11 11 2.1409 1.1119 1.1781 583346 673114 659895 699981 786742 696675
P3 6 12 13 3.0635 2.1143 2.0267 674618 724566 711843 889612 981314 996440
P4 8 11 12 4.6701 3.6118 2.1146 756024 1017213 995784 1500420 1400858 1634697
P5 9 12 13 2.9635 3.6959 2.6112 894850 574956 1525546 2355835 2136201 2484306
P6 9 13 12 5.7248 3.1876 2.8049 1261434 968246 1545794 2701689 2586113 2481696
P7 10 11 12 7.3716 5.0146 5.4399 1053899 1057282 1129750 3219535 3467159 2868420
P8 11 13 14 4.5463 5.8759 5.6609 1035657 919442 1129797 3463876 3718771 3506257
P9 12 14 12 6.8472 4.8438 4.0797 1506496 1865527 1855450 5140232 5409774 5375823
P10 10 14 12 3.6925 3.9634 3.1708 1750385 1839931 2248624 5210873 5702810 5973421
P11 11 14 15 5.7481 5.8276 4.0531 1668077 1399581 2302254 5185450 6044003 6090874
P12 8 13 14 2.6435 4.8701 6.3874 1585811 1761960 1457975 5801526 6319580 6249123
P13 10 15 15 3.2891 4.2675 3.2895 1547389 1475869 1563762 5833145 6657432 7057842
P14 11 16 16 4.4763 4.9788 3.8537 1453687 1564587 1674284 5437869 6935741 7125647
(a) (b)
(c) (d)
Figure 4. LSD intervals based on the RDI the assessment metrics
5. CONCLUSIONS
Generally, decision makers in supply chain systems face many challenges in the sustainable supply chain management. During the study of literature on carbon policies for multi-level supply chain network design, we explored a coordinated carbon policies in a supply chain system, which helps organization to design a supply chain based on economic advantages and environmental benefits. The review of extantliterature revealed that the supply chain activities including but not limited to manufacturing, transportation and inventoryplanning are the core reasons of carbon emission. Taking all of this into account, this finding motivated us to propose an integrated supply chain based on both production and distribution models for a forward supply chain network based on the environmental aspects with uncertain customerdemands. The model provided was included the location of manufacturers, allocation, andthe inventory decisions of different items of products. Whole of them were formulated by a mixed integer non-linear programming model. The main contribution of model was to add three different carbon emission policies for a
forward supply chain network design problem considering lead time constraints.
Another main novelty of this study was to develop a new hybrid metaheuristic algorithm called as HWS based on the WOA and SA. This algorithm was compared with its original ideas i.e. WOA and SA. The algorithms were tuned by Taguchi method. In addition, four well-known multi-objective assessment metrics were utilized to evaluate the algorithms with a comprehensive analysis. Based on the statistical analyses, the proposed HWS outperform two other algorithms and give the competitive results. Based on the sensitivity analyses, the correlation of environmental emissions and some main decisions of an economic supply chain network to cover the activities of distributing, manufacturing and storing have been analyzed. In addition, the impact of lead time on the environmental emissions along with distribution policy, and three-echelon supply chain system were evaluated through a set of test problems with different difficulties. Taken together, these considerations in a forward supply chain network design give this ability to have a comparison with three carbon policies employed by this paper. Among them, carbon cap-and-trade may be more beneficial for such systems.
HWS WOA
SA 1.0
0.8
0.6
0.4
0.2
0.0
N
P
S
Interval Plot of SA, WOA, HWS
95% CI for the Mean
Individual standard deviations are used to calculate the intervals.
HWS WOA
SA 0.9
0.8
0.7
0.6
0.5
0.4
0.3
0.2
0.1
0.0
M
ID
Interval Plot of SA, WOA, HWS
95% CI for the Mean
Individual standard deviations are used to calculate the intervals.
HWS WOA
SA 1.0
0.8
0.6
0.4
0.2
0.0
M
S
Interval Plot of SA, WOA, HWS
95% CI for the Mean
Individual standard deviations are used to calculate the intervals.
HWS WOA
SA 0.9
0.8 0.7 0.6 0.5 0.4 0.3 0.2 0.1 0.0
S
N
S
Interval Plot of SA, WOA, HWS
95% CI for the Mean
6. REFERENCES
1. Fathollahi-Fard, A.M., Hajiaghaei-Keshteli, M. and Mirjalili, S., "A set of efficient heuristics for a home healthcare problem",
Neural Computing and Applications, (2019), 1-21.
2. Hajiaghaei-Keshteli, M. and Fathollahi-Fard, A.M., "A set of efficient heuristics and metaheuristics to solve a two-stage stochastic bi-level decision-making model for the distribution network problem", Computers & Industrial Engineering, Vol. 123, (2018), 378-395.
3. Absi, N., Dauzère-Pérès, S., Kedad-Sidhoum, S., Penz, B. and Rapine, C., "Lot sizing with carbon emission constraints",
European Journal of Operational Research, Vol. 227, No. 1, (2013), 55-61.
4. Ghosh, A., Jha, J. and Sarmah, S., "Optimizing a two-echelon serial supply chain with different carbon policies", International Journal of Sustainable Engineering, Vol. 9, No. 6, (2016), 363-377.
5. Beamon, B.M., "Supply chain design and analysis:: Models and methods", International Journal of Production Economics, Vol. 55, No. 3, (1998), 281-294.
6. Benjaafar, S., Li, Y. and Daskin, M., "Carbon footprint and the management of supply chains: Insights from simple models",
IEEE Transactions on Automation Science and Engineering, Vol. 10, No. 1, (2012), 99-116.
7. Golmohamadi, S., Tavakkoli-Moghaddam, R. and Hajiaghaei-Keshteli, M., "Solving a fuzzy fixed charge solid transportation problem using batch transferring by new approaches in meta-heuristic", Electronic Notes in Discrete Mathematics, Vol. 58, (2017), 143-150.
8. Fu, Y., Tian, G., Fathollahi-Fard, A.M., Ahmadi, A. and Zhang, C., "Stochastic multi-objective modelling and optimization of an energy-conscious distributed permutation flow shop scheduling problem with the total tardiness constraint", Journal of Cleaner Production, Vol. 226, (2019), 515-525.
9. Fathollahi-Fard, A.M., Hajiaghaei-Keshteli, M. and Tavakkoli-Moghaddam, R., "The social engineering optimizer (SEO)",
Engineering Applications of Artificial Intelligence, Vol. 72, (2018), 267-293.
10. Zhang, B. and Xu, L., "Multi-item production planning with carbon cap and trade mechanism", International Journal of Production Economics, Vol. 144, No. 1, (2013), 118-127. 11. Fathollahi-Fard, A.M., Govindan, K., Hajiaghaei-Keshteli, M.
and Ahmadi, A., "A green home health care supply chain: New modified simulated annealing algorithms", Journal of Cleaner Production, Vol. 240, (2019), 118200.
12. Bouchery, Y., Ghaffari, A., Jemai, Z. and Tan, T., "Impact of coordination on costs and carbon emissions for a two-echelon serial economic order quantity problem", European Journal of Operational Research, Vol. 260, No. 2, (2017), 520-533. 13. Fathollahi-Fard, A.M., Hajiaghaei-Keshteli, M., Tian, G. and Li,
Z., "An adaptive lagrangian relaxation-based algorithm for a coordinated water supply and wastewater collection network design problem", Information Sciences, (2019). https://doi.org/10.1016/j.ins.2019.10.062
14. Chen, C.-L. and Lee, W.-C., "Multi-objective optimization of multi-echelon supply chain networks with uncertain product demands and prices", Computers & Chemical Engineering, Vol. 28, No. 6-7, (2004), 1131-1144.
15. Chen, X., Benjaafar, S. and Elomri, A., "The carbon-constrained eoq", Operations Research Letters, Vol. 41, No. 2, (2013), 172-179.
16. Darvish, M., Larrain, H. and Coelho, L.C., "A dynamic multi-plant lot-sizing and distribution problem", International Journal of Production Research, Vol. 54, No. 22, (2016), 6707-6717. 17. Daskin, M.S., Coullard, C.R. and Shen, Z.-J.M., "An
inventory-location model: Formulation, solution algorithm and
computational results", Annals of Operations Research, Vol. 110, No. 1-4, (2002), 83-106.
18. Dobos, I., "Tradable permits and production-inventory strategies of the firm", International Journal of Production Economics, Vol. 108, No. 1-2, (2007), 329-333.
19. Sabri, E.H. and Beamon, B.M., "A multi-objective approach to simultaneous strategic and operational planning in supply chain design", Omega, Vol. 28, No. 5, (2000), 581-598.
20. Chan, F.T., Chung, S. and Wadhwa, S., "A hybrid genetic algorithm for production and distribution", Omega, Vol. 33, No. 4, (2005), 345-355.
21. Hua, G., Cheng, T. and Wang, S., "Managing carbon footprints in inventory management", International Journal of Production Economics, Vol. 132, No. 2, (2011), 178-185.
22. Jaber, M.Y., Glock, C.H. and El Saadany, A.M., "Supply chain coordination with emissions reduction incentives", International Journal of Production Research, Vol. 51, No. 1, (2013), 69-82. 23. Li, J., Su, Q. and Ma, L., "Production and transportation outsourcing decisions in the supply chain under single and multiple carbon policies", Journal of Cleaner Production, Vol. 141, (2017), 1109-1122.
24. Shu, J., Teo, C.-P. and Shen, Z.-J.M., "Stochastic transportation-inventory network design problem", Operations Research, Vol. 53, No. 1, (2005), 48-60.
25. Hajiaghaei-Keshteli, M. and Fard, A.M.F., "Sustainable closed-loop supply chain network design with discount supposition",
Neural Computing and Applications, Vol. 31, No. 9, (2019), 5343-5377.
26. Fathollahi-Fard, A.M. and Hajiaghaei-Keshteli, M., "A stochastic multi-objective model for a closed-loop supply chain with environmental considerations", Applied Soft Computing, Vol. 69, (2018), 232-249.
27. Fathollahi-Fard, A.M., Hajiaghaei-Keshteli, M. and Mirjalili, S., "Hybrid optimizers to solve a tri-level programming model for a tire closed-loop supply chain network design problem", Applied Soft Computing, Vol. 70, (2018), 701-722.
28. Sahebjamnia, N., Fathollahi-Fard, A.M. and Hajiaghaei-Keshteli, M., "Sustainable tire closed-loop supply chain network design: Hybrid metaheuristic algorithms for large-scale networks",
Journal of Cleaner Production, Vol. 196, (2018), 273-296. 29. Fathollahi-Fard, A.M., Hajiaghaei-Keshteli, M. and Mirjalili, S.,
"Multi-objective stochastic closed-loop supply chain network design with social considerations", Applied Soft Computing, Vol. 71, (2018), 505-525.
30. Xu, X., He, P., Xu, H. and Zhang, Q., "Supply chain coordination with green technology under cap-and-trade regulation",
International Journal of Production Economics, Vol. 183, (2017), 433-442.
31. Toptal, A., Özlü, H. and Konur, D., "Joint decisions on inventory replenishment and emission reduction investment under different emission regulations", International Journal of Production Research, Vol. 52, No. 1, (2014), 243-269.
32. Fathollahi-Fard, A.M., Hajiaghaei-Keshteli, M. and Tavakkoli-Moghaddam, R., "A bi-objective green home health care routing problem", Journal of Cleaner Production, Vol. 200, (2018), 423-443.
33. Samadi, A., Mehranfar, N., Fathollahi Fard, A. and Hajiaghaei-Keshteli, M., "Heuristic-based metaheuristics to address a sustainable supply chain network design problem", Journal of Industrial and Production Engineering, Vol. 35, No. 2, (2018), 102-117.
34. Kirkpatrick, S., Gelatt, C.D. and Vecchi, M.P., "Optimization by simulated annealing", Science, Vol. 220, No. 4598, (1983), 671-680.
35. Mirjalili, S. and Lewis, A., "The whale optimization algorithm",
A Novel Hybrid Whale Optimization Algorithm to Solve a Production-Distribution
Network Problem Considering Carbon Emissions
N. Mehranfara, M. Hajiaghaei-Keshtelib, A. M. Fathollahi-Fardc
a Department of Industrial Engineering, Shomal University, Amol, Iran
b Department of Industrial Engineering, University of Science and Technology of Mazandaran, Behshahr, Iran c Department of Industrial Engineering and Management Systems, Amirkabir University of Technology, Tehran, Iran
P A P E R I N F O
Paper history: Received 29 March 2019
Received in revised form 11 November 2019 Accepted 26 January 2020
Keywords:
Production-Distribution Networks Optimization
Carbon Emissions Nature-inspired Algorithm Whale Optimization Algorithm Simulated Annealing
هدیکچ
هب یدایز هجوت ،هزورما ارب نبرک راشتنا تاررقم هب
ی عت نیی مصت می گ ناگدنری اه هکبش ی لوت دی زوت و عی ارب ی ودت نی س متسی اه ی اضر روط هب اهنآ تی
ا .دراد دوجو شخب نی بدا ،تای ز هقلاع یدای هعسوت هب یاه شور ر یضای دج دی ارب ی ا لح نی
ا هنادنمشوه ،لکشم ی
نچ .تسا هتشاد نی
لکشم ی گنا هزی ارب ار ام ی لح کی هلاسم حارط ی زوت هکبش عی و لوت دی هب هجوت اب
س تسای اه ی م رد نبرک راشتنا نای
لوا نی ا رد تاعلاطم نی هزوح یتاقیقحت روگلا اب متی هب هنی زاس ی کرت گنهن یبی دج دی حرطم م ی ا رب .دنک نی ،ساسا کی ر همانرب لدم یزی طخ ریغ ی حص ددع حی کرت یبی هعسوت هتفای ارب .تسا ی اب هلباقم هلاسم پ ،یداهنشی روآون ی د یرگی ا زا نی ا راک نی هک تسا کی لح شور متیروگلا دج دی کرت یبی نتبم ی روگلا رب متی هب هنی زاس ی گنهن متیروگلا و
هدش یزاس هیبش دیربت ناونع هب
کی هب هنی خا قفوم زاس ری
ارب ی پ تلاکشم لح هدیچی غ و ری طخ ی فرعم ی راکمه .دوش ی روگلا متی اه ی دربراک ی شور طسوت عماج روط هب یچوگات
حارط ی .تسا هدش ،نایاپ رد زجت هی لحت و لی هدافتسا اب هدرتسگ
زا کی اقم هعلاطم هسی ا ی خرب اب هارمه ی زجت زا هی لحت و لی هفده دنچ .تسا هدش ماجنا