R E S E A R C H A R T I C L E
Open Access
Modulation of renal oxygenation and
perfusion in rat kidney monitored by
quantitative diffusion and blood oxygen
level dependent magnetic resonance
imaging on a clinical 1.5T platform
Neil P. Jerome
1, Jessica K. R. Boult
1, Matthew R. Orton
1, James d
’
Arcy
1, David J. Collins
1, Martin O. Leach
1,
Dow-Mu Koh
2and Simon P. Robinson
1*Abstract
Background:To investigate the combined use of intravoxel incoherent motion (IVIM) diffusion-weighted (DW) and blood oxygen level dependent (BOLD) magnetic resonance imaging (MRI) to assess rat renal function using a 1.5T clinical platform.
Methods:Multiple b-value DW and BOLD MR images were acquired from adult rats using a parallel clinical coil arrangement, enabling quantitation of the apparent diffusion coefficient (ADC), IVIM-derived diffusion coefficient (D), pseudodiffusion coefficient (D*) and perfusion fraction (f), and the transverse relaxation time T2*, for whole kidney, renal cortex, and medulla. Following the acquisition of two baseline datasets to assess measurement repeatability, images were acquired following i.v. administration of hydralazine, furosemide, or angiotensin II for up to 40 min.
Results:Excellent repeatability (CoV <10 %) was observed for ADC, D, f and T2* measured over the whole kidney. Hydralazine induced a marked and significant (p< 0.05) reduction in whole kidney ADC, D, and T2*, and a significant (p< 0.05) increase in D* and f. Furosemide significantly (p< 0.05) increased whole kidney ADC, D, and T2*. A more variable response to angiotensin II was determined, with a significant (p< 0.05) increase in medulla D* and significant (p< 0.05) reduction in whole kidney T2* established.
Conclusions:Multiparametric MRI, incorporating quantitation of IVIM DWI and BOLD biomarkers and
performed on a clinical platform, can be used to monitor the acute effects of vascular and tubular modulating drugs on rat kidney function in vivo. Clinical adoption of such functional imaging biomarkers can potentially inform on treatment effects in patients with renal dysfunction.
Keywords:Diffusion, BOLD, Renal, Imaging, Furosemide, Angiotensin, Hydralazine
* Correspondence:[email protected]
1Cancer Research UK Cancer Imaging Centre, Division of Radiotherapy &
Imaging, The Institute of Cancer Research, London SM2 5NG, UK Full list of author information is available at the end of the article
Background
Decreased renal perfusion and medullary oxygenation are considered predisposing factors to the onset of acute kid-ney injury [1]. Furthermore, renal medullary oxygenation has been implicated in hypertension and diabetic ne-phropathy [2, 3]. Non-invasive imaging techniques such as magnetic resonance imaging (MRI) are being actively evaluated pre-clinically to advance the understanding of renal microcirculation and pathophysiology in vivo, with a strong emphasis on establishing their robustness for clin-ical translation [4].
MRI is an important tool for clinical disease assessment and treatment response. In addition to exquisite soft tissue contrast and anatomic detail, advanced functional MRI techniques, such as diffusion-weighted imaging (DWI) and blood oxygenation level-dependent (BOLD) MRI now provide a means of defining quantitative biomarkers to in-form on biologically relevant structure-function relation-ships in tissues, enabling an understanding of their behaviour and spatial distribution [5].
In nephrology, application of a monoexponential model to DW MR images of increasing diffusion-weighting yields the apparent diffusion coefficient (ADC), shown to de-crease as a consequence of acute tubular necrosis, renal artery stenosis, and acute and chronic renal failure, as well as post-transplant kidney rejection [6–8]. The biexponen-tial intravoxel incoherent motion (IVIM) model reports two distinct diffusion constants as fractional components; the pseudodiffusion constant D*, of fractional volume f, associated with a faster incoherent flow component, and D which reflects random tissue water diffusion [9]. Highly vascular tissues such as the kidney show non-monoexponential signal decay with increasing diffusion weighting (b-value) [10, 11], thought to reflect a rapidly decaying signal component visible at lower b-values. The physiological contribution towards this fast diffusion com-ponent is however complex because of the presence of a tubular flow fraction, which may exhibit similar diffusion characteristics to the vascular contribution. Using IVIM DWI may improve the understanding of the contribution of renal tubular flow towards the diffusion signal [12].
BOLD MRI has been extensively used both pre-clinically and pre-clinically to assess renal medullary oxygen-ation, using deoxyhaemoglobin as an endogenous con-trast agent. Deoxyhaemoglobin is paramagnetic and creates magnetic susceptibility perturbations around blood vessels, decreasing the MRI transverse relaxation time T2*. As the oxygenation state of haemoglobin is re-lated to the arterial blood paO2, which is in equilibrium with tissue pO2, changes in renal T2* are used to infer alterations in renal pO2[13].
Multiparametric MRI strategies, enabling the investi-gation of several imaging biomarkers in the same im-aging session, are being increasingly exploited to provide
additional mechanistic insight. The combination of IVIM DWI with BOLD imaging has the potential to illu-minate the relative sensitivity of the biexponential DWI signal to vascular versus tubular flow, by observing and correlating the changes in IVIM parameters with T2* [14, 15]. In this study, the repeatability of, and the effects of established pharmacological/physiological interven-tions known to modulate renal vascular flow and/or renal tubular excretion on, IVIM DWI and BOLD MRI biomarkers were investigated in the rat kidney in vivo. This multiparametric imaging strategy was applied on a clinical 1.5T MRI platform, using standard clinical hardware, and used the known actions of hydralazine, furosemide, and angiotensin II to probe the spatial rela-tionship between blood oxygenation, blood flow, vascu-lar fraction, and tubuvascu-lar flow within the kidney.
Methods
Animal preparation
This study was performed in accordance with the local ethical review panel, the UK Home Office Ani-mals (Scientific Procedures) Act 1986, the United King-dom National Cancer Research Institute guidelines for the welfare of animals in cancer research and the ARRIVE (animal research: reporting in vivo experiments) guide-lines [16, 17] (see Additional file 1 for ARRIVE checklist). Female Sprague-Dawley rats (n= 4 total, three randomised to each imaging session, 250–300 g, Charles River, Mar-gate, UK) were anaesthetised with a 4 ml/kg intraperito-neal injection of fentanyl citrate (0.315 mg/ml) plus fluanisone (10 mg/ml (Hypnorm; Janssen Pharmaceutical Ltd. High Wycombe, UK)), midazolam (5 mg/ml (Hypno-vel; Roche)), and water (1:1:2). A lateral tail vein was can-nulated with a heparinised 27G butterfly catheter (Venisystems, Hospira, Royal Leamington Spa, UK) to enable the remote administration of drugs.
MRI acquisition
0.5 mm2in-plane, 1 mm thick slice, matrix 256 × 149, scan time 4 min 30 s.
For DWI studies, images were acquired in free-breathing using a 2D EPI sequence with spectral attenu-ated inversion recovery (SPAIR) fat suppression, TR = 2.1 s and TE = 71 ms, with 9 b-values (0, 20, 40, 60, 80, 100, 200, 400, 800 s/mm2 trace-weighted), isotropic voxel size 1.5 mm3, matrix 72 × 72, parallel imaging fac-tor of 2 and 18 signal averages (acquisition time 16 min). The imaging sequence mirrors the b-values used for clinical diffusion-weighted imaging in patients. DW images were thus acquired prior to and 40 min after administration of drug, or with 40 min spacing for re-peatability data; based on extant literature it was pre-dicted that this time window would be sufficient to capture the long action of administered agents [18].
BOLD imaging was performed using a multiple gradi-ent echo sequence, with TR = 300 ms, TE = 5, 10, 20, 30, and 40 ms, fat suppression, parallel imaging factor 2, voxel size 0.6 × 0.6 mm in-plane and 5 mm slice thick-ness. A 128 × 128 matrix was acquired and interpolated to 256 × 256. The flip angle was 25°, with 12 long-term signal averages, giving an acquisition time of 4 min 30 s. BOLD data were acquired at baseline, and repeated three times (scan time for all BOLD measurements 18 min) immediately following administration of drug.
For each rat, imaging was performed twice in the same session without any drug administration to determine measurement repeatability and coefficients of variation (CoV), and before and after administration of each drug. The animals were allowed to fully recover before any subsequent imaging session. Rats were administered with either hydralazine (5 mg/kg, Sigma-Aldrich, Poole, UK), furosemide (5 mg/kg, Sigma-Aldrich), both given as a bolus injection, or angiotensin II (Sigma-Aldrich), with a half-life of 16 ± 1 s [19], infused at 0.5μg/min/kg using a power injector. The known acute effects of these drugs are vasodilation, diuresis, and vasoconstriction, re-spectively, and thus expected to induce MRI signal changes in renal perfusion/tubular flow over the imaging timecourse.
MRI data analysis
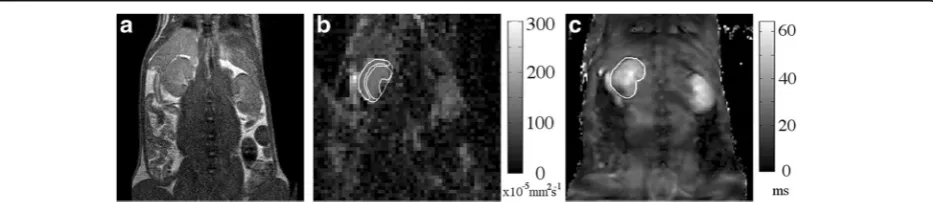
DW images were reviewed and analysed by an MR sci-entist with 4 years experience in conducting pre-clinical MR studies. DW-MRI and BOLD images were processed using proprietary software (ADEPT, The Institute of Cancer Research, UK). DWI ROIs were drawn on the central slice of each kidney through the equator plane on the calculated S0image, using anatomic T2-weighted and b = 800 s/mm2images for reference, around the en-tire renal outline (91 ± 12 voxels) of both kidneys, and within regions of the cortex and medulla (28 ± 7 voxels), defined as the single voxel outline of the kidney and the region inside, respectively (see Fig. 1 for example ROIs). For each analysis, fitting for perfusion-insensitive ADC (×10−5 mm2s−1) was performed using images for b = 200 s/mm2 and above, with a single-exponential model and a Levenberg-Marquardt algorithm. In tissues where the monoexponential ADC model is known to be a poor model, excluding the b-values known to be most sensi-tive to perfusion minimizes the dependence of resultant ADC on the exact choice of values used [20]. All b-value images were used for IVIM curve fitting; initial par-ameter estimates were obtained by fitting a monoexpo-nential model at b > 200 s/mm2to give an estimate of D, and projecting back to b = 0 to provide an initial estimate of the perfusion fraction f. Following this, an adaptation of Bayesian approaches [21, 22] was applied to all b-value data to derive final estimates of D (×10−5mm2s−1), f (%), and the pseudodiffusion coefficient D* (×10−2 mm2 s−1). The product estimate fD* (×10−4mm2s−1), associated with flow, was also calculated; the adapted Bayesian approach assumed Gaussian data errors and uniform prior distribu-tions for all unknown parameters.
For BOLD images, partial volume effects from slice thickness precluded accurate separation of the renal cor-tex and medulla, hence ROIs were drawn around the cen-tral slice of each kidney in the equatorial plane (516 ± 58 voxels). Single-exponential fitting with the Levenberg-Marquardt algorithm yielded estimates for T2*; sufficient signal to noise (SNR >20) was recorded at all echo times, and noise was not included in the model.
For all analyses, the median values for each ROI were reported, reducing effects from voxels where fitting did not converge. In cases where the slice positioning or sig-nal precluded confident drawing of the ROI, the kidney was excluded from analysis (n= 1, furosemide).
For statistical comparison, significance of results was assessed using non-parametric tests at 5 % using a Wilcoxon paired rank sum for DWI measurements, with a one-way ANOVA for the repeated BOLD measure-ments. The Pearson correlation statistic was calculated for values of the related diffusion parameters ADC and D.
Results
The use of parallel clinical coils on the 1.5T platform provided sufficient signal for functional MRI of the rat kidney. Representative anatomical T2-weighted images, and associated parametric ADC and T2* maps calculated from the same rat, with the renal cortex and medulla de-lineated in ADC map and whole kidney on T2*, are shown in Fig. 1.
DW MRI model comparison
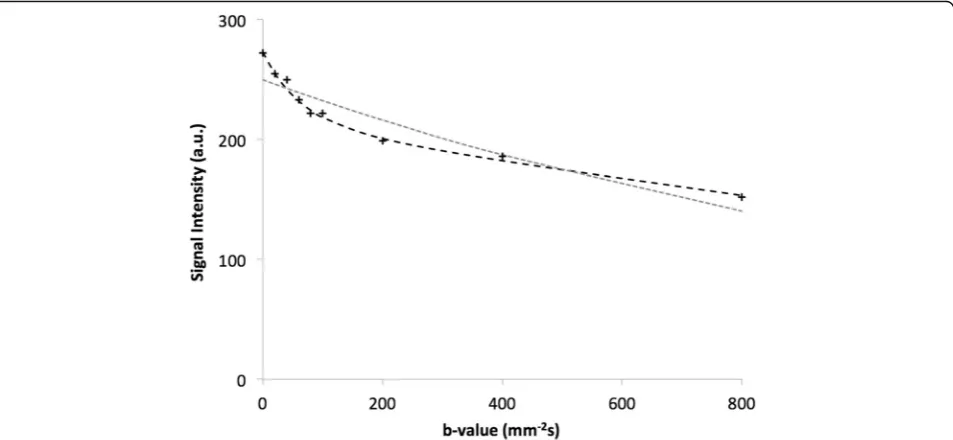
In all cases, non-monoexponential behaviour was evi-dent in the kidneys from plots of signal intensity against value. The baseline signal intensity curve against b-value for a representative renal voxel is shown in Fig. 2. Non-monoexponential decay was evident, with the over-laid fitted curves for monoexponential ADC and biexpo-nential IVIM models for all b-values clearly favouring the inclusion of the pseudodiffusion/perfusion compo-nent. The median residuals from fitting the ADC and
IVIM models for the whole kidney in the entire study population, taken as a proxy for quality of model fitting and normalised to degrees of freedom, were 24.3 and 12.3 a.u., respectively.
Taking the diffusion parameter D from the IVIM model, and comparing to the perfusion-insensitive ADC (calculated using b = 200 mm−2s and higher), an ex-pected good agreement was found both at baseline and following drug challenge (Tables 1 and 2). Pearson cor-relation coefficients for whole kidney ROIs from all studies were 0.86 at baseline and 0.98 post-challenge.
Repeatability
Good measurement repeatability of both diffusion and BOLD parameters was determined. The percentage change in fitted T2* in the ROI from baseline re-vealed no significant deviation, less than 2.6 %, over the experimental timecourse (CoVs from each time point to the next were less than 1 %), and was small relative to the effects determined following drug chal-lenges (Fig. 3, Table 3). Diffusion characteristics also showed no substantive change, except for D, which showed a significant decrease (p< 0.05) for the whole kidney ROI, although this result was not mirrored in the ADC fitting, which showed no significant change (Table 1). CoVs were comparable for ADC and D in each of the ROIs considered, indicating the robust-ness of fitting true diffusion, with the fast pseudo-diffusion constant D* from the IVIM model having a substantially higher CoV.
Fig. 2Representative diffusion signal plots. Signal intensity (arbitrary units) plotted against diffusion b-value for a single voxel acquired from one
rat kidney, showing the fitted bi-exponential IVIM model (black line), favoured in the presence of a perfusion contribution, and single exponential
Hydralazine
Hydralazine induced significant changes in all the dif-fusion parameters (p< 0.05) for all regions, except the medulla vascular fraction (f ) among the fitted IVIM diffusion parameters (Table 2). Ladder plots of me-dian results for individual whole-kidney ROIs showed remarkable consistency, with f, D*, and fD* increas-ing, and D decreasing (Fig. 4; perfusion-insensitive ADC closely matched D for response). For the cortex and medulla ROIs the same trend was observed, with the cortex having higher f and lower ADC than the medulla. The highly vascular renal cortex appeared to account for the majority of the increase in f observed at the whole-kidney level. BOLD MRI showed a progressive decrease in T2* after administration of hy-dralazine, becoming significant (p< 0.05) after 11 min (Table 3). Representative T2* maps from a repeatability scan (no intervention), together with maps acquired prior to and post-hydralazine, are shown in Fig. 5, clearly
showing the pharmacologically-induced change in trans-verse relaxation.
Furosemide
Diffusion parameter response to furosemide was more wide-ranging than the response to hydralazine, with greater variations between subjects (Fig. 4), but with no significant change in vascular fraction overall. In con-trast, the D and perfusion-insensitive ADC increased significantly and consistently in all ROIs, but D* was unaffected (Fig. 4). The temporal BOLD response post administration was pronounced, with an immediate and significant (p< 0.05) increase in T2* that reached over 125 % of baseline value at 6 min and remained elevated for the final time point.
Angiotensin II
Infusion of angiotensin II induced marked inter-renal variation in DWI response, with a significant (p< 0.05)
Table 1Repeatability measurements for ADC and IVIM diffusion models
Kidney Cortex Medulla
Scan 1 Scan 2 CoV (%) Scan 1 Scan 2 CoV (%) Scan 1 Scan 2 CoV (%) f (%) 26.9 ± 1.1 27.7 ± 2.3 18.7 27.1 ± 3.1 29.7 ± 3.7 24.5 23.4 ± 1.9 25.3 ± 3.5 22.5 D (10−5mm2s−1) 124.5 ± 7.5 113.4 ± 4.4 6.2 105.0 ± 5.2 96.7 ± 6.9 12.4 133.0 ± 10.6 119.4 ± 7.3 7.4
ADC (10−5mm2s−1) 101.9 ± 7 105.8 ± 4.4 9.3 85.5 ± 6.7 89.7 ± 7.3 17.5 111.3 ± 7.3 117.6 ± 5.5 11.9
D* (10−2mm2s−1) 4.0 ± 0.4 5.4 ± 0.8 24.3 3.7 ± 0.5 4.5 ± 0.8 32.8 4.2 ± 0.5 5.6 ± 0.9 27.4
fD* (10−4mm2s−1) 95.2 ± 7.3 151.2 ± 33.3 30.6 81.8 ± 6.8 129.5 ± 29.2 41.6 86.0 ± 9.0 150.4 ± 42.3 39.9
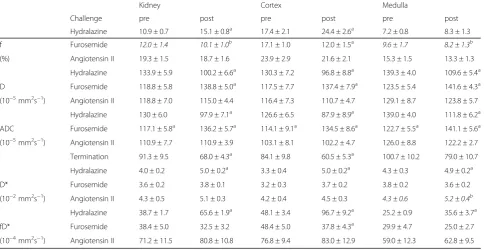
Table 2Fitted ADC and IVIM parameter estimates following vasomodulator challenge
Kidney Cortex Medulla
Challenge pre post pre post pre post Hydralazine 10.9 ± 0.7 15.1 ± 0.8a 17.4 ± 2.1 24.4 ± 2.6a 7.2 ± 0.8 8.3 ± 1.3 f Furosemide 12.0 ± 1.4 10.1 ± 1.0b 17.1 ± 1.0 12.0 ± 1.5a 9.6 ± 1.7 8.2 ± 1.3b
(%) Angiotensin II 19.3 ± 1.5 18.7 ± 1.6 23.9 ± 2.9 21.6 ± 2.1 15.3 ± 1.5 13.3 ± 1.3 Hydralazine 133.9 ± 5.9 100.2 ± 6.6a 130.3 ± 7.2 96.8 ± 8.8a 139.3 ± 4.0 109.6 ± 5.4a
D Furosemide 118.8 ± 5.8 138.8 ± 5.0a 117.5 ± 7.7 137.4 ± 7.9a 123.5 ± 5.4 141.6 ± 4.3a
(10−5mm2s−1) Angiotensin II 118.8 ± 7.0 115.0 ± 4.4 116.4 ± 7.3 110.7 ± 4.7 129.1 ± 8.7 123.8 ± 5.7
Hydralazine 130 ± 6.0 97.9 ± 7.1a 126.6 ± 6.5 87.9 ± 8.9a 139.0 ± 4.0 111.8 ± 6.2a
ADC Furosemide 117.1 ± 5.8a 136.2 ± 5.7a 114.1 ± 9.1a 134.5 ± 8.6a 122.7 ± 5.5a 141.1 ± 5.6a
(10−5mm2s−1) Angiotensin II 110.9 ± 7.7 110.9 ± 3.9 103.1 ± 8.1 102.2 ± 4.7 126.0 ± 8.8 122.2 ± 2.7
Termination 91.3 ± 9.5 68.0 ± 4.3a 84.1 ± 9.8 60.5 ± 5.3a 100.7 ± 10.2 79.0 ± 10.7
Hydralazine 4.0 ± 0.2 5.0 ± 0.2a 3.3 ± 0.4 5.0 ± 0.2a 4.3 ± 0.3 4.9 ± 0.2a
D* Furosemide 3.6 ± 0.2 3.8 ± 0.1 3.2 ± 0.3 3.7 ± 0.2 3.8 ± 0.2 3.6 ± 0.2 (10−2mm2s−1) Angiotensin II 4.3 ± 0.5 5.1 ± 0.3 4.2 ± 0.4 4.5 ± 0.3 4.3 ± 0.6 5.2 ± 0.4b
Hydralazine 38.7 ± 1.7 65.6 ± 1.9a 48.1 ± 3.4 96.7 ± 9.2a 25.2 ± 0.9 35.6 ± 3.7a
fD* Furosemide 38.4 ± 5.0 32.5 ± 3.2 48.4 ± 5.0 37.8 ± 4.3a 29.9 ± 4.7 25.0 ± 2.7
(10−4mm2s−1) Angiotensin II 71.2 ± 11.5 80.8 ± 10.8 76.8 ± 9.4 83.0 ± 12.9 59.0 ± 12.3 62.8 ± 9.5 Data are reported as mean of median ROI values ± standard error
a
indicatesp< 0.05 against baseline
b
increase determined in medulla D* only (Fig. 4). This was associated with a significant (p< 0.05 for baseline against post-administration time points) yet potentially transient decrease in T2*.
Discussion
In this study, we developed and applied a multi-parametric MRI strategy to evaluate the combination of DW and BOLD MRI for the assessment of rat renal function in vivo on a 1.5T clinical platform. IVIM DWI allows for the estimation of a fast component of water diffusivity (f, D*, and fD*) related to renal perfusion and tubular excretion, in addition to measuring tissue diffu-sivity (D). A challenge of using IVIM DWI to measure renal function is the difficulty in decoupling vascular and tubular contributions, as the two are intimately linked through autoregulation to maintain homeostasis. Additional mechanistic insight may be possible by com-bining IVIM DWI data with quantitative T2* measure-ments using BOLD MRI, which reflects renal blood volume and tissue oxygenation. Studies have shown that
increased T2* in the kidneys can result from increased hypoxia from higher tubular metabolism or increased blood volume [23, 24]. Combining IVIM DWI with T2* measurements allows corroboration of mutual informa-tion to explain changes in renal physiology with pharma-cological/physiological intervention.
Repeatability measurements are critical for providing confidence in observed changes following experimental intervention, but are not routinely performed in pre-clinical imaging investigations. In this study, we first established the repeatability of the quantitative MRI biomarkers, with low CoVs for repeated measures dem-onstrating that the functional parameters did not suffer from instability over the imaging timecourse. Compari-son of the perfusion-insensitive ADC and the IVIM par-ameter D showed good agreement both prior to and during challenge, suggesting that perfusion effects are mostly removed at b-values >200 mm−2s. Although the validity of this assumption will vary with different tis-sues, this demonstrates the usefulness of the Bayesian fitting method used herein for removing this assumption and fitting the whole dataset, rather than the more com-mon two-stage fitting of IVIM data. The use of clinical vendor surface coils used in parallel with volume coils provided sufficient signal and resolution to measure the MRI biomarkers with good repeatability. Unsurprisingly, measurement repeatability was poorer for the perfusion sensitive parameters compared with the perfusion-insensitive parameters and T2*.
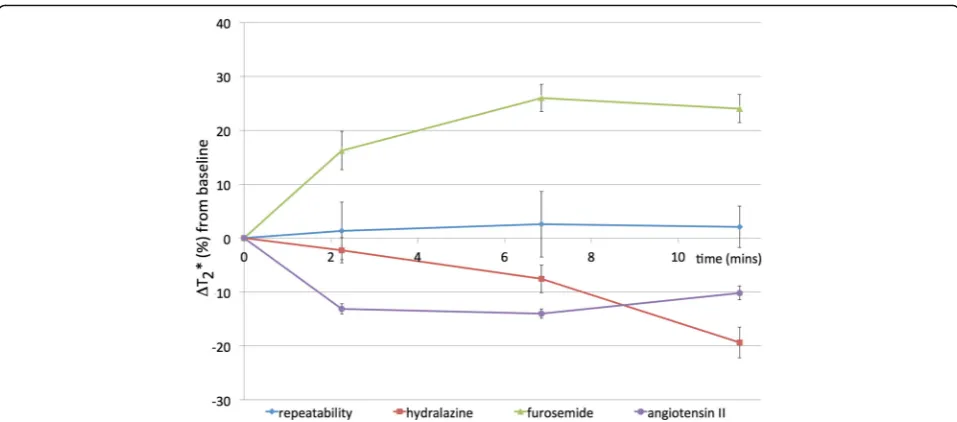
We then proceeded to evaluate the effects of drugs known to modulate renal vascular and tubular function. Hydralazine is a well-characterised systemic vasodilator that relaxes vascular smooth muscle; the increased Fig. 3Timecourse of intrinsic susceptibility contrast measurements. Graphs showing percentage change in renal T2* following administration of saline or vasomodulators. Data points are mean ± 1 standard error of median ROI values
Table 3Renal T2* (ms) for successive timepoints following
challenge
Time 0 2m15s 6m51s 11m24s Repeatability 32.8 ± 1.4 33.3 ± 1.5 33.7 ± 1.5a 33.5 ± 1.3
Hydralazine 37.7 ± 2.0 36.7 ± 2.3 34.5 ± 1.5 30.2 ± 1.4a
Furosemide 38.5 ± 2.2 44.7 ± 2.4ab 48.5 ± 2.8ab 47.8 ± 3.0a
Angiotensin II 34.5 ± 2.4 29.8 ± 1.9ab 29.4 ± 1.1a 30.7 ± 1.1a Data are reported as mean of median ROI values ± 1 standard error of the mean
a
indicatesp< 0.05 against baseline
b
vascular fraction determined in the IVIM model, and re-duction in T2*, is consistent with a hydralazine-induced increase in (deoxygenated) renal blood volume. Further-more, the associated reduction in blood flow induces a compensatory increase in cardiac output to maintain blood pressure [25], resulting in the observed increase in D* with net increased blood flow. To maintain fluid homeostasis, the kidney may also increase tubular trans-port, the resulting increase in oxygen consumption also contributing to the reduction in T2*. The decrease in the perfusion-insensitive ADC and D can be interpreted as a consequence of dehydration of the interstitial space.
Furosemide is a loop diuretic, inhibiting water reabsorp-tion in the nephron by blocking the sodium-potassium-chloride co-transporter in the ascending limb of the loop of Henlé. The rapid and significant increase in T2* seen herein is consistent with previous reports and the known effects of furosemide on reducing renal blood volume and decreasing oxygen consumption [14, 26, 27]. A reduction in perfusion fraction in the renal cortex was also observed, suggesting a reactive decrease in vascular flow, and also consistent with a reduction in blood volume. Interestingly, the perfusion-insensitive ADC Fig. 4Sensitivity of diffusion-weighted imaging parameters. Individual ladder plots (grey) and cohort means (black) for diffusion parameters derived from whole kidney ROIs, determined prior to and following administration of hydralazine, furosemide or angiotensin II
Fig. 5Repeatability measurements show parameter stability.
Functional T2* maps (overlaid on TE = 5 ms image) for whole kidney
(a) with no intervention showing measurement repeatability, andb)
and D significantly increased, consistent with an in-crease in renal water content within the tubules due to diuretic effects. This contrasts with previous stud-ies showing either no change, or a reduction in renal water diffusivity, in response to furosemide [14, 28].
Angiotensin II is a naturally-occurring hormone with a complex role within the renal renin-angiotensin system (RAS) [29]. The hormone has a direct effect on the proximal tubules to increase Na+ reabsorption, and has a convoluted and variable effect on glomerular filtration and renal blood flow. Increases in systemic blood pres-sure will maintain renal perfusion prespres-sure; however, constriction of the afferent and efferent glomerular arte-rioles can reduce renal blood flow. The effect on the ef-ferent arteriolar resistance tends to increase glomerular capillary hydrostatic pressure and maintain glomerular filtration rate. In the present study, the initial reduction in T2* is consistent with an acute reduction in blood vol-ume and tissue oxygenation, the suggestion of a recovery towards baseline may reflect a reactive response to drug-induced vasoconstriction. A similar transient T2* re-sponse to angiotensin II has been reported in human kidney [30]. The DWI data revealed no significant changes, which supports the concept of an acute effect-ive homeostatic response, and the absence of any vascu-lar response in the IVIM parameters.
Animal welfare and ways of reducing animal usage is an important consideration for all research bioscientists; non-invasive and longitudinal imaging methods that in-corporate repeatability measurements can reduce the number of animals by using each as its own control, har-nessing statistical power through the use of paired statis-tical tests in small animal cohorts, and information that may relate better to that observed in clinical assessment of therapy efficacy. Clinical MRI scanners are being increasingly used for pre-clinical imaging studies. Com-pared to relatively expensive dedicated small-bore ani-mal MRI systems, major vendors sell and distribute far more clinical scanners; consequences of this include the continuing development and availability of superior hardware and standardised pulse sequences on these platforms. Pre-clinical studies performed on clinical plat-forms also provide evidence supporting the clinical rele-vance of advanced diffusion modelling and data acquisition. Most clinical scanners operate at between 1.5 and 3 Tesla, and thus have lower signal-to-noise (SNR) levels than pre-clinical systems, with reduced image quality if conventional clinical imaging coils are used. This is exacerbated particularly when imaging the small fields-of-view necessary when using rodents, but with a high enough resolution to be able to acquire meaningful functional data. One approach for increasing SNR is to use small, dedicated receiver coils, such as the TMJ coil used herein, designed to fit closely to the
object of interest, giving a better coupling between the object and coil with a corresponding increase in signal and thus improved image quality [31]. Here we have shown the sensitivity and stability of parallel imaging using standard vendor coils on a clinical 1.5T MR system for conducting rodent renal studies, and demonstrate the sensitivity of resulting DWI and BOLD MRI biomarkers to the effects of several vasomodulators. This experimen-tal arrangement extends the available scope for perform-ing pre-clinical studies with existperform-ing clinical hardware, and confers the advantages associated with increased access to clinical scanners for pre-clinical studies.
Some limitations in this study are clear. Firstly, due to the voxel size achievable on clinical 1.5T MR systems, we were limited in our ability to reliably draw smaller ROIs to interrogate regions within the kidney that may contain differential vascular/tubular components, and this was particularly true for DWI where signal is ac-tively attenuated by the sensitising gradients. Hence, analysis was necessarily made over larger regions to en-sure adequate image SNR. Secondly, the dynamic im-aging protocol precluded the use of other complex invasive measurements to provide additional validation of our observations against other physiological measures over the experimental period.
Conclusions
We have shown that IVIM DWI and T2* measurements are feasible on a 1.5T clinical MR system to monitor the acute effects of vascular and tubular modulating drugs on rat kid-ney function in vivo. Water diffusion in kidkid-neys exhibits bi-exponential behaviour, with the fast diffusion component at low b-values reflecting both vascular and tubular flow. Multi-parametric MRI strategies combining IVIM DWI with T2* measurements allows mutual corroboration of pharmacological interventions. The administration of intra-venous hydralazine, furosemide, or angiotensin showed dif-ferential effects on IVIM DWI and BOLD MRI biomarkers in vivo, and highlights the potential of these techniques to study the effects of drugs that modulate renal function in humans, so as to better understand their treatment effects in patients with renal dysfunction.
Additional file
Additional file 1:ARRIVE Checklist. (DOCX 42 kb)
Abbreviations
ADC:Apparent diffusion coefficient; ANOVA: Analysis of variance;
Funding
We acknowledge the CR-UK support to the Cancer Imaging Centre at ICR and RMH in association with MRC & Department of Health C1060/A10334, C1060/A16464, C7809/A10342, NHS funding to the NIHR Biomedicine Research Centre and the Clinical Research Facility in Imaging.
Availability of data and materials
The datasets supporting the conclusions of this article are held in the Institutional Data repository and will be made available on request.
Authors’contributions
NPJ, JKRB, DJC, DMK, and SPR designed the study, collected the MR data, and drafted the manuscript. NPJ, JKRB, and SPR were responsible for animal welfare
and monitoring. NPJ, JAd’A, MRO, and DJC conducted analysis and statistical
assessment of the data. MOL, DMK, and SPR revised and edited the manuscript for publication. All authors read and approved the final submission.
Competing interests
The authors declare that they have no competing interests.
Consent for publication Not applicable.
Ethics approval and consent to participate
This study was performed in accordance and approved by the Institute of
Cancer Research’s Animal Welfare and Ethical Review Board, the UK Home
Office Animals (Scientific Procedures) Act 1986, the United Kingdom National Cancer Research Institute guidelines for the welfare of animals in cancer research and the ARRIVE (animal research: reporting in vivo experiments) guidelines.
Author details
1
Cancer Research UK Cancer Imaging Centre, Division of Radiotherapy & Imaging, The Institute of Cancer Research, London SM2 5NG, UK.
2
Department of Radiology, Royal Marsden NHS Foundation Trust, Sutton, Surrey SM2 5PT, UK.
Received: 11 September 2015 Accepted: 26 September 2016
References
1. Basile D, Anderson M, Sutton T. Pathophysiology of Acute Kidney Injury.
Compr Physiol. 2012;2:1303–53.
2. Cowley AW, Mattson DL, Lu S, Roman RJ. The Renal Medulla and
Hypertension. Hypertension. 1995;25:663–73.
3. Priatna A, Epstein FH, Spokes K, Prasad PV. Evaluation of Changes in
Intrarenal Oxygenation in Rats Using Multiple Gradient-Recalled Echo
(mGRE) Sequence. J Magn Reson Imaging. 1999;846:842–6.
4. Prasad PV. Functional MRI of the kidney: tools for translational studies of
pathophysiology of renal disease. Am J Physiol Renal Physiol. 2006;290:F958–74.
5. Ebrahimi B, Textor SC, Lerman LO. Renal Relevant Radiology: Renal
Functional Magnetic Resonance Imaging. Cjasn. 2013;9:1–11.
6. Tsuda K, Murakami T, Sakurai K, Harada K, Kim T, Takahashi S, Tomoda K,
Narumi Y, Nakamura H, Izumi M, Tsukamoto T. Preliminary evaluation of the apparent diffusion coefficient of the kidney with a spiral IVIM sequence.
Nihon Igaku Hoshasen Gakkai Zasshi. 1997;57:19–22.
7. Yildirim E, Kirbas I, Teksam M, Karadeli E, Gullu H, Ozer I. Diffusion-weighted
MR imaging of kidneys in renal artery stenosis. Eur J Radiol. 2008;65:148–53.
8. Eisenberger U, Thoeny HC, Binser T, Gugger M, Frey FJ, Boesch C,
Vermathen P. Evaluation of renal allograft function early after transplantation with diffusion-weighted MR imaging. Eur Radiol. 2010;20:
1374–83.
9. Le Bihan D, Breton E, Lallemand D, Aubin M-L, Vignaud J, Laval-Jeantet M.
Separation of diffusion and perfusion in intravoxel incoherent motion MR
imaging. Radiology. 1988;168:497–505.
10. Koh D-M, Collins DJ, Orton MR. Intravoxel incoherent motion in body
diffusion-weighted MRI: reality and challenges. Am J Roentgenol. 2011;
196:1351–61.
11. Hollingsworth KG, Lomas DJ. Influence of perfusion on hepatic MR diffusion
measurement. NMR Biomed. 2006;19:231–5.
12. Sigmund EE, Vivier P-H, Sui D, Lamparello NA, Tantillo K, Rusinek H, Babb JS,
Storey P, Lee VS, Chandarana H. Intravoxel Incoherent Motion and Diffusion-Tensor imaging in renal Tissue under hydration and Furosemide Flow Challenges. Radiology. 2012;263:758.
13. Mcphail LD, Robinson SP. Intrinsic Susceptibility MR Imaging of Chemically
Induced Rat Mammary Tumors : Relationship to Histologic Assessment Purpose : Methods : Results . Radiology. 2010;254:110.
14. Pedersen M, Vajda Z, Stødkilde-Jørgensen H, Nielsen S, Frøkiaer J.
Furosemide increases water content in renal tissue. Am J Physiol Renal
Physiol. 2007;292:F1645–51.
15. Prasad PV. Evaluation of intra-renal oxygenation by BOLD MRI. Nephron Clin
Pract. 2006;103:c58–65.
16. Workman P, Aboagye EO, Balkwill F, Balmain A, Bruder G, Chaplin DJ, Double
JA, Everitt J, Farningham DAH, Glennie MJ, Kelland LR, Robinson V, Stratford IJ, Tozer GM, Watson S, Wedge SR, Eccles SA. Guidelines for the welfare and use
of animals in cancer research. Br J Cancer. 2010;102:1555–77.
17. Kilkenny C, Browne WJ, Cuthill IC, Emerson M, Altman DG. Improving
bioscience research reporting: The arrive guidelines for reporting animal research. PLoS Biol. 2010;8:e1000412.
18. Su MY, Wang Z, Roth GM, Lao X, Samoszuk MK, Nalcioglu O.
Pharmacokinetic changes induced by vasomodulators in kidneys, livers, muscles, and implanted tumors in rats as measured by dynamic
Gd-DTPA-enhanced MRI. Magn Reson Med. 1996;36:868–77.
19. Al-Merani SAMA, Brooks DP, Chapman BJ, Munday KA. The Half-Lives of
Angiotensin II, Angiotensin II-amide, Angiotensin III, Sar1-Ala8-Angiotensin II
and Renin in the circulatory system of the Rat. J Physiol. 1978;278:471–90.
20. Koh D-M, Collins DJ. Diffusion-weighted MRI in the body: applications and
challenges in oncology. Am J Roentgenol. 2007;188:1622–35.
21. Neil JJ, Bretthorst GL. On the Use of Bayesian Probability Theory for Analysis
of Exponential Decay Data: An Example Taken from Intravoxel Incoherent
Motion Experiments. Magn Reson Med. 1993;29:642–7.
22. Dyvorne HA, Galea N, Nevers T, Fiel MI, Carpenter D, Wong E, Orton M, de
Oliveira A, Feiweier T, Vachon M-L, Babb JS, Taouli B. Diffusion-weighted imaging of the liver with multiple b values: effect of diffusion gradient polarity and breathing acquisition on image quality and intravoxel
incoherent motion parameters–a pilot study. Radiology. 2013;266:920–9.
23. Gomez SI, Warner L, Haas JA, Bolterman RJ, Textor SC, Lerman LO, Romero
JC. Increased hypoxia and reduced renal tubular response to furosemide detected by BOLD magnetic resonance imaging in swine renovascular
hypertension. Am J Physiol Renal Physiol. 2009;297:F981–6.
24. Kusakabe Y, Matsushita T, Honda S, Okada S, Murase K. Using BOLD imaging
to measure renal oxygenation dynamics in rats injected with diuretics.
Magn Reson Med Sci. 2010;9:187–94.
25. Cogan JJ, Humphreys MH, Calson CJ, Rapaport E. Renal effects of
nitroprusside and hydralazine in patients with congestive heart failure.
Circulation. 1980;61:316–23.
26. Li L-P, Vu AT, Li BSY, Dunkle E, Prasad PV. Evaluation of intrarenal
oxygenation by BOLD MRI at 3.0 T. J Magn Reson Imaging. 2004;20:901–4.
27. Li LP, Storey P, Pierchala L, Li W, Polzin J, Prasad P. Evaluation of the
Reproducibility of Intrarenal R2* and ??R2* Measurements Following Administration of Furosemide and during Waterload. J Magn Reson
Imaging. 2004;19:610–6.
28. Ries M, Basseau F, Tyndal B, Jones R, Deminière C, Catargi B, Combe C,
Moonen CWT, Grenier N. Renal diffusion and BOLD MRI in experimental diabetic nephropathy. Blood oxygen level-dependent. J Magn Reson
Imaging. 2003;17:104–13.
29. Raizada V, Skipper B, Luo W, Griffith J. Intracardiac and intrarenal
renin-angiotensin systems: mechanisms of cardiovascular and renal effects. J Investig Med. 2007;55:341.
30. Schachinger H, Klarhöfer M, Linder L, Drewe J, Scheffler K. Angiotensin II
decreases the renal MRI blood oxygenation level-dependent signal.
Hypertension. 2006;47:1062–6.
31. Linn J, Schwarz F, Schichor C, Wiesmann M. Cranial MRI of small rodents