Article
1
Experimental Study on Improvement of Performance by
2
Wave Form at Cathode Channels in PEM Fuel Cell
3
4
Sun-Joon Byun 1, Zhen Huan Wang2 Jun Son2, Young-Chul Kwon 3,* and Dong-Kurl Kwak 4,*
5
1 SFR NSSSS System Design Division, Korea Atomic Energy Research Institute, 111 Daedeok-daero 989
6
beon-gil, Yuseong-gu, Daejeon 34057, Republic of Korea; [email protected] (S. -J.B)
7
2 Graduate student, Department of Mechanical Engineering, Sunmoon University,70 sunmoon-ro 221
beon-8
gil, Tangjeong-myeon, Asan-si, Chungcheongnam-do 31460, Republic of Korea;
[email protected](H.-9
J.K.), [email protected](Z.-H.W), [email protected](J.S)
10
3 Department of Mechanical Engineering, Sunmoon University,70 sunmoon-ro 221 beon-gil,
Tangjeong-11
myeon, Asan-si, Chungcheongnam-do 31460, Republic of Korea; [email protected] (Y.-C.K)
12
4 Graduate School of Disaster Prevention, Kangwon National University, 346 joongang-ro, samcheck-si,
13
Gangwon-do 25913, Republic of Korea; [email protected] (D.-K.K)
14
15
* Correspondence: [email protected] (Y. –C. Kwon); Tel.: +82-41-530-2396;
16
[email protected] (D. –K. Kwak); Tel.: +82-33-570-6823.
17
Abstract: We propose a wave-like design on the surface of cathode channels (wave form cathode channels) to
18
improve oxidant delivery to gas diffusion layers (GDLs) [1-2]. We performed experiments using PEMFCs
19
combined with wave form surface design on cathodes. We varied the factors of the distance between
wave-20
bumps (the Adhesive distance, AD), and the size of the wave-bumps (the Expansion ratio, ER). The ADs are 3,
21
4, and 5 times the size of the half-circle bump’s radius, and the ERs are 1/1.5, 1/2, and 1/3 times the channel’s
22
height. We evaluated the performances of the fuel cells, and compared the current-voltage (I-V) relations. For
23
comparison, we prepared PEMFCs with conventional flat-surfaced oxygen channels. Our aim in this work is
24
to identify fuel cell operation by modifying the surface design of channels, and ultimately to find the optimal
25
design of cathode channels that will maximize fuel cell performance.
26
27
Keywords: Wave form, PEMFC, Cathode channel, Gas diffusion layer (GDL), Adhesive distance
28
(AD), Expansion ratio (ER)
29
30
31
Nomenclature
32
F Force, N
33
T Temperature, ℃
34
RH Relative Humidity, %
35
Q Flow rate, kg/s
36
T Time
37
P Operating Pressure, kPa
38
W Work
39
u Velocity component, m/s
40
R Radius, m
41
V Voltage, V
42
CD Current density, A/cm3
43
GDL Gas Diffusion Layer
44
MEA Membrane Electrode Assembly
45
46
Greek symbols
47
Stoichiometry48
Density, kg/m349
Surface tension, N/m50
51
Subscripts
52
a Air
53
g Gas
54
act Activation
55
sat Saturated
56
c Cell
57
gen Generating force
58
adh Adhesion
59
r Radiation
60
in Inlet
61
out Outlet
62
h Hydrostatic
63
fore Force contact angle
64
1. Introduction
65
Most of the energy we use is obtained from fossil fuels. However, reserves of fossil fuels will
66
soon reach their limits. Also, the problems of environmental pollution and climate change due to
67
fossil fuel usage have raised the need to develop new energy sources. Thus, study on developing
68
various renewable energy sources is being conducted. The South Korea government is also actively
69
supporting the development of various renewable energy resources. Energy alternatives, including
70
wind energy, solar cells, and fuel cells, are under development. In fuel cell research, researchers are
71
addressing flow field patterns to supply fuel and oxygen more effectively. Since the internal structure
72
in a fuel cell cannot be directly observed, measurement is difficult.
73
So, research combining computational analysis with experimentation is active. Looking at some
74
of the leading research, Springer et al. [3] conducted experiments using Nafion 117 membrane to
75
observe various phenomena, including the electro-osmotic drag phenomenon, and presented
76
parameters of membranes in constant humidity condition, using equations based on the values
77
obtained from their experiments. Natarajan and Nguyen [4] suggested a numerical analysis method
78
of fuel cell flow regarding 2 phase flow, and verified that the fuel cell performance improved in
79
thinner Gas diffusion layer (GDL) and higher porosity. Yoon et al. [5] conducted experiments varying
80
the PEMFC Rib thickness and channel form. Variance of fuel cell performance according to rib width
81
was observed, due to its effect on fuel and air diffusion. Fuel cell performance was improved with
82
smaller rib width, because the diffusion of gas to electrode was improved. Kuo et al. [6-8] conducted
83
three-dimensional numerical analysis regarding velocity and temperature distribution in the PEMFC
84
channel using wave-like and ladder-like surfaces, thus comparing the current density (CD) with that
85
of the normal surface, to improve performance.
Li and Sabir [9] introduced the separation plate design and latest flow path design made by
87
various research institutions. Also problems were identified, and several suggestions were made
88
regarding the optimization of each channel pattern. Su et al. [10] analyzed the fuel cell performance
89
of a straight channel pattern and the S-shaped pattern of a serpentine channel for PEMFC, through
90
three-dimensional computational analysis and experiment. The channel with S-shaped serpentine
91
patterns showed higher mass transfer performance than the channel with straight pattern. Perng and
92
Wu [11] compared fuel cell performance through computational analysis of flow field characteristics
93
in the catalyst layer surface and inside channel, using different forms in the GDL of PEM fuel cells.
94
In addition, they varied the number of forms, to compare the flow characteristics and fuel cell
95
performance [12].
96
This study suggests design factors of the amplitudes and pitches of waves, to effectively improve
97
the catalysis reaction performance in the catalyst layer, and verifies the effectiveness of this method,
98
by evaluating the performance of the PEM fuel cell. This study provides the design factors and
99
conditions that are necessary for improving the performance of the PEM fuel cell, as information for
100
determining the optimized design of the cathode channel of the PEM fuel cell.
101
The purpose of this study is to suggest contemporary alternatives to reduce the concentration
102
loss. For this reason, we examined the performance according to variations of the heights and
103
distances of the wave form, and the changes of variations induced by the suppression of
104
concentration loss. We fabricated the optimized channel, which was verified by experiment, as a unit
105
cell of the PEM fuel cell, to compare the performance of the optimized channel with those of other
106
channels.
107
108
2. Theoretical Background
109
2.1.Polarization curve
110
Equation (1) demonstrates three voltage losses. First, activation loss depends on the activation
111
levels of the electrochemical reactions. Ohmic loss is the resistance loss induced by the unique
112
resistances of the components of the fuel cell. Concentration loss occurs when the reaction rates of
113
hydrogen and oxygen are faster than their supply rates.
114
115
thermo act ohmic conc
V E (1)
116
117
Among these, mass transfers of hydrogen and oxygen occur during concentration loss through
118
the GDLs in the channels. The GDLs have low permeability, and minimal convection effects [13].
119
In Figure 1, *
R
c and c*P represent the catalyst layer reactant and product concentrations,
120
respectively, and 0
R
c and c0P represent the bulk reactant and product concentration, respectively.
121
represents the thickness of the GDLs. The fuel cell begins producing current at timet
0
. Starting122
from constant initial values ( 0
R
c and cP0), the reactant and product concentration profiles evolve
123
with increasing time, as shown for t1 t2 t3. Eventually, the profiles approach a steady-state
124
balance, where concentration varies linearly with distance across the diffusion layer. The diffusion
125
flux created according to this linear concentration gradient in the steady-state accurately balances in
126
the catalyst layer. Eq. (2) defines this balance.
127
128
diff
j
nFJ
(2)129
Here,
j
is the CD in the fuel cell, andJ
diff is the diffusion flux of a reactant transferred to the130
catalyst layer.
J
diff is defined as in Equation (3).diff
dc
J D
dx
(3)
132
The steady-state of this equation is defined as Equation (4).
133
134
* 0
eff R R
diff
c c
J D
(4)
135
136
The diffusion flux of a reactant according to CD in the steady-state can be calculated by
137
substituting Equation (4) into Equation (2).
138
139
* 0
eff cR cR
j nFD
(5)
140
* 0
R R eff
j c c
nFD
(6)
141
142
Here, 0
R
c is always less than *
R
c , and the consumption rate of a reactant increases as
j
143
increases, leading to a concentration loss in the area of high-CD. The
j
value becomes greatest when144
* 0 R R
c c is zero, which is called the limiting CD [14].
145
146
147
t3 t2
t1 t3
t2 t1
C
o
n
ce
n
tr
a
ti
o
n
Flow Channel
Anode electrode
Catalyst layer
C0 R
C0 p
t=0
t=0
t
t
C* p
C* R
148
Figure 1.Schematic variation of a fuel cell reactant and product concentration according to time [14].
149
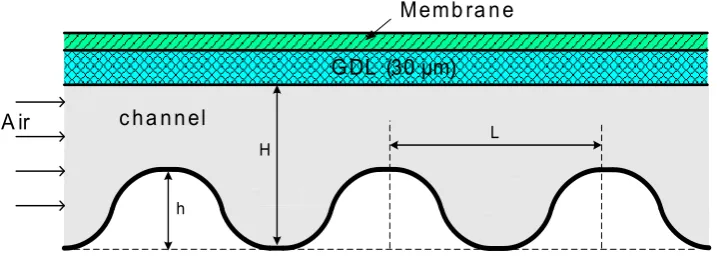
2.2. Factors for displacement in the wave form channels
150
In order to reduce concentration loss in the area of high CD, alternatives to improve mass
151
transfers are suggested in this study. The bottoms of the channels were fabricated to have a wave
152
shape, to create a greater flow velocity gradient in the GDLs, and to suppress the concentration loss
153
induced by unstable mass transfers, in order to improve the performance of the fuel cell.
154
The amplitudes and pitches of the waves determine the pattern of wave channels [15], as shown
155
in Figure 2. The ER is defined as the ratio of the channel height to the channel amplitude, and the AD
156
is defined as the ratio of the pitch (the distance between one crest and the following crest) to the
157
amplitude.
/
ER
H h
(7)160
161
AD
L h
/
(8)162
163
In order to verify the effect of the ER and AD, the effect of the variance of AD is considered.
164
165
166
Memb ra n e
GDL (30μm)
A ir c ha n n el
h
H L
167
Figure 2. The parameters of a wave form channel.
168
3. Experimental Method
169
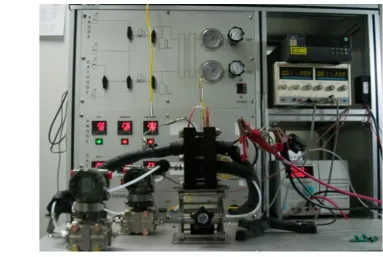
3.1. Experimental apparatus
170
The efficiency of the PEMFC is affected by the stoichiometry at the cathode, temperature of the
171
cell outlet, pressure difference between the inlet and outlet of the cell, and channel depth [16]. To
172
block the drying effect caused by high-temperature air, the PEMFC humidifies all of the air and
173
hydrogen, before they are supplied to the unit cell. This type of water produced by the
electro-174
chemical reaction induces channel flooding. To determine the effects of stoichiometry, temperature
175
of the cell outlet, and differential pressure on flooding, an experimental apparatus was set up, as
176
shown in Figure 3. A mass flow controller (MFC) adjusted the flow rates of air and hydrogen, and
177
passed the adjusted flow rate of air and hydrogen through each humidifier, to maintain the
178
appropriate humidity. By controlling the humidifier temperature, the relative humidity at the inlet
179
was maintained at an appropriate level.
180
Figure 4 shows a schematic of the fuel cell experimental apparatus. The flow rate and relative
181
humidity of reactant gases controlled by the MFC and the humidifier must maintain appropriate
182
temperatures before they enter the unit cell. To maintain the fixed temperature of the humidified air
183
and hydrogen, a line heater was placed at the entrance of the cell. The fixed temperature of reactant
184
gases controlled by the line heater can vary from heat transfer within the unit cell. To prevent such
185
changes, a heater was inserted into the unit-cell endplate, and a thermocouple was placed in the
186
bipolar plate, to maintain the bipolar temperature of the unit cell. To measure the inlet temperature
187
and outlet temperature of the cell, T-type thermocouples were inserted at the inlet and outlet of the
188
cell. The inlet pressure and the outlet pressure were measured by a pressure transducer installed at
189
the inlet, and a differential pressure transducer installed at the outlet of the cell, respectively. Data
190
received from the pressure transducer, differential pressure transducer, and thermocouple were
191
recorded by a channel recorder (fluke), and transmitted to the computer by the network connection
192
process.
196
Figure 3.Experimental apparatus of the fuel cell system.
197
198
199
200
Figure 4. Parameters of a wave form channel.
201
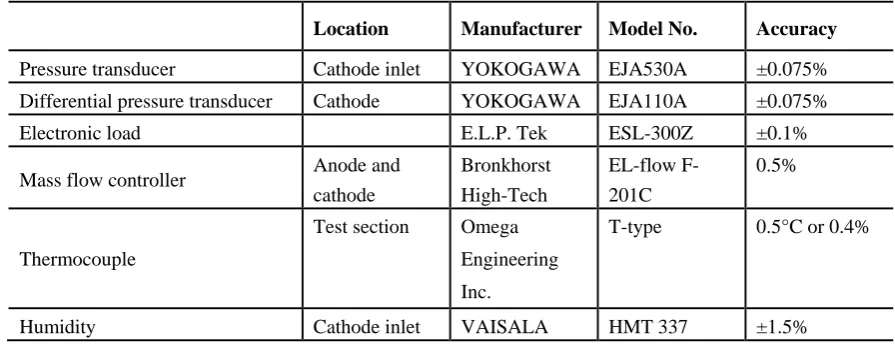
A differential pressure transducer (Model-EJA110A, Yokogaya Co.) and pressure transducer
202
(Model-EJA530A, Yokogaya Co.) were used for measurement. The accuracy of the devices was ±0.075
203
per cent. A 1 l/5 l mass flow meter was used to control the flow rate of the anode and cathode. An
204
electronic load (model ESL-300Z, E.L.P. Tek Co.) was used to power the experiment on the fuel cell
205
system: the maximum power was 300W, and maximum electric current was 60A. Experiments could
206
be carried out at a fixed electric current, fixed voltage, and fixed reaction, with an accuracy of ±0.1%.
207
Using an exterior signal, we could simulate the unit-cell response feature and output feature. The
208
specifications of the experimental device are similar to those shown in Table 1.
Table 1. Specifications of the measurement devices
211
Location Manufacturer Model No. Accuracy
Pressure transducer Cathode inlet YOKOGAWA EJA530A ±0.075%
Differential pressure transducer Cathode YOKOGAWA EJA110A ±0.075%
Electronic load E.L.P. Tek ESL-300Z ±0.1%
Mass flow controller Anode and
cathode
Bronkhorst High-Tech
EL-flow F-201C
0.5%
Thermocouple
Test section Omega
Engineering
Inc.
T-type 0.5°C or 0.4%
Humidity Cathode inlet VAISALA HMT 337 ±1.5%
212
3.2. Experimental conditions
213
To measure fuel cell performance, the apparatus was stabilized for 30 minutes in steady state,
214
where humidity, temperature and pressure were maintained constant at the inlet and outlet. The
215
temperature and pressure at the inlet and outlet, relative humidity, unit cell temperature, and open
216
circuit voltage were measured every 1 second. Relative humidity in the unit cell was controlled by
217
controlling the humidifier temperature, and the relative humidity of the humidified air was
218
measured with a hygrometer installed at the cathode inlet.
219
To operate the unit fuel cell with an operational temperature of 50°C, the unit cell temperature
220
was set to 54°C, so the inlet and outlet temperature were maintained constant for 30 minutes, before
221
the actual measurement. If the calculated humidity and the relative humidity measured by
222
hygrometer differed, the humidifier temperature was adjusted to achieve the desired relative
223
humidity. During the experiment, the relative humidity was maintained at 50%, 75%, and 90%,
224
respectively, and the error range was maintained within ±0.2%.
225
In this study, pure hydrogen gas and compressed air were used, with stoichiometry of 1.5 pure
226
hydrogen, and 2.0 compressed air, respectively. The variance of fuel cell performance was observed
227
for both cases of fixed pure hydrogen stoichiometry and varied air stoichiometry, and fixed air
228
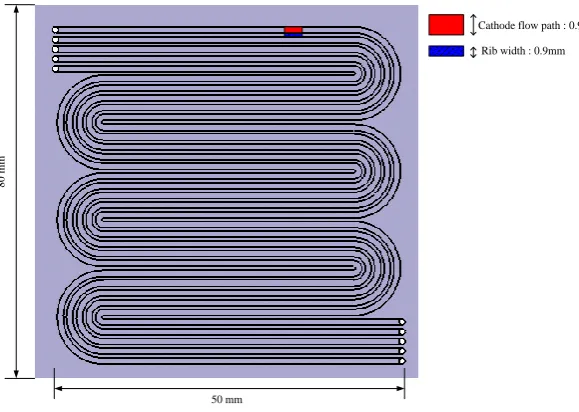
stoichiometry and varied pure hydrogen stoichiometry. Figure 5 shows a view of the channel shape
229
used in the unit cell performance experiment. The basic channel shape was a serpentine 5 channel, of
230
total area 50 mm ⅹ 50 mm, and separation plate area of 80ⅹ80 mm. To make the diffusion of reaction
231
gases faster, the rib width was 0.5 mm, so it had as small a value as possible, and the channel width
232
was 0.9 mm.
233
Thus, as shown in Figure 2, this study varied the design parameters ER and AD of the wave
234
form channel, to produce the cathode channel shapes shown in Figure 6 and Figure 7.
4. Results and Discussion
238
4.1. Fuel cell performance variation according to the ER variation
239
240
8
0
m
m
50 mm
Cathode flow path : 0.9mm Rib width : 0.9mm
241
Figure 5. Schematic of the unit-cell channel shape.
242
243
244
245
(a) ER 1.5
(b) ER 2.0 (c) ER 3.0
247
Figure 6. Bipolar plates of the gas flow cathode channels with the three wave form ERs.
248
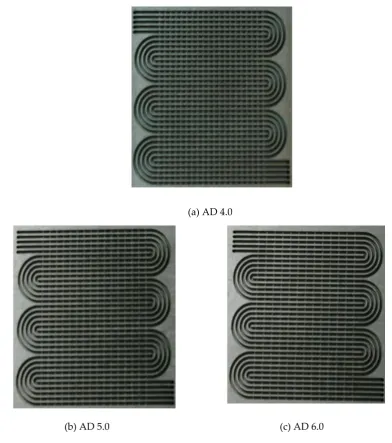
249
(a) AD 4.0
250
(b) AD 5.0 (c) AD 6.0
251
Figure 7. Bipolar plates of the gas flow cathode channels with the three wave form ADs.
252
253
The fuel cell performance in the normal cathode channel of width and height 0.9 mm ⅹ 0.9 mm,
254
with aspect ratio 1, was compared with that of the wave form channel where the ER varied between
255
1.5, 2.0, and 3.0. The conditions for the fuel cell performance experiment were fuel cell reaction gas
256
temperature of 50˚C, relative humidity of 75%, fuel side stoichiometry of 1.5, and cathode side
257
stoichiometry of 2.0.
258
Figure 8 shows the fuel cell performance according to variation of the Expansion ratio (ER). In
259
the normal channel, the maximum power output was around 11.9W, while the improvements of
260
maximum power output in the wave form channel were around 21% for ER 1.5, 20% for ER 2.0, and
261
6% for ER 3.0. The cause of this improvement in maximum power output was the high air
262
concentration maintained at the catalyst layer and GDL. In the high CD region between CD 0.8 ~ CD
263
1.4, the normal channel shows a rapid decrease of power output at CD 1.2, while the wave form
channel shows a sluggish decrease of power output. This sluggish decrease is caused by reduction of
265
concentration loss.
266
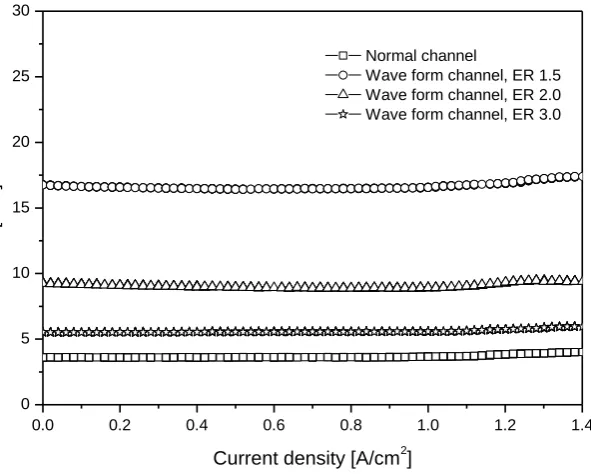
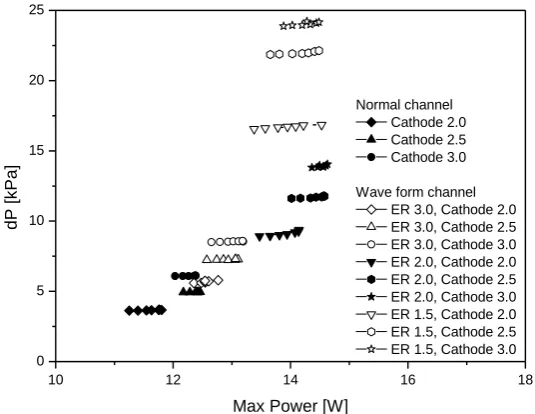
Figure 9 shows the pressure difference between inlet and outlet in the unit cell. The wave form
267
channel shows a higher pressure difference, compared to that of the normal channel. The fuel cell
268
performance in wave form channels ER 1.5 and ER 2.0 are similar, but rapid pressure increase is
269
observed in ER 1.5. The rapid increase in pressure contributes to overall loss in the system, and
270
demands higher apparatus durability.
271
0.0 0.2 0.4 0.6 0.8 1.0 1.2 1.4 0.0
0.2 0.4 0.6 0.8 1.0
C
e
ll
vo
lt
a
g
e
[
V]
Pow
e
r
d
e
n
si
ty
[W
/cm
2 ]
Current density [A/cm2]
Normal channel
Wave form channel, ER 1.5 Wave form channel, ER 2.0 Wave form channel, ER 3.0
0.0 0.2 0.4 0.6
272
Figure 8. Bipolar plate of gas flow cathode channel with wave form AD.
273
0.0 0.2 0.4 0.6 0.8 1.0 1.2 1.4
0 5 10 15 20 25 30
d
P
[kPa]
Current density [A/cm2]
Normal channel
Wave form channel, ER 1.5 Wave form channel, ER 2.0 Wave form channel, ER 3.0
Figure 9. Unit cell difference curve in the normal channel and wave form channel, according to the
275
variation in ER.
276
277
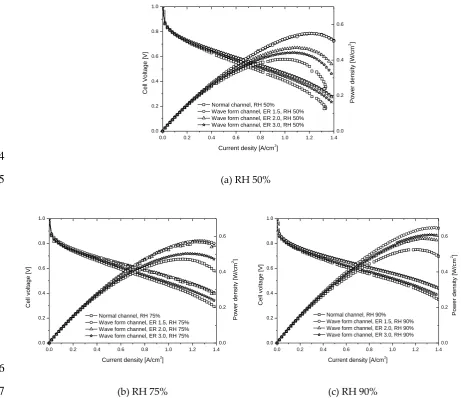
Figure 10 shows the fuel cell performance curves according to variation in the relative humidity.
278
Figure 10(a) shows the performance curves of the normal channel and wave form channel with
279
various ER, with Relative Humidity (RH) of 50%. As the ER increases, the unit cell performance with
280
respect to maximum power output increases by around 7 ~ 15%. In the high CD region with CD over
281
1.2, the power density and cell voltage were unstable in the normal channel, but showed a stable
282
trend in the wave form channel. Figure 10(b) shows an insignificant difference in performance
283
between ER 2.0 and ER 1.5 with relative humidity 75%, and the unit cell pressure difference increases
284
greatly, as ER increases. Figure 10(c) shows the fuel cell performance of the wave form channel
285
increases by about 8 ~ 17%, compared to the normal channel, in RH 90, and the performances are
286
similar in ER 2.0 and ER 1.5. Thus, in the wave form channels, the maximum power density and high
287
CD increase, as the relative humidity increases. Low concentration and mass transport of catalyst
288
reactants in high CD are overcome by changing the flow inside the channel, by applying the wave
289
form channel, thus resulting in improvement of fuel cell performance.
290
Figure 11 shows the pressure difference inside the normal channel and wave form channel, with
291
varied ER. But after a certain increase of ER, the fuel cell performance is not much influenced, and
292
we predict that increase of the internal pressure might cause system instability.
293
0.0 0.2 0.4 0.6 0.8 1.0 1.2 1.4 0.0 0.2 0.4 0.6 0.8 1.0 Pow e r d e n si ty [W /cm 2 ] C e ll Vol ta g e [ V]
Current desity [A/cm2
]
Normal channel, RH 50% Wave form channel, ER 1.5, RH 50% Wave form channel, ER 2.0, RH 50% Wave form channel, ER 3.0, RH 50%
0.0 0.2 0.4 0.6
294
(a) RH 50%
295
0.0 0.2 0.4 0.6 0.8 1.0 1.2 1.4 0.0 0.2 0.4 0.6 0.8 1.0 C e ll vo lt a g e [ V] Pow e r d e n si ty [W /cm 2]
Current density [A/cm2
]
Normal channel, RH 75% Wave form channel, ER 1.5, RH 75% Wave form channel, ER 2.0, RH 75% Wave form channel, ER 3.0, RH 75%
0.0 0.2 0.4 0.6
0.0 0.2 0.4 0.6 0.8 1.0 1.2 1.4 0.0 0.2 0.4 0.6 0.8 1.0 Pow e r d e n si ty [W /cm 2] C e ll vo lt a g e [ V]
Current density [A/cm2
]
Normal channel, RH 90% Wave form channel, ER 1.5, RH 90% Wave form channel, ER 2.0, RH 90% Wave form channel, ER 3.0, RH 90%
0.0 0.2 0.4 0.6
296
(b) RH 75% (c) RH 90%
Figure 10. Performance curve of the normal channel and wave form channel, according to variation
298
in ER at constant relative humidity.
299
8 10 12 14 16 18 20
0 5 10 15 20 25
d
P
[kPa]
Max Power [W]
Normal channel RH 50% RH 75% RH 90%
Wave form channel ER 3.0, RH 50% ER 3.0, RH 75% ER 3.0, RH 90% ER 2.0, RH 50% ER 2.0, RH 75% ER 2.0, RH 90% ER 1.5, RH 50% ER 1.5, RH 75% ER 1.5, RH 90%
Figure 11. Pressure difference between the normal channel and wave form channel, with varied ER.
0.0 0.2 0.4 0.6 0.8 1.0 1.2 1.4 0.0
0.2 0.4 0.6 0.8 1.0
C
e
ll
vo
lt
a
g
e
[
V]
Current density [A/cm2
] Normal channel
Cathode 2.0 Cathode 2.5 Cathode 3.0
0.0 0.2 0.4 0.6
Pow
e
r
d
e
n
si
ty
[W
/cm
2]
300
(a) Normal channel
301
0.0 0.2 0.4 0.6 0.8 1.0 1.2 1.4 0.2
0.4 0.6 0.8 1.0
C
e
ll
vo
lt
a
g
e
[
V]
Current density [A/cm2] Wave form channel, ER 2.0
Cathode 2.0 Cathode 2.5 Cathode 3.0
0.0 0.2 0.4 0.6
Pow
e
r
d
e
n
si
ty
[W
/cm
2]
302
(b) Waveform channel, ER 2.0
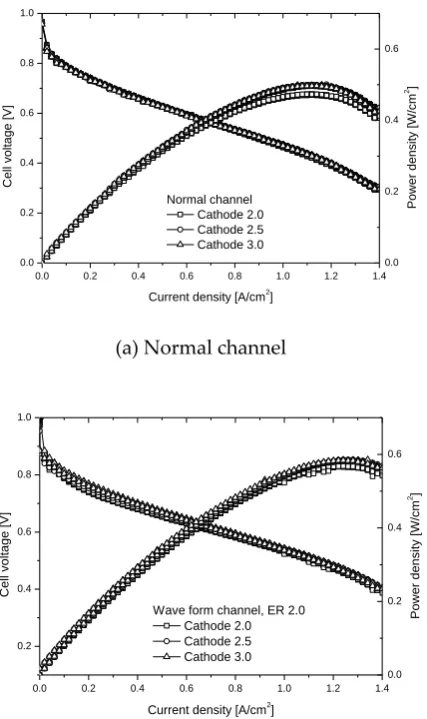
Figure 12. Pressure curve according to variation in stoichiometry at cathode of the normal channel
304
and wave form channel
305
Figure 12 shows the fuel cell performance according to cathode stoichiometry variation. With
306
stoichiometry of 1.0, the supply of reactant at the outlet is insufficient, due to the reactant gas reaction;
307
thus, the reactant gas must be supplied to the fuel cell at an excessive rate, compared to the exact
308
reacting amount, due to various losses.
309
This study conducted the fuel cell performance experiment with anode stoichiometry of 1.5, ER
310
2.0, and fixed RH of 75%. The cathode stoichiometry varied between 2.0, 2.5, and 3.0, in the normal
311
channel and wave form channel.
312
In Figure 12(a), the performances under CD 0.8 do not vary much, due to increases in the cathode
313
stoichiometry. But in high CD over 1.0, the differences are noticeable. The results suggest cathode
314
stoichiometry of 2.0 is sufficient in the low CD region, while in the high CD region, the reactant
315
supply is not fluent, due to concentration loss, thus yielding no increases in fuel cell performance
316
when the stoichiometry is increased.
317
Figure 12(b) shows the fuel cell performance of wave form channel ER 2.0, as the cathode
318
stoichiometry varies. Increasing the wave form channel cathode stoichiometry yielded a 2% increase,
319
compared to the maximum power density. The result indicates sufficient reactant supply was
320
achieved in the catalyst layer and GDL of the wave form channel.
321
322
Figure 13 shows the pressure difference of the wave form channel and normal channel,
323
according to the change of cathode stoichiometry. The wave form channel shows higher performance
324
compared to the normal channel, and ER 1.5 and ER 2.0 show similar performance, but high pressure
325
difference is observed in the case of ER 1.5. Thus it can be deduced that a fuel cell system stability
326
problem and internal resistance loss can arise, when high pressure difference occurs.
327
328
4.2. AD variation and fuel cell performance
329
We varied the wave form channel design parameter AD during the experiment, to select the
330
optimal AD, by comparing the performance with that of the normal channel. ER is fixed during the
331
experiment. The size of ER is related to the increase of reactant internal flow at the catalyst layer and
332
10 12 14 16 18
0 5 10 15 20 25
d
P
[kPa]
Max Power [W]
Normal channel Cathode 2.0 Cathode 2.5 Cathode 3.0
Wave form channel ER 3.0, Cathode 2.0 ER 3.0, Cathode 2.5 ER 3.0, Cathode 3.0 ER 2.0, Cathode 2.0 ER 2.0, Cathode 2.5 ER 2.0, Cathode 3.0 ER 1.5, Cathode 2.0 ER 1.5, Cathode 2.5 ER 1.5, Cathode 3.0
333
Figure 13. Pressure difference of the normal channel and wave form channel with varied ER,
334
according to variation in the cathode stoichiometry.
336
0.0 0.2 0.4 0.6 0.8 1.0 1.2 1.4 0.0
0.2 0.4 0.6 0.8 1.0
C
e
ll
vo
lt
a
g
e
[
V]
Current density [A/cm2]
Normal channel
Wave form channel, ER 2.0, AD 4.0 Wave form channel, ER 2.0, AD 5.0 Wave form channel, ER 2.0, AD 6.0
0.0 0.2 0.4 0.6
Pow
e
r
d
e
n
si
ty
[W
/cm
2 ]
337
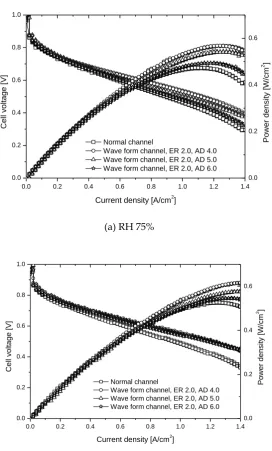
(a) RH 75%
338
0.0 0.2 0.4 0.6 0.8 1.0 1.2 1.4 0.0
0.2 0.4 0.6 0.8 1.0
C
e
ll
vo
lt
a
g
e
[
V]
Current density [A/cm2]
Normal channel
Wave form channel, ER 2.0, AD 4.0 Wave form channel, ER 2.0, AD 5.0 Wave form channel, ER 2.0, AD 6.0
0.0 0.2 0.4 0.6
Pow
e
r
d
e
n
si
ty
[W
/cm
2 ]
339
(b) RH 90%
340
Figure 14. Pressure difference of the normal channel and wave form channel with varied ER,
341
according to variation in the cathode stoichiometry.
342
343
GDL inside the channel, while AD reattaches the distance maintained at a certain value, so that the
344
channel internal flow is prevented from steady-state, thus increasing the reactant flow. The
345
experimental conditions in this study were anode stoichiometry of 1.5, cathode stoichiometry of 2.0,
346
operating temperature of 50˚C, and ER of 2.0.
347
Figure 14 shows performance curves of the normal channel and wave form channel with varied
348
AD. As the AD distance increases, the improvement of performance compared to the normal channel
349
decreases. This indicates the mass transport of reactants decreases, as the wave form distance
350
increases. Also, the increase of relative humidity contributes to improvement in the fuel cell
351
performance. We conducted experiments in the wave form channel by varying the ER and AD, to
352
determine the optimal wave form channel shape for ER 2.0 and AD 4.0.
0 5,000 10,000 15,000 20,000 25,000 30,000 35,000 2.5
2.6 2.7 2.8 2.9 3.0
Normal channel
Wave form channel (ER 2.0, AD 4.0)
C
e
ll
vo
lt
a
g
e
[
V]
Time [sec]
355
(a) CD 0.8
356
0 5,000 10,000 15,000 20,000 25,000 30,000 35,000
1.5 2.0 2.5 3.0 3.5
C
e
ll
vo
lt
a
g
e
[
V]
Time [sec]
Normal channel
Wave form channel (ER 2.0, AD 4.0)
357
(b) CD 1.0
358
Figure 15. Performance curve of the normal channel and wave form channel operated for 10 hours,
359
at CD 0.8 and 1.0.
360
361
Figure 15 shows the results of the reliability experiment in high CD. Generally in the high CD
362
region, MEA degradation, Platinum catalyst poisoning, and the flooding phenomenon cause rapid
363
reduction of fuel cell performance.
364
Figure 15(a) shows the performance of the normal channel and ER 2.0, AD 4.0 wave form channel
365
at CD 0.8, during 10 hour operation. At CD value 0.8, both the normal channel and wave form channel
366
showed around 3% performance decrease, which is insignificant. But in the same CD, the power and
voltage varied more in the wave form channel, than in the normal channel. This indicates the wave
368
form channel is more reliable than the normal channel.
369
Figure 15(b) shows the time-wise fuel cell performance variation in the normal channel and wave
370
form channel, with CD value 1.0. The performance in all channels is lower than that of CD of value
371
0.8. Also, the power and voltage variations are greater in the normal form channel, than in the wave
372
form channel at the same CD. But as time passes, the wave form channel shows stable values, while
373
the normal channel shows great decrease after 6 hours. After 10 hours of operation, the voltage in the
374
normal channel reduces by 0.12 V, and the performance reduces by around 28%; while in the wave
375
form, the voltage reduces by 0.7 V, and performance by around 14%. These results suggest that
376
concentration polarization at high CD is minimized in the wave form channel, leading to
377
improvement in the fuel cell performance.
378
379
5. Conclusions
380
This study conducted experiments to improve fuel cell performance, by increasing the mass
381
transport and partial pressure in the fuel cell cathode. We determined the design parameters to yield
382
the optimal wave form shape to be the wave form channel height and wave form shape size ratio,
383
and wave form distance in the cathode channel. The results of the wave form channel fuel cell
384
performance experiments are as follows
385
(1) We fixed the RH at 75%, with operating temperature of 50˚C, anode stoichiometry of 1.5, and
386
cathode stoichiometry of 2.0, while varying the wave form channel parameter ER, in the unit cell
387
performance experiment. Our results show that as the size of the wave form shape increased from
388
ER 1.5 to ER 3.0, the maximum power performance increased by around 6%, 20%, and 21%,
389
respectively, compared to the normal channel.
390
(2) We varied the reactant RH between 50%, 75%, and 90%, to compare fuel cell performance. As the
391
RH increased, the wave form channel performance showed around 7 ~ 20% increase in fuel cell
392
performance, compared to the normal channel.
393
(3) We fixed the anode stoichiometry at 1.5, while varying the cathode stoichiometry, to compare the
394
normal channel and wave form channel. In the case of the normal channel, cathode stoichiometry
395
of 2.5 yielded a slight increase in performance in the high CD region with CD over 1.0, but in the
396
wave form channel, increase of the cathode stoichiometry had an insignificant effect on fuel cell
397
performance.
398
(4) We varied the wave form channel design parameter AD, which yielded 20% fuel cell performance
399
improvement in the ER 2.0, AD 4.0 wave form channel, compared to the normal channel. But the
400
rate of increase of the fuel cell performance improvement decreased as the AD distance increased,
401
due to reduction in reactant mass transport.
402
(5) In the reliability experiment, the normal channel showed great decrease in fuel cell performance
403
after 6 hours. But, in the case of the wave form channel, the voltage decreased by 0.7V after 10
404
hours, and the fuel cell performance decreased by around 28%, compared to the beginning of
405
operation. Thus, fuel cell performance is improved by minimizing concentration polarization
406
inside the wave form channel at high CD.
407
408
Acknowledgments: This work was supported by the Sun Moon University Research Grant of 2014 and 2016
409
Research Grant from Kangwon National University(No. 620160067).
References
412
1. Escribano S., Blachot J. F., Ethève J., Characterization of PEMFCs gas diffusion layers properties, Journal of
413
Power Sources 2006:156:8-13.
414
2. Lin J. H., Chen W. H., Su Y. J., Ko T. H., Effect of gas diffusion layer compression on the performance in a
415
proton exchange membrane fuel cell, Fuel 2008:87:2420-2424.
416
3. Springer T. E., Zawodzinski T. A., Gottesfeld S., Polymer electrolyte fuel cell model, Journal of The
417
Electrochemical Society 1991:138:2334-2342.
418
4. [Natarajan D., Nguyen T. V., A two-dimensional, two-phase, multicomponent, transient model for the
419
cathode of a proton exchange membrane fuel cell using conventional gas distributors, Journal of The
420
Electrochemical Society 2001:148:A1324-A1335.
421
5. Yoon Y. G., Lee W. Y., Park G. G., Yang T. H., Kim C. S., Effects of channel configurations of flow field
422
plates on the performance of a PEMFC, Electrochimica Acta 2004:50:709-712.
423
6. Kuo J. K., Chen C. K., The effects of buoyancy on the performance of a PEM fuel cell with a wave-like gas
424
flow channel design by numerical investigation, International Journal of Heat and Mass Transfer
2007:21-425
22:4166-4179.
426
7. Kuo J. K., Yen T. S., Chen C. K., Improvement of performance of gas flow channel in PEM fuel cells, Energy
427
Conversion and Management 2008:49:2776-2787.
428
8. Kuo J. K., Yen T. H., Chen C. K., Three-dimensional numerical analysis of PEM fuel cells with straight and
429
wave-like gas flow fields channels, Journal of Power Sources 2008:177:96-103.
430
9. Li X., Sabir I., Review of bipolar plates in PEM fuel cells: Flow-field designs, International Journal of Hydrogen
431
Energy 2005:30:359-371.
432
10. Su A., Chiu Y. C., Weng F. B., The impact of flow field pattern on concentration and performance in PEMFC,
433
International Journal of Energy Research 2005:29:409-425.
434
11. Perng S. W., Wu H. W., Effect of the prominent catalyst layer surface on reactant gas transport and cell
435
performance at the cathodic side of a PEMFC, Applied Energy 2010:87:1386-1399.
436
12. Liu F., Lu G., Wang C. Y., Water transport coefficient distribution through the membrane in a polymer
437
electrolyte fuel cell, Journal of Membrane Science 2007:287:126-131.
438
13. Pharoa F. J., Yen T. H., Chen C. K., Three-dimensional numerical analysis of PEM fuel cells with straight
439
and wave-like gas flow fields channel, Journal of Power Sources 2005:44:77-82.
440
14. O’Hayre R., Cha S. W., Colella W., Prinz F. B., Fuel cell fundamentals, 2nd edition, John Wiley & Sons Inc.,
441
NY, USA, 2006.
442
15. Kuo J. K., Chen C. K., Evaluating the enhanced performance of a novel wave-like form gas flow channel in
443
the PEMFC using the field synergy principle, Journal of Power Sources 2006:162:1122-1129.
444
16. Miansari M., Sedighi K., Amidpour M., Alizadeh E., Miansari M., Experimental and thermodynamic
445
approach on proton exchange membrane fuel cell performance, Journal of Power Sources 2009:190:356-361.