Industrial Unrest and National Development
(A Study of Selected Non-Union-Dominated Manufacturing
Firms in South East Nigeria)
OKEKE, MARCEL CHINEMERE (PhD)
Abstract
This study investigated the effect of industrial unrest on national development by studying selected non-union dominated manufacturing firms in South East Nigeria. It adopted survey research design and collected data from primary sources with structured questionnaire. Relevant literature was reviewed based on conceptual, theoretical, and empirical frameworks. The population was 509 comprising managers and employees selected purposively through stratified random method from the five states. The study used complete enumeration Four hundred and thirteen (413) out of the 509 copies of the questionnaire distributed were correctly completed, returned and used for the analysis indicating a response rate of 81%. Data were presented with tables and research questions were presented with statistically weighted means and standard deviation applied to the Likert scale items. Two hypotheses were formulated and tested with t-test statistic for difference in two means at 0.05 level of significance and 411 degrees of freedom. The results indicated that the managers and workers admitted that the items relating to the causes of industrial unrest were prevalent in the society. It was equally revealed that both respondents did not significantly differ in their perceptions on how to nurture and sustain industrial peace and harmony to foster national development. The study concluded that industrial unrest retards national development by manager’s failure to apply those issues that nurture and sustain industrial peace and harmony to foster national development. It recommended that managers should abide by the agreements reached with workers and that both parties should develop the political will to embrace dialogue to reduce the incidence of industrial unrest.
Background to the study
The monumental challenges of the global economy hold the promise of linking this generation in a shared purpose with more rigorous understanding of what makes human networks healthy. Recession, climate change, inequality and even despair that propel radical fundamentalism are indications of a deeply dysfunctional economic ideology that requires a shift to a more effective systemic way of thinking about the next economy which certainly should transform the economic system to embrace a more meaningful purpose in service of a regenerative world. This is established on the core idea that universal patterns and principles which build stable, healthy and sustainable systems should be used as a model for economic system design. This should bring humanity in right relationships, view wealth holistically, accelerate the quality of innovation, adaptability and responsiveness, encourage participation, provide for robust circulatory flow and seek to balance efficiency and resilience, collaboration and competition, diversity and coherence, and small / medium and large organizations need creativity and abundance would flourish.
The pre-industrial revolution era depicted a simple process of production that required no external intervention because of close proximity between employers and employees. It was characterized by a simple process of management investment, small local markets, and relatively small number of people in employment. It was therefore, easier to secure co-operation between the employer and the employees as any misunderstanding or grievances could be promptly resolved. Akanyi (2005) establishes that modern industry is no longer viewed as a venture of owners alone nor profit as considered as its sole objectives. It is recognized as ventures based on purposeful co-operation between management and labour in the process of production where maximum social good is the ultimate goal and both parties should contribute to its success. Similarly, labour is no more an unorganized mass of ignorant workers who obey instructions without resentment or protest the arbitrary and discretionary dictates of management. Management has to deal with modern workforce both as individuals and as members of organized social groups who are more conscious about their rights with substantial bargaining capabilities. Modern industrial society introduces new complex set of perceptions and approaches to workplace activities attributed to the emergence of industrial revolution. Its structure has increased in size, capital investment, human resource diversity, market reach and the emergence of a new philosophy that has rendered the old one irrelevant (Olajide 2006). The emergence of a new class of professional managers has increased the necessity for separation of ownership from management. This has heightened tension and estranged the relationship between the employer and the employee and gradually tending toward antagonism by breeding complex indirect and impersonal industrial relations (Olajide et al 2006).
Many studies have been conducted on organisational conflict and organizational performance but a good number has been on organized labour environments. This study deviates from that pattern by looking at industrial unrest in non-union dominated workplace environment. This is, therefore a paradigm shift in industrial unrest which affects national development. The paper also developed instruments to measure the relevant dimensions of the variables.
Statement of the Problem: Studies have established conflicting effects of industrial unrest on organizational performance. The variables of this study have also followed similar trend as expressed in the works of . The methodologies of the studies were mainly survey design but the findings were contradictory. It would be observed that no study has been carried on industrial unrest and national development at least in South East Nigeria These mixed results and findings suggest the need for further research
Objectives of the Study: The board objective of this study is to determine the relationship between workforce diversity and socio-human creativity in a recessed economy with 4 selected conpan operating in Anambra, Enugu and Imo States as the focal point.
The specific obkective are to:
i. Find out the limit of relationship between ethno-cultural diversity and socio-human creativity in a recessed economy.
ii. Ascertain the extent of relationship between gender diversity and socio-human creativity in a recessed economy.
Research questions
i. What is the limit of the relationship between ethno-cultural diversity and socio-human creativity in a recessed economy?
ii. To what extent does gender diversity relate to socio-human creativity in a recessed economy?
iii. What is the degree of relationship between diversity management practices and socio-human creativity in recessed economy?
Hypotheses of the study
i. There is no significant positive relationship between ethno-cultural diversity and socio-human creativity.
ii. There is no significant positive relationship between gender diversity and socio-human creativity.
iii. There is no significant positive relationship between diversity management practices and socio-human creativity.
Significance of the study: The study will be beneficial to manager and employees in the construction forms because its exposes managerial attitudes towards workforce diversity. Research institutes, academic and students will benefit from it as a source of secondary data, while policy makers will find it useful in formulating polices for general social welfare.
Scope of the study: The study is confined to cover construction companies which draw employees from diverse areas and with large population. It is based on three dimensions of diversity namely ethno-cultural, gender and diversity management practices.
Review of Related Literature: The works of other scholars were reviewed based on conceptual, theoretical, and empirical frameworks. Summary of the literature identified the gap that formed the motivation for the study.
Conceptual Review Todaro (2006) explains development as a multidisciplinary term which applies to all nations and seeks to upgrade low capacity of indigenous institutions through extensive efforts for advancements. Where the emphasis is economic, it means mass production and provision of goods and services through industrialization. If the interest is on the social sector of the economy, it may mean social change, symbolized in greater opportunities for education, provision of infrastructure, and improvement in communication. If the emphasis is on the political sector it may mean political/legal independence. Development is about people and the activities they perform to improve their living standards in a society. However these are only aspects of development. Development finds locus from the analysis of economic parameters which serve as measurable instruments for empirical discussions because they can easily be quantified. In this context, therefore, economic growth and economic development form the bases of understanding intellectual discussions on development along with human development index. They strike a balance with the indices which serve as framework for classifying developmental efforts among nations as developed, emerging, and underdeveloped economies. Discussions on industrial conflict or unrest address salient aspects of economic growth and economic development that relate to national development.
phenomenon as Fajana (2003) asserts that different countries seek solution to industrial unrest based on their economic, political and social environments. Sudan (2004) classifies conflict as cognitive, affective, procedural, functional, and dysfunctional. While dysfunctional conflict is characterized by complex relationships and a high degree of task independence, functional conflict concerns confrontation between groups which enhances and benefits organizational performance. They can be regarded as “creative tension.” Obisi (2003), establishes that conflict involves inconsistencies between individuals or groups, values and norms, and the demands or goals assigned by higher levels in organizations. This perception classifies it as conflict of interest, conflict of right, unorganized conflict, and organized conflict( which is the domain of trade unions or organized labour unions) Conflict of interest borders more on conditions and terms of employment such as working conditions, renewed or agreements, job security, wage and fringe benefits. Conflict of right concerns interpretations of employment contract and agreements and regular grievances relating to production processes, management attitudes, and approaches. Unorganized conflict is individuals’ approach to respond to conflict situations as he considers most appropriate to resolve or aggravate the conflict. It is inimical both to the individual and the organization as it could lead to dismissal and destruction of organization’s property, punitive reassignment and loss of vital organizational documents among others: organized conflict is usually a group’s activity which draws support from members to sue for conflict.
Robbins (2008) views conflict from traditional, human relations and integrationist perspectives. The Hawthorne studies revealed causes of conflict from the traditional perspective as dysfunctional outcome resulting from poor communication, lack of openness and trust between people, managers’ insensitivity to the needs and aspirations of employees. The human relations point of view argues that conflict is natural and inevitable in organization and advocates for its acceptance. This perception expresses that certain aspects of conflict favour individuals, groups, and organizations while some cause injuries to these parties such as unfulfilled expectations, reduced performance, disruptive work processes and so on, which are dysfunctional. This viewpoint dominated conflict theory in the late 1940 through 1970s. This approach rationalized the existence of conflict. The integrationist perspective complements the acceptance posture of the human relations approach but encourages that minimum level of conflicts is good enough to keep the group alive, self-regulating and creative. Its proposition is that conflict is all good, or all bad, inappropriate and naïve depending on the situation of its perception.
Theoretical Framework
This paper is anchored on the class-theory by Karl Max in Stabbins (1987).
UNDP Report (2012) supports this postulation when it explained that poverty persists in Nigeria because of failure of past governments to deliver essential public services to the people. The vast majority of Nigerians suffer while the minority elite at the top gets everything it needs (Kwangh-mande 2014, Ukwuegbo 2013) in Idemobi (2017). Offiong (2014) in Idemobi (2017) has established some link between the prevailing insecurity, unemployment and poverty in Nigeria caused by mismanagement, of the economy by the greedy ruling class who manipulate policies to their advantage and to the detriment of the working and poor Nigerians. This situation supports Kotler (1974) views of different groups of people in the society. Nigeria as a rich nation with poor people seems to derive from the ruling class or elite and partly as a result of failure of government to design policies that will stimulate private sector participation (Chaubas, 2012).
Empirical Review Positive effects
The relationship between conflict management and organizational performance has attracted much attention in management literature. Olu and Dupe (2008) in Nigeria examined the impact of conflict management on employees' performance in a public sector organization using Power Holding Company of Nigeria (PHCN) as the case study. This study adopted the survey research design; Data collected were analyzed using descriptive statistics. Hypotheses were tested through regression analysis and correlation coefficient. The findings revealed that effective conflict management enhances employee's performance and that organization's conflict management system influences employee performance.
Ongori (2009) examined organizational conflict and organizational performance using descriptive research method. Empirical findings show that organizations are adversely affected by conflicts in terms of performance and wastage of scarce resources. Similarly organizational conflicts do have positive effects to the organization especially in increasing organizational innovativeness and improving the quality of decisions in the organization. In addition conflicts build the spirit of teamwork and cooperation among the employees of the organization. This occurs especially when they come together to resolve.
Jalaluddin, Eka, Djumilah, and Surachman (2013), examined the role of conflict toward employee performance. This study analysis unit is Regional Working Units at Regional Apparatus Work Unit (RAWU), using survey design and analysis method was Structural Equation Modeling (SEM). The result showed that higher knowledge can increase employee's performance and lower intensity conflict. Organizational commitment can improve employee performance, but cannot reduce conflict intensity. Power can reduce intensity of conflict, but does not improve employee performance. Conflict can drive employee's performance.
Olukayode (2015) in Nigeria examined the impact of workplace conflict management on organizational performance of manufacturing firms using survey design. Employing Spearman correlation analysis and regression, the results showed a significantly positive relationship between conflict management strategies and organizational performance. Union-management conflict was discovered as the most prevalent type of industrial conflict in the organization.
female respondents regarding the causes of conflict. However, there is a significant effect of conflict on organizational performance.
Uchendu, Anijaobi-Idem & Odigwe (2013), studied conflict management and organizational performance in secondary schools in cross river State, Nigeria. Ex-post facto research design was adopted. Three hypotheses were tested. Stratified random sampling technique was used to sample 500 teachers from the population of 5,410 secondary school teachers in the state. Data were generated using researchers constructed questionnaire called "Conflict Management and Organizational Performance Questionnaire (CMOPQ). The instrument was a 4 point likert type scale consisting 32 items. Pearson Product Moment Correlation Coefficient Analysis was used in analyzing the data. The result of the analysis revealed that there is a significant relationship between conflict management in terms of teacher-teacher conflict (TTC), teacher-student conflict (TSC), principal-teacher conflict (PtC) and organizational performance.
Amineh and Ali Kahgarani (2014) studied the Relationship between Conflict Management Styles and Organizational performance; descriptive data were collected through field method. The statistical population -consisted of 92 employees and managers of southern oil company were selected randomly. The Kolrnogorov-Smirnov Test was- used to determine the normality of the collected data. According to the computational level of significance, the hypothesis that samples are distributed was not rejected. Also, to determine the relationship between conflict management with organization performance, the Pearson correlation coefficient was applied. The study tried to test only one major hypothesis (relationship between conflict management and organization performance). Finally, the Freedman rating test was used to determine rate of conflict management and dimensions of organization performance separately. In conclusion the mathematical function of conflict management relationship with organization performance based on the Pearson's correlation coefficient was provided in form of a regression, model. The result indicated that there is a significant relationship between conflict management with aspects of Organization performance,
Positive and negative effects
Hotepo, Asokere, Abdul-Azeezl and Ajemunigbohun (2010) investigated the effect of organizational conflict on organizational performance in Nigeria. The study employs descriptive research design and uses questionnaire to collect data from 96 managers in some selected Airlines, Road Transport and Insurance companies in Lagos Metropolis. The research' revealed that limited resources is the major cause of conflict and that conflicts have both negative and positive effects on organization, but when managed properly, the positive effects can be used-to encourage organizational innovativeness and build co operation among the employees.
was further found that the managers prefer to compromise problem solving and dominating strategies. The results showed that conflict management strategies in place at the organization have been relatively useful in minimizing the incidence of disruptive conflicts ' while conflict management strategies have positive impacts on workers' productivity. Mba (2013) examined conflict management and employees performance in Julius Berger Nigeria Plc. A cross sectional survey research design was used. Data were analyzed with descriptive and inferential statistics. Results indicated that significant relationship exists between conflict management strategies and employees' performance and no differences exist between managerial and non-managerial employees' perception of the effectiveness of conflict management strategies.
Negative effects
Muhammad & Maria (2013) examined the impact of conflict and conflict management on organizational performance. The survey respondents from, the eight corporate sector organizations were selected. Results showed that the two most conflict types are intra-personal and inter-intra-personal conflicts. Both employees and managers shared concerns that conflict does not bring positive effects to organizational performance; rather it brings negative effects more to work performance and organization's productivity.
Muhammad and Mughal (2013) studied the Impact of Conflict and conflict Management on Organizational Performance. A self-administered questionnaire is used to collect data. The survey respondents from the eight corporate sector organizations are selected for this study. Results showed that the two most commonly faced conflict types are infra-personal and inter- personal conflicts. Both employees and managers gave their shared concerns that emergence of conflict does not primarily bring positive effects to the organizational performance; rather it brings negative effects more to the work performance and organization's productivity.
Okoriko (2014) examined Conflict management and organizational performance in national research institute for chemical technology (NARICT) and Nigerian institute of transport technology (NITT), Zaria. The study adopted survey design. The study tested two hypotheses of which analysis were performed by the use of simple percentages and chi-square (%2) statistical tool at 5% level of significance in testing the hypotheses. The findings indicated that staff accommodation in both organizations are inadequate especially NITT and recommended government to acquire land and award contract to build more staff accommodation for the organizations especially NITT to reduce competition for the few, ones available in order to minimize the rate conflict and also to motivate members of staff to give their best, towards moving the organizations forward on the part of increased performance.
Gap in Literature
Nicole et al, (2009) indicate high ethno cultural initiatives/empathy while Frank, et al (2006) in South Africa report divergent views that in South Africa and Singapore HR practices encourage motivation but conflicting views on retaining knowledge workers. Even the dependent variable supports different approaches to managing diversity and creativity as explained by Meghria et al (2014) Thus, the gap in literature provided by the studies lie in the fact that they were conducted in different contexts but reported conflicting results on the effect of diversity thereby indicating need for further research
Methodology
The study adopted survey research design. The population was 509 managers and workers purposively selected randomly. Data were collected from primary and secondary sources, and were presented with descriptive statistics of tables and percentages
Table 1: Population and sample proportion
states Employees ………..manager Total
1 Anambra 78 52 130
2 Abia 65 40 105
3 Ebonyi 54 21 75
4 Enugu 57 23 80
5 Imo 68 51 119
Total 322 187 509
These firms maintained massive presence in three quarters of each state in the south east executing government construction works.
Method of Data Collection This study combined both primary and secondary data for the analysis. Primary data comprise data obtained by administering questionnaire directly to the respondents. Out of the 509 copies of the questionnaire that were administered, 413 were correctly completed and retrieved thus showing a response rate of 81 percent. The secondary data on the other hand, were sourced from: thesis, publications in academic and professional journals, books, archives among other. The questionnaire was structured on five point – Likert scale with weights assigned to; strongly Agree (SA) = 5, Agree (AG) = 4, Undecided (UND) = 3, Disagree (DA) = 2 and Strongly Disagree (SD) = 1.
Method of Data Analysis The data gathered for the study were analyzed using analysis of variance (ANOVA) developed by Fisher (1923) for studies with population of more than two (2) means. It is known as an F-test. However, the analysis was restricted to one-way analysis of variance. The reason for using ANOVA was to compare different population means existing within the groups and between the groups or determine the existence of differences if any, among several populations means. The null and alternative hypotheses were tested for the opinions of different categories of workers at 0.05 level of significance. Decision rule was applied to either accept or reject the null hypothesis at a point where F-tabulated value or F-calculated value is greater than or less than the other.
Data Presentation and Analysis: Data gathered in this study were analyzed in this section using appropriate statistical tool of analysis for variance (ANOVA) as stated above. All tests were carried out at 0.05 level.
Data Presentation: Research question one what are the major factors which cause industrial unrest that retard national development in Nigeria. The 1st research question was
Table 3.2 mean and standard deviation of the respondents on major causes of industrial unrest that retard natural development.
Items X1 pd Mars SD, Owner
mgrs2
SD2
1 dysfunctional outcome resulting from poor communication
3.15 1.78 3.44 1.85
2 lack of openness and trust between people
3.62 1.90 3.23 1.80
3 managers’ insensitivity to the needs and aspirations of employees
3.85 1.96 3.35 1.83
4 Unacceptable employment terms, 3.92 1.93 3.44 1.85
5 perceived improper styles of management by the officers
2.92 1.71 2.85 1.69
6 ineffectiveness of grievance
communication
3.15 1.77 2.84 1.69
7 Perceptions and value problems. 3.70 1.50 3.51 1.49
8 issues of employee compensation &, welfare
2.59 1.26 2.56 1.43
9 managers preference to compromise, problem solving and dominating strategies
3.74 1.61 3.88 1.79
10 inconsistencies between individuals or groups, values and norms
3.60 1.69 2.51 1.41
Source field survey 2017 Grand X,=3.42SD,1.72x2=3.13 SD2 1.68
The analysis of table 3.2 revealed that the respondents admitted that the ten items relating to causes of high industrial unrest that retard national development are prevalent in the society. It is very noticeable that the employees strongly agreed with the statement of most of the items than the managers who merely agreed with mean responses 3.42 and 3.13 in some cases. However, highlights of the statements included inadequate communication, inconsistencies between individuals or groups, values and norms, unacceptable employment terms, perceived improper styles of management by the officers etc
The degree of agreement or disagreement with any of the statements is expressed by the response options chosen by the respondents. Interestingly and quite contrary to the popular opinion, the managers in their choice to contribute to national development of the contemporary Nigeria society.
Highlight included……….etc. The respondents agreed in most cases that whatever would be done to nurture and sustain industrial peace and harmony is quite necessary. However the managers disagreed with the notion that decrease in national development is caused by the managers’ ineptitude.
Tests of hypotheses Hi
Hi: There is no significant variance in the opinions of managers on their perceptions of the causes of high industrial unrest in the contemporary Nigeria society.
Table 3.3 summary of t-test result for hypotheses 1
Source of
validation
N x SD DF T values t value P< 0.05
Employees 261 3.42 1.72 1.672 No sign
managers 152 3.13 1.68 1.960 Fiscal difference
Note calt= educated t value Crit t= critical t value N= 413 P=< 0.05 Source: field survey 2017
Table 3.3 above shows that at 0.05 level of significance and 411 degrees of freedom (df), the calculated t-value 0.824 was less than the critical value of 1.960. Therefore, there was no significant difference in the opinions of the two groups of respondents concerning nurturing and sustaining industrial peace and harmony to enhance national development of Nigeria.
Table 4.2 above shows that at 0.05 level of significant and 411 degrees of freedom (df) the calculated t value of 1.677 was less than critical t value of 1.960. Therefore, there was no significant difference between the opinions of the managers and those of the employees on the major causes of unrest that retard national development of contemporary Nigerian society. The Null hypothesis was accepted while the alternate hypothesis was rejected. The degree of agreement or disagreement with any of the statements is expressed by the response options chosen by the respondents intersingly and quote coutracy to the popilar opinion, the owner managers their choice of response option, agreed that managers as well as the society have contributed to a reasonable extent to the high rate of industrial unrest that retard national development in the contemporary Nigeria society.
Research question 2: does improving the factors that cause industrial unrest contribute to national development of contemporary Nigeria society?
Mean scores of respondent opinions in how to nurture and sustain industrial peace and harmony to contributing to National development of contemporary Nigeria society
Table 4.3
Items X1 empl SD1
empl
X2 mgrs2 SD2 mgrs2
1 3.92 1.98 3.69 1.92
2 3.69 1.92 2.84 1.69
3 3.23 1.80 2.62 1.62
4 3.15 1.77 3.23 1.80
5 3.33 1.82 3.08 1.75
6 3.31 1.82 3.26 1.81
7 3.54 1.88 3.15 1.77
8 3.46 1.86 3.72 1.84
9 2.00 1.641 2.85 1.69
10 3.85 1.96 3.55 1.88
Grand X1=3.35SD, 1.82x2=3.20 SD2 1.77 Source field survey 2017.
Table 4.4 is the presentation of the analysis of research question2. The mean scores and standard deviation of the respondents accessed how to nurture and sustain industrial peace and harmony to contribute to National development of the contemporary Nigeria society. Highlight included………etc
The respondents agreed in most cases that whatever would be done to nurture and sustain industrial peace and harmony are quite necessary. However the managers disagreed with the notion that decrease in national development is caused by the managers’ ineptitude. Hypothesis II
Hii: The perceptions of the respondents do not differ significantly on how to nertive to
contribute to national development of the contemporary Nigeria society.
Table 4.4 which show the percentage of research question 2 was used for test of hypothesis II. It was carried out with t-test statistics at 0.05 level of significances and 411 degree of freedom (df). The result indicated that the null hypothesis was accepted while the alternative hypothesis was rejected.
Table 4.5 summary of t-test results of a hypothesis II
Source of
validation
N x SD1 DF T
values
t value P< 0.05
Employees 261 3.35 1.82 0.824 1.960 No
significant
managers 152 3.20 1.77 difference
Method of Data Analysis The data gathered for the study were analyzed using analysis of variance (ANOVA) developed by Fisher (1923) for studies with population of more than two (2) means. It is known as an F-test. However, the analysis was restricted to one-way analysis of variance. The reason for using ANOVA was to compare different population means existing within the groups and between the groups or determine the existence of differences if any, among several populations means. The null and alternative hypotheses were tested for the opinions of different categories of workers at 0.05 level of significance. Decision rule was applied to either accept or reject the null hypothesis at a point where F-tabulated value or F-calculated value is greater than or less than the other.
Note calt= educated t value 0.824 Crit t= critical t value 1.1960 N= 413 P=< 0.05 Source: field survey 2017
Discussion of the results
On the factors which dominate industrial unrest the respondents did not differ significantly which supported the views of ……….in their ……….on the measure to nurture and sustain industrial peace and harmony, they were equally significantly congruent in their opinions to …………. This study did differ from the works of ……….
The respondents did not differ in their opinions on both the factors which cause industrial unrest and on how to nurture and sustain industrial peace and harmony in Nigeria.
Findings
1. The degree of agreement or disagreement with the items in the instruments expressed by the respondents showed that managers and employees did not significantly differ in their perceptions on the causes of industrial unrest in Nigeria.
2. It was discovered that managers contributed to a reasonable extent to high rate of industrial unrest in Nigeria since their perceptions are congruent with those of employees on how to nurture and sustain industrial peace and harmony in Nigeria. Conclusion: The result of the analysis showed that industrial unrest causes disruption in the performance of workers as well as productivity of forms, the congruency of the views of both employees and managers indicated that they lacked the political will to implement
agreements hence the unrests. This study, therefore, concluded that industrial unrest significantly retards national development.
Recommendations
1. Managers should try to abide by the teams of agreements reached with employees in order to stem the incidence of industrial unrest.
2. Firms should encourage dialogue between workers and managers on better approaches to nurture and sustain industrial peace and harmony which enhance national development.
3. Managers and employees should explore the possibilities of adopting deliberative and implemental mindset in handling issues of industrial unrest in non-union dominated environment to improve and sustain national development.
Refernces
Abdul, G.A and Sehar, S. (2015). Conflict management and organizational performance: A case study of Askari Bank Ltd. Research journal of finance and Accounting,
6(11)88-102.
Ajala, E.M (2003). The influence of peace education on labour-management relations in selected industries in Oyo State, Nigeria, PhD Thesis Dept. of Adult Education, University of Ibadan, Oyo, Nigeria.
Akanji, I. (2005). Perspectives in workplace conflict management and new approaches for the twenty first century. In Albert I.O (Ed), Perspectives on Peace and Conflict in Africa: Essays in ‘Honour of Gen Abdusalam Abubakar, Ibadan: John Arches Publishers.
Amineh, O & Ali Kaha (2014). Evaluation of relationship between conflict management styles and organization effectiveness. Research journal of applied sciences, Engineering and technology 7(4): 92-105.
Beechler, S. & Baltzley, D. 2008, 'Creating a Global Mindset', Chief Learning Officer,
vol. June, pp. 40-45.
Bowen, D. E. & Inkpen, A. C. (2009), 'Exploring the Role of 'Global mindset' in Leading Change in International Contexts', The Journal of Applied Behavioral Science, vol. 45, no. 2, pp.
Cohen, S. L. (2010), 'Effective global leadership requires a global mindset', Industrial and Commercial Training, vol. 42, no. 1, pp. 3-10.
Dawson, S., Breen, J. & Satyen, L. (2002), 'The Ethical Outlook of Micro Business Operators', Journal of Small Business Management, vol. 40, no. 4, pp. 302-313. Fisher, C. & Lovell, A. (2006), Business Ethics Values: Individual, Corporate and
International Perspectives, 2nd ed, Pearson Education Limited, Essex.
Fisher, C. & Lovell, A. (2009), Business Ethics and Values: Individual, Corporate and International Perspectives, 3rd edn, Pearson Education Limited, Essex.
Fujita, K., Gollwitzer, P. M. & Oettingen, G. (2007), 'Mindsets and Pre-Conscious Open- Mindedness to Incidental Information', Journal of Experimental Social Psychology, vol. 43, no. 1, pp. 48-61.
Gosling, J. & Mintzberg, H. (2003), 'The Five Minds of a Manager', Harvard Business Review, vol. 81, no. 11, pp. 54-63.
Hiemisch, A., Ehlers, A. & Westermann, R. (2002), 'Mindsets in social anxiety: a new look at selective information processing', Journal of Behavior Therapy and Experimental Psychiatry, vol. 33, no. 2, pp. 103-114.
Hotepo, O.M., Asokere, A.S.S., Abdu-Azeel, I. A. & Ajemunigbohnu, S.S.A (2010). Empirical study of the effect of conflict on organizational performance in Nigeria.
Business and economics journal. 3(15) 1-9
Idemobi, E.I. (2017) Addressing the challenges of unemployment and poverty through entrepreneurship. Lead paper presented at the 1st International conference,
organized by Business Administration Department, Federal Polytechnic Oko, April 26
Issa, T. (2009), Ethical mindsets, aesthetics and spirituality: A mixed-methods approach analysis of the Australian services sector, but available online through URL:
http://espace.library.curtin.edu.au/R/?func=dbin-jump-full&object_id=131986&local_base=GEN01-ERA02, Curtin University of Technology.
Lee, M. & Ruhe, J. A. (1999), 'Ethical Mindsets of Christianity and Confucianism: A Comparative Study', International Journal of Values - Based Management, vol. 12,
no. 1, pp. 13-27.
Mba, O.A. (2013). Conflict management and employees performance in Julius Berger Nigeria PLC, Bonnyy Island. International journal of Academic research in management 3(4) 125-139
Muhammad, R.M .& Maria, K. (2013). Impact of conflict and conflict management on organizational performance. International journal of modern Business, 86(2) 01-19. Obasan, K. A. (2011). Impact of conflict management on corporate productivity: An Evaluative study. Australian journal of business and business Research. 1(5) 44-49.
Obiis, C. (2013) organizational Behaviour concept and applications, Lagos Maltholise press Limited.
Ojielo, M (2002). Conflict and strikes. Nigerian Tribnue 7th November.
Ojielo, M.O (2002). Managing Organizational Conflict: a systems approach. Ibadan: John Archers (Publishers) Ltd.
Okoriko S. E. (2014) conflict management and organizational performance in national research institute for chemical technology (NARICT) and Nigerian institute of transport technology (NIT), Zaria. Being a research thesis submitted to the post Graduate school of Ahmadu Bello University Zaria
Olu, O. & Dupe, A. A (2008). Impact of conflict Management on Employees’ Performance in a Public Sector Organization in Nigeria, Department of Human Resource Management, Faculty of Management Sciences, Osun State University.
Olukayode, L (2015). Impact of workplace conflict management on organizational performance: A Case of Nigerian manufacturing firm
Ongori, H. (2009). Organizational conflict and its effects on organizational performance
journal of International Business 23(4)21-24.
Onwuchekwa C.I (2002) organizational Behavior Enugu; Ziks Chuks.
Sudan, A.S (204), organizational effectiveness and change, San Francisco: Benet-Koehler Publishers.
Todaro, M.P. (2006) Economic Development 8th Ed Dorling Kindersley India Pvt Ltd 482 Fie Patpaganji, Delhi 110092, India p 484.
Analysis and Optimization of Essential Parameters of Green
Sand Process to Minimize Persisting Defects in GI Castings
Using Taguchi Approach
Sanjay N. Aloni
Dr. Sharad S. Chaudhari & Dr. Rakesh L. Shrivastava
AbstractThe main objective of the work presented in this paper is to analyze the essential parameters in green sand process for identification of most influential parameters that are responsible for the occurrences of the defects which are persisting in complex gray iron components. The defects which are persisting in the foundry industry producing cylinder heads and other castings required in the automotive are shrinkage porosity, blow holes, sand inclusion and low hardness, factory situated in central India. In pursuing for the identification of most influential parameters for respective defects, Taguchi’s approach to parameter design is proposed. In the first stage of study, essential parameters iof green sand process are selected and experiments are performed as per the plan given by the suitable Taguchi array, L36 OA. In the second stage optimal levels of the parameters are determined from the signal-to-noise ratio calculations. Analysis of variance (ANOVA) is subsequently performed to identify most influential parameters. Confirmation run of experiments is performed with optimal settings of parameters to verify the results. Outcome of confirmation experiments indicated that persisting defects in cylinder head castings produced by a green sand process are sufficiently reduced.
Keywords: Green sand process, persisting casting defects, process parameters, Taguchi orthogonal array, analysis of variance: ANOVA
Nomenclature:
ANOVA Analysis of variance
Cont % Percentage Contribution made by individual parameter
CE Carbon equivalent
DOE Design of Experiments DOF Degree of freedom
MS Mean squares
OA Orthogonal array
S/N Signal-to-noise ratio
SS Sum of squares
T Average value of casting defects at different levels yi Response value of observation in ith test
1 Introduction
The clay bonded sand, commonly known as green sand, is typically bonded with Bentonite (clay) and water to mould the sand. Other common sand casting processes used for the production of casting include CO2, No-Bake, and Shell Sand process depending on the
type of sand used for production of mould. The choice of particular sand casting process depends upon the factors like the size and intricacy of the components, as well as the volume of production [1]. Wide range of gray iron castings required in automotive is produced in medium & large-scale foundries by a green sand process. The main aim of the foundry industries is to produce quality castings with no rejection. Also, in the present era of global competition, manufacturing industries has bound to take the challenge that is demand for high quality product with reduced lead–time [2].In the green sand casting process number of parameters are involved that are associated with main operations performed during casting production. The quality of castings produced in green sand casting process, is always a result of a proper combination and settings of these parameters [3]. A Factor called as ‘quality dimensions’ is one of the major factors in evaluation of organizational performance accounts for major cumulative variance, this includes such elements as scrap, rework and waste [4]. Among the several possible defects in castings produced by a green sand casting process, some defects are persisting and more challenging to avoid. For example the prediction of shrinkage porosity or closed shrinkage in the complex geometrical components such as the cylinder head is not straightforward in general. Porosity is the most persistent and common complaint of casting users. The final reliability of a casting and mechanical properties of the casting is greatly influenced by the presence of defects such as porosity, blow holes, sand inclusions and low hardness. These defects not only cause the loss in productivity and increased production cost, but also affect the performance of these components [5].
In order to minimize persisting defects, Taguchi approach to parameter design is applied in this study to obtain the optimal settings of process parameters. The proposed methodology suggests a selection of essential process parameters in the first step. The next step is experimentation for the evaluation of the individual parameters to optimize the response. In this study 19 ssential parameters are selected at mixed levels and experimentation is performed as per the plan given by chosen Taguchi array, L36 OA [6, 7]. Results are analyzed using the Taguchi approach to determine optimal levels and ANOVA is used for identification of most influential parameters on the basis of percentage contributions they made in the occurrences of respective persisting defects.
2 Literature review
ductile iron castings, Taguchi L-27 orthogonal array was chosen with 3-level settings of parameters for the analysis. In his work he selected total seven (7) parameters out of which six are related to sand and mould.
From the review of the above significant studies, it was revealed that in most of the work done on optimization of sand casting process, the Taguchi approach was used which concentrate on optimization of single quality characteristic or mono response and hardly, cover the parameters associated with all the principal operations involved in the green sand process.Where as in the present work multiple quality characteristics (persisting defects) are conider and 19 essential parameters associated with all the principal operations are analyzed for improvement in the performance.
3 Selection of process parameters
Table1 Casting Defects associated with the different operation’s in the green sand process
Table 2:Process parameters and corresponding levels
4 Selection of orthogonal array
Total 19 potential parameters are identified in the first stage of study as they are expected to be responsible for the occurrences of persisting defects. Now, as proposed in the Process/Operations Associated Defects
Sand Preparation Sand Inclusion
Mould Scabbing
Sand Fusion
Moulding Blow
Hole Mould Broken Mould Leakage Mould Mis- Match Mould Swelling
Core Making & Core Setting
Core Blow Hole
Core Lift Core Shift
Core Swelling
Core Scabbing
Melting &Pouring Shrinkage Porosity
Blow Hole
Hardness (Low or High)
Cold Chemical Analysis
Short Pour
Slag Inclusion
Shakeout Hardness (Low or High)
Casting Damage
Fettling Handling Broken
Extra Grinding
Pattern Manufacturing
Rejection of casting components due to wrong manufacturing of pattern tool equipments & due to Trial and Error method during sample production in development stage
Sr. No.
Process Parameter Parameter Designation
Range Level 1
Level 2
Level 3
1 Carbon Equivalent Value (nu) A 3.9 - 4.0 3.9 4.0 ---
2 Carbon Content (%) B 3.3 – 3.4 3.3 3.4 ---
3 Pouring Temperature (0C) C 1400 -1410 1400 1410 --- 4 Inoculants Addition (%) D 0.15 – 0.20 0.15 0.20 ---
5 Steel Scrap Addition (%) E 30 - 40 30 40 ---
6 Phosphorus Content (%) F 0.08 – 0.09 0.08 0.09 ---
7 Binder Qty in core sand (%) G 1.8 – 2.2 1.8 2.2 ---
8 Moisture Content (%) H 4 – 4.8 4 4.4 4.8
9 Permeability (nu) J 130 -150 130 140 150
10 Sulphur Content (%) K 0.07 – 0.09 0.07 0.08 0.09
11 Green Compression Strength (Kg/cm2)
L 1.4 – 1.8 1.4 1.6 1.8
12 Compatibility (%) M 40 - 46 40 43 46
13 Return Sand Temperature (0C) N 30 - 50 30 40 50 14 Squeezing Pressure (bar) O 90 - 110 90 100 110
15 Mould Hardness Horizontal (nu) P 80 - 90 80 85 90
16 Mould Hardness Vertical (nu) Q 70 – 80 70 75 80
17 Silica content in Sand (%) R 95 – 98 95 96.5 98
18 Knockout or Cooling Time (min) S 30 – 40 30 35 40
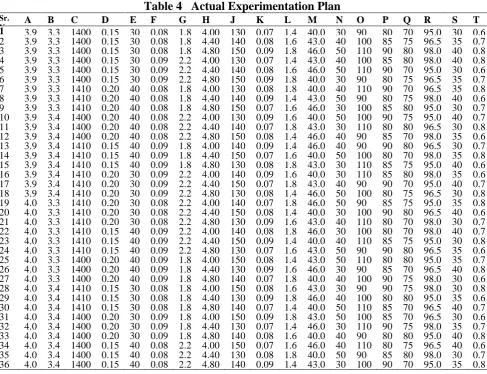
Taguchi approach to parameter design, an experiment can be performed using suitable Taguchi Orthogonal Array. While selecting a particular orthogonal array for conducting the experiments, two points must be considered that are; the number of parameters & the number of levels for the parameters of interest. As mentioned in Table 2 total parameters involved in this study are 19 and therefore it was decided to go with L36 array, one of the suitable arrays for 19 parameters with mixed levels [24]. As mentioned in Table 3, seven parameters are considered at two levels and remaining twelve parameters are considered at three levels for experimentation. The Taguchi method was applied to the experimental data using statistical software “MINITAB 14”. The template for experimental plan for 19 parameters with mixed levels using the Taguchi L36 orthogonal array is given below in Table 3, where -1, 0& +1 represents level 1, level 2 and level 3 of corresponding process parameters. The actual design of experimentation can be obtained by putting values of process parameters at corresponding level as shown in Table 4
Table 3 Template, Taguchi L36 Array
Sr. No.
A B C D E F G H J K L M N O P Q R S T
1 -1 -1 -1 -1 -1 -1 -1 -1 -1 -1 -1 -1 -1 -1 -1 -1 -1 -1 -1
2 -1 -1 -1 -1 -1 -1 -1 0 0 0 0 0 0 0 0 0 0 0 0
3 -1 -1 -1 -1 -1 -1 -1 1 1 1 1 1 1 1 1 1 1 1 1
4 -1 -1 -1 -1 -1 0 0 -1 -1 -1 -1 0 0 0 0 1 1 1 1
5 -1 -1 -1 -1 -1 0 0 0 0 0 0 1 1 1 1 -1 -1 -1 -1
6 -1 -1 -1 -1 -1 0 0 1 1 1 1 -1 -1 -1 -1 0 0 0 0
7 -1 -1 0 0 0 -1 -1 -1 -1 0 1 -1 0 1 1 -1 0 0 1
8 -1 -1 0 0 0 -1 -1 0 0 1 -1 0 1 -1 -1 0 1 1 -1
9 -1 -1 0 0 0 -1 -1 1 1 -1 0 1 -1 0 0 1 -1 -1 0
10 -1 0 -1 0 0 -1 0 -1 -1 1 0 -1 1 0 1 0 -1 1 0
11 -1 0 -1 0 0 -1 0 0 0 -1 1 0 -1 1 -1 1 0 -1 1
12 -1 0 -1 0 0 -1 0 1 1 0 -1 1 0 -1 0 -1 1 0 -1
13 -1 0 0 -1 0 0 -1 -1 0 1 -1 1 0 -1 1 1 0 -1 0
14 -1 0 0 -1 0 0 -1 0 1 -1 0 -1 1 0 -1 -1 1 0 1
15 -1 0 0 -1 0 0 -1 1 -1 0 1 0 -1 1 0 0 -1 1 -1
16 -1 0 0 0 -1 0 0 -1 0 1 0 -1 -1 1 0 1 1 0 -1
17 -1 0 0 0 -1 0 0 0 1 -1 1 0 0 -1 1 -1 -1 1 0
18 -1 0 0 0 -1 0 0 1 -1 0 -1 1 1 0 -1 0 0 -1 1
19 0 -1 0 0 -1 -1 0 -1 0 -1 1 1 1 -1 0 0 -1 0 1
20 0 -1 0 0 -1 -1 0 0 1 0 -1 -1 -1 0 1 1 0 1 -1
21 0 -1 0 0 -1 -1 0 1 -1 1 0 0 0 1 -1 -1 1 -1 0
22 0 -1 0 -1 0 0 0 -1 0 0 1 1 -1 0 -1 -1 1 1 0
23 0 -1 0 -1 0 0 0 0 1 1 -1 -1 0 1 0 0 -1 -1 1
24 0 -1 0 -1 0 0 0 1 -1 -1 0 0 1 -1 1 1 0 0 -1
25 0 -1 -1 0 0 0 -1 -1 1 0 -1 0 1 1 -1 1 -1 0 0
26 0 -1 -1 0 0 0 -1 0 -1 1 0 1 -1 -1 0 -1 0 1 1
27 0 -1 -1 0 0 0 -1 1 0 -1 1 -1 0 0 1 0 1 -1 -1
28 0 0 0 -1 -1 -1 -1 -1 1 0 0 0 -1 -1 1 0 1 -1 1
29 0 0 0 -1 -1 -1 -1 0 -1 1 1 1 0 0 -1 1 -1 0 -1
30 0 0 0 -1 -1 -1 -1 1 0 -1 -1 -1 1 1 0 -1 0 1 0
31 0 0 -1 0 -1 0 -1 -1 1 1 1 0 1 0 0 -1 0 -1 -1
32 0 0 -1 0 -1 0 -1 0 -1 -1 -1 1 -1 1 1 0 1 0 0
33 0 0 -1 0 -1 0 -1 1 0 0 0 -1 0 -1 -1 1 -1 1 1
34 0 0 -1 -1 0 -1 0 -1 1 -1 0 1 0 1 -1 0 0 1 -1
35 0 0 -1 -1 0 -1 0 0 -1 0 1 -1 1 -1 0 1 1 -1 0
36 0 0 -1 -1 0 -1 0 1 0 1 -1 0 -1 0 1 -1 -1 0 1
5 Experimentation
Actual experimentation can be performed after the parameters assigned to a particular column of the selected orthogonal array, as shown in Table 4, [7, 24].The casting of Cylinder Head (3 Bore) was made against the experimental plan given in Table No.4. As per chosen array L36, 36 experiments are conducted and experimental outcomes are recorded, in the present work outcomes are a percentage of castings rejected due to presence of respective persisting defects. Casting rejection percentage due to the presence of defects for each experimentation was recorded and then by using the given formula, rejection percentage due to presence of respective persisting defects were calculated for each trial condition which is a ratio of the number of castings rejected due to presence of respective Persisting defects to the total number of castings rejected.
Percentage = No. of castings rejected due to Persistingof respective persisting defects *100 …Equation 1
Defects Total Rejection
Table 4 Actual Experimentation Plan
Sr. No. .
A B C D E F G H J K L M N O P Q R S T
6 Taguchi analysis of experimentation output
Table 5 Casting defects and corresponding S/N ratio
The Taguchi method uses the signal-to-noise S/N ratio instead of the response value obtained as a result of in the optimum setting analysis. The S/N ratio replicates both the
Exp. No.
Avg. Value in % for Persisting Defects & Corresponding S/N Ratio ShrinkagePo
rosity (Y1)
S/N Ratio
Blow Hole (Y2) (Y2)
S/N Ratio
Sand Inclusion (Y3)
S/N Ratio
Low Hardness (Y4)
S/N Ratio
average and the variation of the response or quality characteristics [7, 24-25]. The percentages of castings rejected due to presence of respective persisting defects that occur in each trial condition were calculated by using equation 1 given above. The casting defects are the “lower-is -the better” type of quality characteristics. S/N ratios for this condition are calculated by the equation No. 2 given below. S/N ratios are calculated for each of the 36 trials and Corresponding S/N ratios are given above in Table 5.
………..Equation No. 2
Where, ‘n’ is trial number of observations and ‘yi’ is the response or observed data in ‘i’th
is the experiment number. After calculating the S/N ratios, the average S/N value is calculated for each factor at different levels [25-26]. The mean response refers to the average value of the performance characteristics for each parameter summarized in Tables 6 to 9. The average values of S/N ratios for individual process parameters at different levels are plotted on response graph and shown in Figures 1 to 4. From response tables 6 to 9 and Figure 1 to 4 for main effect plots or response graph, it can be concluded that which process parameter level works better to minimize persisting casting defects.
Fig. 1 Graph of the main effects of S/N for Shrinkage Porosity (Y1) Table 6: S/N ratios at different levels for
Shrinkage Porosity (Y1)
Process Variable
Level 1 Level 2 Level 3 Delta
Value
Rank
A -11.614 -9.830 …… 1.785 1
B -10.769 -10.675 ……. 0.093 18
C -10.647 -10.797 …… 0.151 17
D -10.698 -10.746 ……. 0.047 19
E -10.077 -11.367 ……. 1.290 2
F -10.315 -10.315 …….. 0.815 3
G -10.513 -10.931 …… 0.418 10
H -10.560 -10.831 -10.775 0.271 14
J -11.059 -10.649 -10.459 0.600 8
K -10.607 -10.736 -10.824 0.217 15
L -10.925 -10.783 -10.459 0.466 8
M -10.571 -10.854 -10.741 0.284 13
N -10.956 -10.654 -10.557 0.399 11
O -10.951 -10.587 -10.629 0.364 12
P -10.715 -10.811 -10.640 0.171 18
Q -10.448 -10.627 -11.091 0.643 4
R -10.998 -10.532 -10.636 0.466 9
S -10.975 -10.752 -10.440 0.535 7
Fig. 2 Graph of the main effects of
S/N for Blow Hole (Y2)
Table 8: S/N ratios at different levels for Sand Inclusion (Y3)
Fig. 3 Graph of the main effects of
S/N for Sand Inclusion
Table 7: S/N ratios at different levels for Blow Holes (Y2)
Process Factors
Level 1 Level 2 Level 3 Delta
Value
Rank A -0.78371 -0.96319 ….. 0.17947 16
B -0.95389 -0.79301 …. 0.16088 17
C -0.34803 -1.39887 ….. 1.05083 7
D -1.28283 -0.46407 ….. 0.81876 9
E -0.67140 -1.07550 ….. 0.40410 14
F -1.12091 -0.62599 ….. 0.49492 13
G 0.63423 -2.38113 … 3.01536 1
H -0.02180 -1.07248 -1.52607 1.50427 4 J -1.68775 -1.04697 0.11437 1.80212 2
K -0.93139 -1.04370 -0.64525 0.39845 15
L -1.05062 -1.09385 -0.47588 0.61797 11
M -0.92246 -0.79798 -0.89991 0.12447 18
N -0.29326 -0.97343 -1.35366 1.06041 6 O -0.54328 -0.98076 -1.09631 0.55303 12
P -1.20664 -0.83201 -0.58170 0.62495 10
Q -0.43547 -0.80844 -1.37644 0.94097 8
R -0.86484 -0.89484 -0.86067 0.03417 19
S -0.32238 -0.86228 -1.43569 1.11331 5 T -0.02259 -0.99378 -1.60398 1.58138 3
Process
Factors Level 1 Level 2 Level 3
Delta
Value Rank
A -0.53075 -0.40657 ….. 0.12417 17
B -0.31795 -0.61937 ….. 0.30143 11
C -0.31999 -0.61733 ….. 0.29734 14
D -0.31929 -0.61802 ….. 0.29873 12
E 0.07319 -1.01050 ….. 1.08369 2
F -0.51121 -0.42611 ….. 0.08510 18
G -0.40567 -0.53164 ….. 0.12597 16
H -0.52972 -0.20329 -0.67297 0.46967 9
J -0.54554 -0.40111 -0.45933 0.14444 15
K -0.70567 -0.64897 -0.05134 0.65432 5
L -1.26271 -0.43949 0.29623 1.55894 1
M -0.48581 -0.43611 -0.48405 0.04971 19
N 0.00709 -0.47994 -0.93313 0.94022 3
O -1.00220 -0.18923 -0.21454 0.81297 4
P -0.58641 -0.54692 -0.27264 0.31377 10
Q -0.13094 -0.55822 -0.71682 0.58588 7
R -0.52899 -0.69532 -0.18166 0.51366 8
S -0.34047 -0.22762 -0.83789 0.61027 6
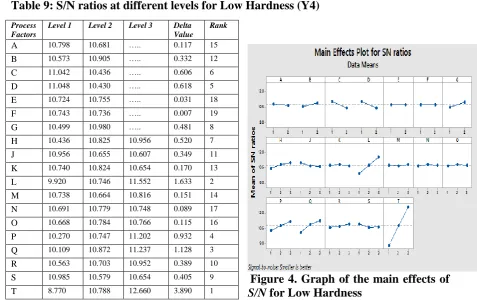
Table 9: S/N ratios at different levels for Low Hardness (Y4)
Figure 4. Graph of the main effects of
S/N for Low Hardness
As mentioned in the response table, the Taguchi method gives the rank of individual parameter and optimal level can also be determined from the response graph for respective quality characteristics. Since the quality characteristics are the lower the better type of characteristics, the maximum S/N ratio gives the optimum level for setting of process parameters [30, 31]. But the Taguchi method cannot judge and determine the effect of individual process parameters on the entire process. Therefore, analysis of variance (ANOVA) is used to identify the parameters which are significantly influencing the process and contributes comparatively more towards occurrences of persisting defects [27, 31].
7 ANOVA Analysis
The aim of the ANOVA tests is to look into the most significant parameter in green sand casting process that potentially affects the quality characteristics. The results of the ANOVA analysis of S/N ratio correspond to the response; persisting defects in this study are reported in Tables 10 to 13 respectively. This analysis is performed to the level of significance α=0.05, i.e. for a confidence level of 95%.This analysis classifies the green sand casting process parameters in order to influence on various persisting defects. The ANOVA is carried out using the ‘MINITAB 14’ software. The results of Taguchi and ANOVA analysis are summarized in Table 12 given below. As mentioned in the summary; there is a close match between the results obtained by Taguchi approach and ANOVA analysis. For example, as mentioned in the table for ANOVA analysis of shrinkage porosity, carbon equivalent (CE) and percentage of steel scrap in the charge mix are found most influential parameters with percentage contributions of about 42.7% & 22.3 % respectively. Whereas from the Taguchi analysis and according to delta value Process
Factors
Level 1 Level 2 Level 3 Delta
Value
Rank
A 10.798 10.681 ….. 0.117 15
B 10.573 10.905 ….. 0.332 12
C 11.042 10.436 ….. 0.606 6
D 11.048 10.430 ….. 0.618 5
E 10.724 10.755 ….. 0.031 18
F 10.743 10.736 ….. 0.007 19
G 10.499 10.980 ….. 0.481 8
H 10.436 10.825 10.956 0.520 7
J 10.956 10.655 10.607 0.349 11
K 10.740 10.824 10.654 0.170 13
L 9.920 10.746 11.552 1.633 2
M 10.738 10.664 10.816 0.151 14
N 10.691 10.779 10.748 0.089 17
O 10.668 10.784 10.766 0.115 16
P 10.270 10.747 11.202 0.932 4
Q 10.109 10.872 11.237 1.128 3
R 10.563 10.703 10.952 0.389 10
S 10.985 10.579 10.654 0.405 9
corresponding rank of these parameters is 1 & 2.Same observations are made in case of other persisting defects that are sand inclusion, blow hole,and low hardness.
Table10 ANOVA results for signal-to-noise ratio for Shrinkage Porosity (Y1)
Var Degre -es of Freed -om (DOF ) Sum of Squares (SS) Mean Squar e (MS) F
ratio P % Cont.
A 1 28.665 28.665
7
118.2 0 42.70813 B 1 0.0786 0.0786 0.32 0.6 0.117104
C 1 0.2039 0.2039 0.84 0.41
1
0.303784
D 1 0.0201 0.0201 0.08 0.78
8
0.029946
E 1 14.967 14.967
1
61.72 0.00 1
22.29902 F 1 5.9795 5.9795 24.66 0.00
8
8.908671
G 1 1.5724 1.5724 6.48 0.06
4
2.34267
H 2 0.4903 0.2451
5
1.01 0.44 1
0.730483 J 2 2.2582 1.1291 4.66 0.09 3.364422
K 2 0.2862 0.1431 0.59 0.59
6
0.4264
L 2 1.3704 0.6852 2.83 0.17
2
2.041716
M 2 0.4902 0.2451 1.01 0.44
1
0.730334
N 2 1.0407 0.5203
5
2.15 0.23 3
1.550507
O 2 0.9533 0.4766
5
1.97 0.25 4
1.420292
P 2 0.1769 0.0884
5
0.36 0.71 5
0.263558
Q 2 2.6462 1.3231 5.46 0.07
2
3.942491
R 2 1.4346 0.7173 2.96 0.16
3
2.137366
S 2 1.7334 0.8667 3.57 0.12
9
2.582539
T 2 1.7897 0.8948
5
3.69 0.12 4
2.666418 Erro
r
4 0.9701 0.5463 1.16
Total 35 67.127 100%
Table11 ANOVA results for signal-to-noise ratio for Blow Hole (Y2)
Var
Degre-es of Freed-om (DOF) Sum of Squares (SS) Mean Square (MS) F
ratio P % Cont.
A 1 0.2899 0.2899 0.67 0.46 0.15975
B 1 0.2329 0.2329 0.54 0.504 0.12834 C 1 9.9382 9.9382 22.92 0.009 5.476464 D 1 6.0333 6.0333 13.91 0.02 3.324662 E 1 1.4696 1.4696 3.39 0.139 0.809826 F 1 2.2046 2.2046 5.08 0.087 1.214849 G 1 81.8304 81.8304 188.68 0 45.0928 H 2 14.2898 7.1449 16.47 0.012 7.874422 J 2 20.0281 10.014 23.09 0.006 11.03652 K 2 1.0129 0.5065 1.17 0.399 0.558161 L 2 2.8563 1.4281 3.29 0.143 1.57397 M 2 0.1056 0.0528 0.12 0.889 0.058191 N 2 6.9267 3.4634 7.99 0.04 3.816971 O 2 2.0422 1.0211 2.35 0.211 1.125358 P 2 2.3742 1.1871 2.74 0.178 1.308307 Q 2 5.3887 2.6943 6.21 0.059 2.969454 R 2 0.0083 0.0042 0.01 0.99 0.004574 S 2 7.4392 3.7196 8.58 0.036 4.099386 T 2 15.2656 7.6328 17.6 0.01 8.412138
Error 4 1.7348 0.4337 1.30
Table 12 ANOVA results for signal-to-noise ratio for Sand Inclusion (Y3)
Var
Degre-es of
Freed-om (DOF)
Sum of Squares
(SS)
Mean Square
(MS)
F ratio P % Cont.
A 1 0.1388 0.1388 0.52 0.512 0.267954
B 1 0.8176 0.8176 3.05 0.156 1.578381
C 1 0.7958 0.7958 2.97 0.16 1.536296
D 1 0.8031 0.8031 3 0.158 1.550389
E 1 10.5693 10.5693 39.45 0.003 20.40409
F 1 0.0652 0.0652 0.24 0.648 0.125869
G 1 0.1428 0.1428 0.53 0.506 0.275676
H 2 1.3906 0.6953 2.6 0.189 2.684561
J 2 0.1267 0.0634 0.24 0.8 0.244595
K 2 3.154 1.577 5.89 0.064 6.088815
L 2 14.5971 7.2986 27.24 0.005 28.17978
M 2 0.0191 0.0095 0.04 0.965 0.036873
N 2 5.3063 2.6532 9.9 0.028 10.24384
O 2 5.128 2.564 9.57 0.03 9.899633
P 2 0.701 0.3505 1.31 0.365 1.353284
Q 2 2.204 1.102 4.11 0.107 4.254834
R 2 1.6486 0.8243 3.08 0.155 3.182632
S 2 2.5304 1.2652 4.72 0.089 4.884952
T 2 0.5897 0.2949 1.1 0.416 1.138419
Error 4 1.0717 1.0717 2.07
Total 35 51.7999 97.93
Table 13 ANOVA results for signal-to-noise ratio for Low Hardness (Y4)
Var
Degre-es of Freed-om (DOF)
Sum of Squares (SS)
Mean Square
(MS) F ratio P % Cont.
A 1 0.1229 0.1229 0.66 0.462 0.090509
B 1 0.992 0.992 5.34 0.082 0.730551
C 1 3.3011 3.3011 17.75 0.014 2.431069
D 1 3.4386 3.4386 18.49 0.013 2.53233
E 1 0.0086 0.0086 0.05 0.84 0.006333
F 1 0.0004 0.0004 0 0.966 0.000295
G 1 2.0847 2.0847 11.21 0.029 1.535261
H 2 1.7569 0.8784 4.72 0.088 1.293855
J 2 0.8577 0.4289 2.31 0.216 0.631646
K 2 0.1732 0.0866 0.47 0.658 0.127552
L 2 15.9915 7.9957 43 0.002 11.77681
M 2 0.1376 0.0688 0.37 0.712 0.101334
N 2 0.0484 0.0242 0.13 0.881 0.035644
O 2 0.0926 0.0463 0.25 0.791 0.068195
P 2 5.2142 2.6071 14.02 0.016 3.839956
Q 2 7.9504 3.9752 21.38 0.007 5.855009
R 2 0.9324 0.4662 2.51 0.197 0.686659
S 2 1.1164 0.5582 3 0.16 0.822164
T 2 90.8246 45.4123 244.23 0 66.88706
Errorr 4 0.7438 0.1859 0.55