Uninsured Children in the United States: An Investigation oflnpatient Mortality
By
Erin VanScoyoc
A Master's Paper submitted to the faculty of The University of North Carolina at Chapel Hill
In partial fulfilhnent of the requirements for The degree of Master of Public Health in
The Public Health Leadership Program.
Chapel Hill
2004
Uninsured Children in the United States: An Investigation of Inpatient Mortality
Length: 6552 words; 4 Tables
I
i--Uninsured Children in the United States: An Investigation of Inpatient Mortality Abstract
Objective: We examined whether uninsured children in the United States have an increased risk of inpatient mortality compared to children with private or Medicaid insurance.
Methods: The entire sample of pediatric discharges <=18 years excluding neonates from the National Inpatient Sample (NIS) database from 1997 to 2001 was used for this study. We calculated the inpatient mortality rate by dividing the weighted number of deaths over the five years of the study by the total weighted encounters, and used the Student t test to statistically compare the inpatient mortality rate of
uninsured children to children with private or Medicaid insurance. We also examined the inpatient mortality rate of children with two catastrophic diseases of childhood, congenital heart disease and cancer, and tested whether uninsured children with these conditions have an increased risk of inpatient mortality.
Results: Uninsured children have a significantly higher inpatient mortality rate than children with either Medicaid or private insurance. The all-cause inpatient mortality rate for uninsured children was 0.61, compared with an inpatient mortality rate of 0.39 for children with Medicaid insurance, and 0.36 for children with private insurance. This disparity in inpatient mortality rate was also observed in children with catastrophic diseases of childhood. Among children with congenital heart disease as the primary ICD-9 diagnosis at discharge, uninsured children had an inpatient mortality rate of 3.23, compared to an inpatient mortality rate of 2.65 in children with Medicaid insurance, and 2.02 among children with private insurance. Among children with malignant neoplasm as any ICD-9 diagnosis at discharge, uninsured children had an inpatient mortality rate of 1.69 compared to an inpatient mortality rate of 1.2 in children with private insurance. Children with Medicaid insurance had an inpatient mortality rate of 1.77.
Conclusions: Despite the progress made by the Medicaid expansion and the SCRIP program towards insuring children in the late 1990s, more than one in ten children in the United States remain uninsured. These children have an increased risk of inpatient mortality compared to children with private or Medicaid insurance. Whether the increased mortality rate among uninsured children is due to lower access to care, a less safe environment, or poorer inpatient care, in light of our results it is important to continue the progress we have made toward insuring all children in the United States.
L
,---Uninsured Children in the United States: An Investigation of Inpatient Mortality
Introduction
In 1992, The Office of Technology Assessment issned a report entitled "Does Health Insurance
Make a Difference?"1 The summary findings of that report concluded that there was little systematic
evidence that lack of insurance results in adverse health outcomes. Just ten years later, a review of the
literature on health insurance and health outcomes for the Kaiser Commission on Medicaid and the
Uninsured found 90 studies published between 1991 and 2001 examining the association between health
insurance coverage or medical care use and health outcomes2 From these studies, the review concluded that there is now strong evidence that the uninsured have worse health outcomes than the insured, both in
terms of all-cause morbidity and mortality, and morbidity and mortality from specific conditions.
Although children under age 18 comprise more than 20% of the uninsured population in the United
States, the large majority of research on insurance status and health outcomes has studied the adult
population exclusively.
This paper first reviews the research on insurance status and health outcomes in adults and
children. Then, using national hospital discharge data, the paper examines the inpatient encounters of
uninsured children compared to privately and publicly insured children. Specifically, five years
(1997-2001) of the Healthcare Cost and Utilization Project (HCUP) Nationwide Inpatient Sample (NIS) data are
utilized to address four key questions:
• What are the demographic characteristics of uninsured inpatient encounters in the pediatric
population?
• What are the patterns of hospital resource utilization of uninsured children compared to privately
and publicly insured children?
• Do uninsured children have a higher all-cause inpatient mortality rate than privately and publicly
insured children?
I
• Do uninsured patients have an increased mortality rate compared to insured children for
catastrophic diseases of childhood including congenital heart disease and cancer?
The Number of Uninsured Children in the United States
The Current Population Survey (CPS) Annual Demographic Supplement, conducted by the U.S.
Census Bureau, provides a yearly estimate of the number of uninsured Americans. In 2002
approximately 41.6 million Americans, or 15.2% of the total population, were uninsured. Overall, the
number of the uninsured have been growing in recent years, increasing by 2.5 million between 2001 and
2002, and 1.4 million between 2000 and 2001. Of the more than 40 million Americans who were
uninsured during 2002, 8.5 million were under age 18. According to these figures, 11.6% of the
population under 18 was uninsured. Unlike the overall increase in the number of uninsured Americans,
the number of uninsured children and adolescents has decreased steadily from a high of 11.1 million in
1998. (Figure 1) This decrease has been attributed to the expansion of Medicaid and the implementation
I
of the State Children's Health Insurance Program (SCHIP).
[Insert Figure 1 about here]
The CPS is designed to assess the percentage of the population who were uninsured for the entire
year. Although there has been some research suggesting that the CPS overestimates the number of those
who were uninsured continuously throughout the year, the CPS data is most certainly an underestimate of
those who were uninsured at any time throughout the year. In 2003 the Congressional Budget Office
issued a report on the duration of uninsured spells in the American population based on a comparison of
1998 data from three large federally sponsored national surveys: the Survey of Income and Program
Participation (SIPP), the Medical Expenditure Panel Survey (MEPS), and the National Health Interview
Survey (NHIS). This report found that at least half of those who had no health insurance for some portion
adults were uninsured for the entire year in 2002, up to 15 million children had no health insurance for
some portion of the year.
Although CPS estimates are the most widely cited, the NHIS and MEPS have also been studied
for youth insurance rates. NHIS data also shows a decline in the number of uninsured children and
adolescents in recent years. NHIS estimates that the number of the uninsured under 18 years old has
decreased from 13.9% of the population in 1997 to 10.8% of the population in 20014 NHIS data defines
uninsured as those who are uninsured at the time of the interview. The Agency for Health Care Research
and Quality's MEPS data also noted a decline in the number of the uninsured under 18 years old5 MEPS
data, which defines uninsured as uninsured from January until the date of the survey, estimates that 12.9%
of children and adolescents under 18 years old were uninsured in 2002.
Demographic Characteristics of Uninsured Children
The uninsurance rate differs significantly for children and adolescents of different races, ages,
and family income levels. According to CPS data, of the 8.5 million children and adolescents under age
18 without health insurance in 2002, 29% were living in families with an income less than 100% of the
federal poverty level. This means that among poor children and adolescents, 21.3% had no health
+-insurance for the entire year in 2001. Near-poor children and adolescents, whose family income was
~-between 100 and 125% of the federal poverty level, had similar rates of uninsurance to poor children and
adolescents (22.9% ). Between 1997 and 2002, the numbers of uninsured poor and near-poor children
decreased, due to an increase in Medicaid and SCRIP coverage.
[Insert Figure 2 about here]
Health Insurance Coverage by Race/Ethnicity in Children
Hispanic, black, and Asian children are more likely to be uninsured than non-Hispanic white
children and adolescents. According to 2002 CPS data, 22.7% of Hispanic children were uninsured,
children. NHIS data confirms these trends. According to NHIS data, in 2001 24.1% of Hispanic children,
compared to 10.5% of black children and 7.2% of non-Hispanic white children4 Between 1997 and 2001,
the percentage of uninsured children in all race/ethnicity categories decreased.
[Insert Figure 3 about here]
Health Insurance Coverage by Age in Children
Older children (ages 12-17) are more likely to be uninsured than younger children, a fact that may
be partially contributable to the structure of Medicaid coverage. In most states, younger children can
qualify for Medicaid coverage with a higher family income than older children. Thus, children may
"grow out" of Medicaid coverage, even if their family income remains stable. According to CPS 2002
data, 12.9% of children ages 12-17 years were uninsured, compared to 11.0% of children ages 6-11 years,
and 10.9% of children under 6.
[Insert Figure 4 about here]
I
Insured Children
According to CPS 2002 data, 23.9% of children and adolescents <18 were covered by Medicaid,
and 67.5% were covered by private insurance. Medicaid coverage eligibility varies from state to state,
i
but must conform to minimum federal requirements. By these federal mandates, states are required to t--
t-cover children under six with family incomes under 133% of the federal poverty level, and children
between 6 and 18 with family incomes under 100% of the federal poverty level. In 2002,41.2% of black
children were covered by Medicaid, compared to 37.3% of Hispanic children, 18.1% of Asian children,
and 15.5% of non-Hispanic white children.
Children's Health Insurance: Public Health Insurance 1997-2001
The State Children's Health Insurance Program (SCRIP) was enacted by Congress in 1997. The
program was designed to bring health insurance to an estimated 40 percent of the 10 million children who
the states. The program covers children whose families have incomes above that required for Medicaid
eligibility, but below 200% to 350% of the federal poverty level (states establish their own
income- r--eligibility requirements). States have flexibility in designing their SCHIP programs. They may either
choose to expand their Medicaid program, develop a separate program, or design a program that is a
combination of both.
States began enrollment in their SCHIP programs at different times. Most states launched their
programs in 1998, although some states began enrollment earlier, and some states did not begin
enrollment until 1999. Enrollment in SCHIP throughout the country increased from 1.0 million children
enrolled at some point throughout the year in 1998, to 2.0 million children enrolled in 1999, and 3.3
million enrolled in 2000. During 2002, 5.3 million children were enrolled in SCHIP for at least some part
of the year6 Nearly all SCHIP programs have developed simple application and enrollment processes for
their SCHIP programs, including a joint application for SCHIP and Medicaid.
I
Looking more closely at the changes in health insurance rates among children between 1998 and
..
F2001, the impact of SCHIP and Medicaid expansion on the numbers of uninsured children are evident.
Between 1998 and 2000 there was a 0.7% increase in the rate of Medicaid and SCHIP program
enrollment among all children, and a 2.2% increase in enrollment of low-income children ( <200% of the
;:---federal poverty level). Between 2000 and 2001, the increase in enrollment was even more pronounced. L
There was a 1.8 percent increase in rates of enrollment of all children in Medicaid and SCHIP programs,
and a 2.9% increase in the rate of enrollment of low-income children. The number of uninsured children
decreased from approximately 10 million pre-SCHIP, to 8.5 million in 2002. This decrease is substantial,
but falls considerably short of SCHIP' s goal of insuring 4 million children. The decrease in
employer-sponsored coverage of children may have offset some of the gains made by SCHIP between 1997 and
2002. Despite the progress made by Medicaid expansion and SCHIP, more than one in ten children in the
Mortality in Children
The Centers for Disease Control (CDC) collects mortality data for the United States, and makes
this data publicly available through the National Vital Statistics Reports. Table 1 shows the 7 leading
causes of death among children ages 1 month through 19 years in 2001 according to the National Vital
Statistics Reports.' Injury through accidents, assaults, or suicide accounted for 48.1% of all deaths among
children older than 1 month in 2001. The leading 4 non-injury causes of death accounted for an
additional 22.0% of all deaths among children older than 1 month. Congenital malformations accounted
for 7.6% of deaths, malignant neoplasms accounted for 6.2% of all deaths, SIDS accounted for 5.4% of
all deaths, and heart disease accounted for 2.4% of all deaths in children ages 1 month- 19 years.
Inpatient Mortality in Children
Although good data exists on the causes of childhood mortality, far less is known about the
locations where children die. Feudtner et al. studied this question through a retrospective case series of
all deaths among children aged 0 days to 24 years in Washington state from 1980 and 1998 using death
certificates and census data8 This study found that, overall, 52.0% of all childhood deaths occur in the
hospital. Deaths from injury and SIDS were much less likely to occur in the hospital than deaths from
complex chronic conditions, including cardiovascular diseases and cancer. The study found that 21.6% of r- J-deaths from SIDS occur in the hospital and 28.7% of J-deaths from injury occur in the hospital, compared
with 74.8% of deaths from complex chronic conditions. Among the complex chronic conditions, children
with cardiovascular disease were more likely to die in the hospital than children with cancer. In single
institution studies of death in childhood cancer, 50% of deaths have been observed to occur in the
hospital.9•10 A second study by Feudtner et al. examined the demographics of children who died in 60
children's hospitals using discharge data from the National Associationof Children's Hospitals and
Related Institutions.11 This study found that, of children ages 1 month to 24 years who die in hospitals of
[Insert Table 1 about here]
Insurance Status and Mortality
To complete a systematic review on insnrance status and mortality, I searched Medline using
term MeSH term "medically uninsured", first limiting the search to review articles. I located a 2002
review of the literatnre on health insnrance and health outcomes for the Kaiser Commission on Medicaid
and the Uninsured. This review was based on a search of Medline and EconLit for studies published
between 1991 and 2001 examining the association between health insnrance coverage or medical care use
and health outcomes2 To update this review, I searched Medline using the MeSH term "medically
uninsnred", limiting the search to studies published between 2002 and 2004, I reviewed these articles
(n=630) for relevance to the question of insnrance status and mortality in children or adults. From these
studies, I found no additional studies on insurance status and mortality in children and adults published
since 2002.
I
Insurance status and all-cause mortality in adults
A number of studies have examined insurance status and all-cause mortality in adults, and have
found that the uninsured have a higher risk of dying than patients with private insurance· A 1993 study by
Franks eta!. followed adults older than 25 years in the National Health and Nutrition Survey for 12-16
years. This study found that those who reported that they were uninsured at the time of the initial
interview had a higher subsequent mortality. By the end of the follow-up period, 9.6% of the insnred
compared to 18.4% of the uninsured had died. 12 A 1994 study by Sorlie et a!. supported this finding of
higher all-cause mortality among the uninsured. Sorlie linked CPS data on insurance status of adults ages
25-65 years to deaths in the National Death Index to compare the mortality of the uninsured to the insnred
over a five-year follow-up period. Sorlie found that the uninsured compared to those with
employer-sponsored insurance had a relative risk of mortality of 1.2 for white men and 1.5 for white women and
L
The relationship between inpatient mortality and insurance status has also been investigated in ;___ adults. A 1991 study by Hadley et a!. examined the discharge abstracts of 592,598 patients for
information on insurance status and mortality. In this study the uninsured had significantly higher odds of
inpatient mortality in 12 of 16 age-sex-race specific nonelderly population cohorts14 A 2001 study by
Bradbury et a!. also examined hospital discharge data for a relationship between insurance status and
mortality. This study examined 29,397 hospital encounters of patients ages 18-64, and found that the
uninsured had a significantly higher risk of inpatient mortality compared to patients with private
insurance.15
Insurance status and all-cause mortality in children
Compared to studies in the adult population, there have been fewer studies on the relationship between insurance status and health outcomes in children. No research has studied outpatient all-cause
mortality in children, and Hadley et al.'s 1991 study of inpatient all-cause mortality is the only study that
specifically examined inpatient mortality in children.11 Hadley studied the discharge abstracts of 82,162
children, and found a higher rate of in-hospital death for uninsured children compared with privately
insured children after adjusting for severity of illness, hospital characteristics, and type of community.
Uninsured white male children had a relative risk of in-hospital mortality of 1.46 compared with privately
insured white male children, uninsured black male children had an increased relative risk of 1.88,
uninsured white female children had an increased relative risk of 2.37, and uninsured black female
children had an increased relative risk of 2.56.
Additionally, there have been studies of adverse birth outcomes and infant mortality in uninsured
neonates. These studies have shown an increased risk of mortality and adverse birth outcomes for
uninsured compared to privately insured newborns. One recent study found that compared to privately
insured babies, uninsured babies had a higher relative odds of dying (R0=1.4-1.8).16 Another study
found that uninsured newborns had a higher relative risk of adverse birth outcome, including long stay,
Insurance status and mortality from specific conditions in adults
Both cancer and cardiovascular disease outcomes have been examined in relation to insurance
status. Two recent studies found that uninsured patients were more likely to be diagnosed with advanced
stage breast cancer, and were more likely to die from breast cancer within the study follow-up period than
insured patients.18'19 A recent study of colon cancer fonnd that uninsured patients were more likely to die
within 36-48 months than patients with insurance?0 Studies focusing on cardiovascular disease have also
found higher mortality among those without insurance compared to patients with private insurance21'22 A
study on acute trauma treatment and mortality in Massachusetts found that uninsured patients were more
likely to die in the hospital from trauma than privately insured patients.23
Insurance status and mortality from specific conditions in children
The relationship between insurance status and mortality from specific conditions such as cancer
and heart disease in children has not been investigated. The relationship between trauma mortality and
insurance status has also not been investigated in children, although one study did find a significant
relationship between low socioeconomic status and increased pediatric trauma mortality.24
Administrative Data
The value of administrative data for investigating a wide range of topics has been increasingly
recognized in recent years. 25'26'27'28 Collected primarily for payment purposes, hospital discharge abstract
data typically include basic demographic information about the patient, selected diagnoses and procedures
associated with the hospital stay, admission source, discharge status, charges, and length of stay. There is
a large body of research concerning the advantages and disadvantages of administrative data?9 Some of
the advantages of administrative data for population-based studies of health and health care include the
large sample size of national administrative data sets and the timeliness of administrative data.
This study uses the Nationwide Inpatient Sample (NIS) database, the largest inpatient care
database in the United States. Over the past ten years, studies in the pediatric population have used NIS
data to report on trends and mortality for rare conditions such as Kawasaki Disease30 and hypoplastic left
The NIS database provides many advantages for examining the association between childhood mortality
and insurance status. Most significantly, it is the largest database with all-payer information in the United
States and provides a nationally representative sample. As such, it allows study of rare events, such as
mortality in uninsured children. The NIS also has the advantage of providing yearly data, making it
possible to aggregate data over time or track trends in data over time. For this study, we used NIS data
combined over five years, from 1997-2001, to understand inpatient mortality in children by insurance
status.
Methods
Data Source
The Healthcare Cost and Utilization Project (HCUP) is a group of healthcare databases assembled
through a Federal-State-industry partnership and sponsored by the Agency for Healthcare Research and
Quality (AHRQ) for the purposes of collecting hospital discharge abstract data for research. HCUP
collects hospital data on all inpatient discharge abstracts from participating states, places it in a uniform
format, and makes this data available for research as the HCUP State Inpatient Database (SID). In 2001,
33 states contributed inpatient hospital data to HCUP, an increase from 22 states in 1997.
The Nationwide Inpatient Sample (NIS) includes data from a stratified probability sample of ~-- f-hospitals in the SID. This sample of f-hospitals included in the NIS accounts for approximately 20% of all
community hospitals in the United States. Community hospitals are defined by the American Hospital
Association (AHA) and include non-federal short-term general and specialty hospitals open to the general
public. Teaching hospitals and pediatric hospitals are included in this definition of community hospitals.
Long-term hospitals, psychiatric hospitals, and alcohol/chemical dependency treatment facilities are
excluded. To come up with the stratified probability sample for the NIS, all of the hospitals in the AHA
annual survey of hospitals are divided into strata on the basis of five hospital characteristics: bed size,
teaching status, rural/urban location, geographic region, and ownership/control. Hospitals from states
selected hospitals is included in the NIS. The data in the NIS is then weighted to indicate the number of
discharges that the sample discharge represents among all US hospital discharges in that stratum. In 2001
the NIS included 421,207 unweighted discharges (2,121,656 weighted discharges) for children <=18
years old excluding neonatal visits.
Study Sample and Definitions
The entire sample of pediatric ( <=18 years old excluding neonatal) discharges was used for this
study. The data was aggregated over five years (1997-2001) to increase the sample size. Each discharge
abstract supplies patient demographic characteristics (age, gender, and race/ethnicity), primary expected
payment source, vital status at discharge, 15 diagnosis codes and procedure codes, and measures of
resource use associated with the hospitalization. Insurance is divided into four primary payer groups:
Medicaid, commercial or private insurance, self-pay, and "other" (Medicare, CHAMPUS, Title V,
worker's compensation, and uo charge). For this study, the self-pay payer group was considered
uninsured. There is no direct measure of socioeconomic status available, although patients are grouped
into 4 annual income categories based on zip code of residence. The race categories in the NIS include
white, black, Hispanic, Asian or Pacific Islander, Native American, and other. For this analysis, the
categories white, black, Hispanic, and other are used.
The NIS data contain International Classification of Diseases, Ninth Revision, Clinical
Modification (ICD-9) discharge diagnosis and procedure codes. In this study, disease categories were
defined using ICD-9-CM diagnosis codes aggregated into clinically meaningful groups. Malignant
neoplasms were defined as a group of ICD-9 codes including: 140-208, 230-234, 284, 287, 288.0-288.2.
Congenital heart disease was defined as a group of ICD-9 codes including: 745, 746, 747. These
groupings were used by Parker and Schoendorf in their 2000 study examining hospital discharge data for
ambulatory care-sensitive conditions and non ambulatory care-sensitive conditions. 33
Statistical Analysis
The number of cases in the NIS were multiplied by the weight to the discharges in the universe of
based on five-year averages of weighted 1997-2001 data. fupatient death rates were calculated by
dividing the weighted number of deaths over five years by the total weighted encounters. For specific
conditions, inpatient death rates were calculated by dividing the weighted number of deaths over five
years for that condition by the total weighted encounters for that condition.
In this paper, descriptive continuous data are presented as a mean and median as appropriate.
Categorical variables were compared using a Pearson
X
test. Continuous variables were compared usinga Student t test. A P value of <0.05 was considered statistically significant. Statistical analyses were
performed using SAS Version 8.02 (SAS fustitute, Cary, NC).
To calculate statistics, including variances, from the NIS data, it is necessary to take into account
the sampling design and sample discharge weights. Unweighted statistics that do not account for the NIS
sample design give biased results. Specifically, the confidence intervals of the results are artificially
narrow, and the p values are artificially small, potentially indicating a significant relationship where none
exists. Commonly used statistical software packages, including SAS Version 8, have procedures for
calculating simple statistics based on data from complex sampling designs. It is important to note that the
statistical results of this paper do not account for the sampling design and sample discharge weights of the
data. Thus, the significance of the results may be overstated. We are currently in the process of
correcting for this error, and will submit edited tables once they are completed.
Results
Utilization of Hospital Inpatient Services by Uninsured Children
From 1997 to 2001, uninsured children accounted for 5.32% of all hospital discharges for
children 18 years old or younger (excluding neonates), or 112,814 weighted encounters per year as an
average of the total uninsured weighted encounters for each year from 1997 to 2001. Children with
Medicaid insurance accounted for 37.88% of pediatric hospital discharges, and children with private
accounted for 2.60% of pediatric hospital discharges. Uninsured children admitted to the hospital were
significantly older, on average, than children with Medicaid or private insurance. The mean age of
uninsured children admitted to the hospital was 8.14, compared to 7.72 for children with private
insurance, and 5.49 for children with Medicaid insurance. Most of the uninsured children admitted to
hospitals were white (35.94%), followed by Hispanic (17.02%) and black (14.38%) children. Uninsured
children admitted to hospitals were more likely to be white, and less likely to be black or Hispanic than
children with Medicaid insurance. The family income of uninsured children admitted to hospitals, based
on the median income in their zip code of residents, was significantly higher than the family income of
children with Medicaid insurance, and significantly lower than the family income of children with private
insurance. Uninsured children were significantly less likely to be admitted to urban hospitals (82.08%)
than children with either private (86. 78%) or Medicaid insurance (83.13% ). Uninsured children were also
significantly less likely to be admitted to teaching hospitals (54.68%) compared with children with
Medicaid (57.82%) or private insurance (57.03%).
[ Insert Table 2 about here]
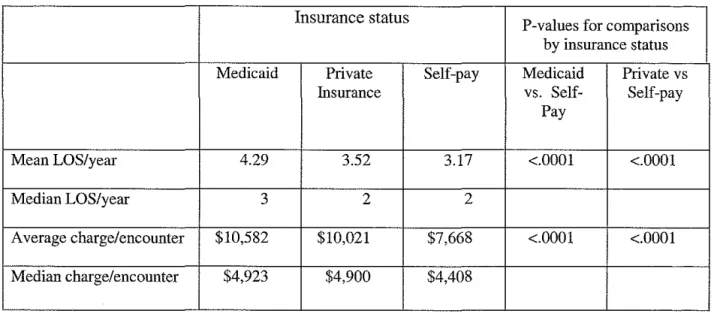
Inpatient Resource Utilization
Length of stay and charges were lowest for uninsured children, and highest for children with
Medicaid insurance. The mean length of stay for uninsured children was 3.17 days, compared with 3.52
days for children with private insurance and 4.29 days for children with Medicaid insurance. The average
charge per encounter for uninsured children was $7,668, compared with $10,021 for privately insured
children and $10,582 for children with Medicaid insurance. The median charge per encounter reflects the
same pattern. For uninsured children the median charge per encounter was $4,408, compared to $4,900
for children with private insurance and $4,923 for children with Medicaid insurance.
All-Cause Inpatient Mortality
Uninsured children had a significantly higher inpatient mortality rate than children with either
Medicaid or private insurance. The inpatient mortality rate for uninsured children was 0.61, compared
with an inpatient mortality rate of 0.39 for children with Medicaid insurance, and 0.36 for children with
private insurance.
[Insert Table 4 about here]
Inpatient Mortality from Specific Conditions
We examined inpatient mortality by insurance status for two leading disease causes of death in
children. The disparity in inpatient mortality rate between uninsured children and insured children was
observed in children with congenital heart disease and to a lesser extent in children with cancer. In
children with congenital heart disease as the primary ICD-9 diagnosis at discharge, the inpatient mortality
rate among uninsured children was 3.23, compared with a mortality rate of 2.65 among children with
Medicaid insurance, and 2.02 among children with private insurance. Uninsured children also had a
higher inpatient mortality rate if congenital heart disease was listed as any, not just the primary, ICD-9
diagnosis at discharge. The inpatient mortality rate among uninsured children was 2.18, compared to an
inpatient mortality rate of 1.92 among children with Medicaid, and 1.86 among children with private
health insurance.
In children with malignant neoplasm as any ICD-9 diagnosis at discharge, the inpatient mortality
rate of uninsured children was significantly higher than the mortality rate of privately insured children.
Among children with malignant neoplasm as any ICD-9 diagnosis the inpatient mortality rate for
uninsured children was 1.69, compared to an inpatient mortality rate for privately insured children of 1.2.
Children with Medicaid insurance had the highest mortality rate, 1.77.
This pattern among children with malignant neoplasm as any ICD-9 diagnosis was not
L
uninsured children had an inpatient mortality rate of 1.55, compared to a mortality rate of 1.79 for
children with private insurance and 2.72 for children with Medicaid insurance.
Discussion
Using a large contemporary all payer database, we found a clear association between insurance
status and inpatient mortality rate among children in the United States. Overall, uninsured children have a
significantly higher mortality rate than children with either private or Medicaid insurance. We found that
uninsured children are 69% more likely to die during an inpatient hospital stay than privately insured
children, and 56% more likely to die during an inpatient hospital stay than children with Medicaid
insurance. Based on the increased inpatient death rate of uninsured children compared to children with
Medicaid insurance, there are an estimated 237 excess deaths per year among uninsured children in the
United States.34 Some of these excess deaths occur in children with cancer or congenital heart disease.
There are many possible reasons for this inpatient mortality disparity between uninsured and
insured children. Numerous studies in adults and children have shown that the uninsured have poorer
access to health care services.35•36 Overall, the uninsured are less likely to have a regular source of care,
and are less likely to receive preventive services than the insured. 37•38 Additionally, the uninsured are
more likely to delay seeking care or forego care than the insured39.4° Once they do obtain care, they are
~·--L
less likely to obtain appropriate medications and procedures for their conditions.41 Poorer access to health
care and reluctance to access health care due to lack of insurance could lead to important delays in
seeking health care for children with life-threatening diseases or injuries. Hadley et a!. reported that
compared to children with private insurance, uninsured children ages 1-17 were more likely to be
admitted for a condition with a higher expected risk of death and were in more need of urgent care.14 In
this study we were unable to control for severity of condition on admission due to the limits of
administrative data, and thus were unable to fully assess the role access to care may have played in the
In addition to lower access to health care, the increased risk of inpatient death among uninsured
children could he the result of a confounding factor such as lower socioeconomic status. To control for
socioeconomic status in this study, uninsured children were compared to both privately insured children
and children with Medicaid insurance. The socioeconomic status of uninsured children is higher than that
of children with Medicaid, and lower than that of children with private insurance. This study's finding
that uninsured children have a significantly higher inpatient mortality rate than children with either
Medicaid or private insurance indicates that socioeconomic status is not the sole force at play in the
excess deaths among uninsured children. An alternate method for assessing the impact of socioeconomic
status would have been to control for median income in patients' zip codes of residence. This would be a
useful area of future study.
There is a possibility that a characteristic of uninsured children other than socioeconomic status,
such as poorer safety of their environment or living further from a hospital, could be a factor in the
increased inpatient mortality in uninsured children. In a study of adults and adolescents over age 16 in
motor vehicle accidents, Clyde et a!. found that uninsured patients were approximately twice as likely to
have been unrestrained than patients with any kind of insurance. Clyde hypothesizes that risk-taking
individuals may be less likely to buy insurance voluntarily and may be more likely to place themselves
and their families in dangerous situations. As an additional hypothetical consideration, if a terminally ill
child's home is considered unstable, he or she may be more likely to cared for in the hospital than at
home at the end of life, increasing the inpatient mortality rate for uninsured children.
Finally, it is possible that uninsured children receive less aggressive inpatient care, or inpatient
care of lower quality, than insured children. In this study, uninsured children do have significantly
shorter inpatient stays and significantly lower charges than children with either private or Medicaid
insurance. However, severity of illness is not controlled for in these results. Hadley et a!. attempted to
control for condition on admission in examining the mortality disparity between uninsured and insured
children and adults.14 Hadley found that even after controlling for Risk-Adjusted Mortality Index on
i
!
r
admission, uninsured children ages 1-17 years old had a significantly higher risk of inpatient mortality
than insured children.
To better understand the disparity in inpatient mortality between insured and uninsured children,
this study examined inpatient mortality from two catastrophic diseases of childhood: malignant
neoplasms and congenital heart disease. Together, these diseases account for 19% of all non-injury
deaths among children.7 Malignant neoplasms and congenital heart disease are complex, chronic diseases
in childhood. Treatment is often characterized by multiple hospitalizations, long inpatient stays, and high
inpatient resource utilization. More than fifty percent of children who die from these diseases die in the
hospital. This study examined whether the disparity in all-cause inpatient mortality between uninsured
and insured children could be observed in cancer and congenital heart disease.
Uninsured children with congenital heart disease had a higher risk of inpatient death than children
with either Medicaid or private insurance. The disparity in risk was more pronounced if congenital heart
disease was the primary ICD-9 diagnosis than if congenital heart disease was any ICD-9 diagnosis.
Assuming that coding of congenital heart disease as the primary ICD-9 diagnosis is more likely for the
first admission than in subsequent admissions for congenital heart disease, this inpatient mortality
disparity can be viewed in light of access to care issues among the uninsured. Once a child is admitted to
the hospital with a catastrophic condition such as congenital heart disease, he or she is "in the system."
Thus, disparities in severity of condition as a result of access to care between the uninsured and the
insured could be more pronounced for the first hospital admission for a catastrophic condition than for
subsequent admissions.
The pattern is different for children with malignant neoplasms. For these children, there was a
significant disparity in inpatient mortality rate between the privately insured and the uninsured only if
malignant neoplasm was any ICD-9 diagnosis. This disparity was not evident if malignant neoplasm was
the primary ICD-9 diagnosis. Working under the assumption that coding for malignant neoplasm as any
ICD-9 diagnosis is more likely if a child is admitted for complications of cancer, an interpretation of this
the privately insured. This finding, however, may be confounded by socioeconomic status, as children
with Medicaid insurance had a higher inpatient mortality rate than uninsured children.
This study has made a contribution to the literature in finding a significantly increased risk of
inpatient mortality among uninsured children compared to children with any insurance, and in finding that
this disparity in inpatient mortality is evident in two catastrophic diseases of childhood. Hadley et a!.' s
1991 study on the comparison of uninsured and privately insured hospital patients is the only other study
specifically examining inpatient mortality in a population of uninsured children. Our study confirms,
updates, and expands Hadley's findings of increased inpatient mortality in uninsured children. Hadley
used data from 82,162 discharge abstracts for children ages 1-17 submitted to the Commission on
Professional and Hospital Activities in 1987. We used NIS data from 1997 to 2001, with an average of
421,207 patient encounters per year for children 18 years or younger, excluding neonates. This is the
largest number of pediatric encounters that have ever been used to examine inpatient mortality and
insurance status. In addition to the large sample size, other advantages of using the NIS sample include
the ability to weight the data to give national estimates, and the fact that the NIS is an all-payer database
including documentation of insurance status. This study is the first study to find an increased risk of
inpatient mortality in uninsured children with catastrophic diseases of childhood, including congenital
heart disease and malignant neoplasm.
Limitations
This study used national discharge data from the NIS. Although administrative data has
significant advantages for studying disparities in inpatient mortality between uninsured and insured
children, there are a number of limitations as well. Administrative data is secondary data, and is only as
good as the discharge coding it derives from. This coding should be very reliable for expected payer
status and mortality, but may be subject to errors in coding for diseases27 Because childhood cancer and
heart disease are clear, catastrophic diseases of childhood, coding for these diseases is more reliable than
coding for less clearly defined diseases. Additionally, data from the NIS does not provide information
j L
f
--L
I
'
about severity of condition on admission, and this was not controlled for in this study. Thus, it was not
possible to discern whether the increased inpatient mortality rate among uninsured children was
attributable to increased severity of condition on admission.
An additional limitation of the study is the methodology for calculating the inpatient mortality
rate. The mortality rate calculated in this study is a ratio of weighted deaths to weighted discharges over a
period of five years. Thus the mortality rate in this study is not a ratio of deaths to number of individuals,
but is a ratio of deaths to number of hospital encounters. Individuals may have more than one hospital
encounter per year. If uninsured individuals systematically have fewer hospital encounters than insured
individuals, this may result in an overestimation of the mortality disparity between uninsured and insured
individuals as calculated in this study.
Another limitation is the small number of unweighted deaths for cancer and congenital heart
disease among uninsured children. Even studying inpatient deaths over five years, the number of
unweighted deaths among the uninsured for both diseases were <50 accumulated over five years.
Finally, in this study we examined two catastrophic diseases in childhood, cancer and congenital
heart disease, and found that the disparity in inpatient mortality between insured and uninsured children
was present in congenital heart disease, and to a lesser extent in children with cancer. However, cancer
and congenital heart disease account for only a small percentage of deaths in uninsured children. This L
study has made a significant contribution to the literature in finding that the disparity in inpatient
mortality between insured and uninsured children is evident in two catastrophic diseases of childbood.
Ultimately, however, we have located only a small percentage ofthe estimated 237 excess deaths among
uninsured children in examining these two chronic conditions.
Future Research
To better understand the true policy implications of the disparity in inpatient mortality between
insured and uninsured children, we need to better characterize the conditions that account for this
disparity. Future research is needed to examine whether the disparity in inpatient mortality is present in
infant death syndrome, homicides, and suicides) or whether certain causes of death account for a large
percentage of the disparity. A useful direction for future research would be to utilize the methodology of
this study to examine these additional leading causes of death in children, ultimately providing a more
complete picture of the conditions responsible for the disparity in inpatient mortality among uninsured
children. Additional studies using data that allow for statistical control for severity of condition on
admission to the hospital would also be useful in further defining this disparity.
Our study finds that increased inpatient mortality in uninsured children is a problem, and that this
problem is independent of the socioeconomic status of these children. Over the past seven years the
SCHIP program has made significant strides towards decreasing the percentage of uninsured children in
the United States. However, even after this progress, more than one in ten children in the United States
remain uninsured. Whether the increased mortality rate among these uninsured children is due to lower
access to care, a less safe environment, or poorer inpatient care, it is important to continue the progress
we have made toward insuring all children in the United States.
I
l
FIGURES AND TABLES
Figure 1. Number of uninsured under 18 (CPS data)
12~---.
10
8
6
4
2
0
'97
'98
'99
'00
'01
'02
25
20
15
10
5
0
Figure 2. Uninsured Children and
Adolescents by Family Income: CPS 2002
20.1
All
Poor
Near-Poor
Figure 3. Percentage uninsured <18 by race/ethnicitiy: NHIS data
30
25
....
"0 20
~
"
-•-Total"'
c·c
15
"
c
"'
e
"'
10a_
-11-Hispanic X
='!---==-=-=
!¥( ~Non-Hispanic -*-Black White..
-
....
5
0
'97 '98 '99 '00 '01
r
12
to
17
6
to
11
<6
Figure 4. Uninsured Children by Age:
CPS 2002
9.5
10
10.5
11
11.5
12
12.5
13
13.5
Percent
~
Table 1 Deaths and percentage of total deaths for 10 leading causes of death in selected age groups; National Vital Statistics 2001
Total· Aoe 1 month . 19 ve.a'-' • ofne"h Pe,cent of Total
All causes 35,060 100.0
:( Y85-Y86) 12,067 34.4
Assault (I , X85-Y09, Y87 .1) 2,919 8.3
L \ '.'UU·'.'YY) 2,656 7.6
,160 6.2
SIDS (R95) ,047 5.8
Suicide (i ,Y87.0) ,883 5.4
; of the heart n00-11 L 113, 120-51) 844 2.4
A2e 28 Davs- 11 Cause of Death Number Percent of Total
All causes 9,303 100.0
SIDS 2,047 22.0
1,638 17.6
871 9.4
; of the ·system(] 405 4.4
1) 312 3.4
Assault 279 - 3.0
A oe 1-4 Yea,.< rame of Death P"cent of Total
All causes 5,107 100.0
1,714 33.6
557 10.9
Malienant 420 8.2
Assault 415 8.1
; of the heart 225 4.4
tand l (JI0-18) 112 2.2
Aoe 'i-9 Yea,.<' rm"e of Death ITrD- P"'cent of fotal
All causes 3,093 100.0
1,283 41.5
493 15.9
182 5.9 r
+--Assault 137 4.4
Di<ea<es of the heart 98 3.2
; (DOO:D48) 52 L7
A•e 10-14 Years: Cause of Death Percent of fotal
All causes 4,002 100.0
1,553 38.8
Malionant 515 12.9
Suicide 272 6.8
194 4.8
Assault 189 4.7
Diseases of the heart 174 4.3
Age 15-19: Cause
-=-
Percent of TotalAll causes 100.0
6,646 49.0
Assault 1,899 14.0
Suicide 1,611 11.9
732 5.4
; of the heart 347 2.6
Table 2. Characteristics of Discharges of Pediatric Patients( <=18 years excluding neonatal)
A vera_ged annual estimates ( 1997-2001).
Insurance status P-values for comparisons
by insurance status
Medicaid Private Self-Pay P-value P-value
Insurance Medicaid vs Private vs
Self-pay Self-pay
Total weighted encounters/year 803,644 1,149,934 112,814
(n=2,121,656) (37.88%) (54.20%) (5.32%)
Total unweighted encounters/year 161,795 230,625 22,617 (n=421,207)
Mean age 5.49 7.72 8.14 <.0001 <.0001
%Female 44.41% 45.59% 44.65% 0.0003 <.0001
Race
White 30.09% 53.30% 35.94% <.0001 <.0001
Black 21.41% 9.15% 14.38% <.0001 <.0001
I
Hispanic 19.56% 8.46% 17.02% <.0001 <.0001
Other 28.93% 29.08% 32.66% <.0001 <.0001
Median income in zipcode:
0-25K 20.89% 8.08% 15.40% <.0001 <.0001
25-35K 37.29% 24.98% 33.21% <.0001 <.0001
35-45K 23.15% 25.69% 25.69% <.0001 0.0009
45K+ 14.45% 36.48% 20.08% <.0001 <.0001
% urban hospital encounters 83.13% 86.78% 82.08% <.0001 <.0001
Table 3. Inpatient Resource Utilization
Insurance status
P-values for comparisons by insurance status
Medicaid Private Self-pay Medicaid Private vs
Insurance vs. Self- Self-pay
Pay
Mean LOS/year 4.29 3.52 3.17 <.0001 <.0001
Median LOS/year 3 2 2
Average charge/encounter $10,582 $10,021 $7,668 <.0001 <.0001
Table 4. Inpatient Mortality for children age 1 month to 18 years from all causes and from selected specific
conditions: weighted percentage of deaths and five year cumulated unweighted number of deaths
in the NIP sample
Percent of Deaths* P-values for comparisons by
(number of deaths[uuweighted)) insurance status
Cause of Death Medicaid Private Self-pay Medicaid vs Private vs
Insurance Self-Pay Self-pay
All Causes 0.39 0.36 0.60 <.0001 <.0001
(3188) (4150) (672)
Congenital heart disease as 2.65 2.02 3.23 0.0297 <.0001
primary ICD-9 diagnosis (224) (275) (26)
Congenital heart disease as 1.92 1.86 2.18 0.1119 0.0448
any ICD-9 diagnosis (406) (479) (32)
Malignant neoplasm as 2.72 1.79 1.55 <.0001 0.2096
primary ICD-9 diagnosis (287) (421) (15)
Malignant neoplasm as 1.77 1.2 1.69 0.5098 <.0001
any ICD-9 diagnosis (589) (798) (42)
I
*Percentages are weighted to reflect natiOnal es!Jmates of percentages of all mpal!ent deaths
~-References
1
Does Health Insurance Make a Difference? Washington, DC: U.S. Congress Office of Technology Assessment; 1992. Background paper OTA-BP-H-99. Available at:
http://www.wws.princeton.edu/cgi-bin!byteserv.prll-ota/disk1/1992/9212/921201.PDF. Accessed February 28, 2004.
2
Hadley, J. Sicker and poorer: The consequences of being uninsured. A review of the research on the relationship
between health insurance, medical care use, health, work, and income. Medical Care Research & Review.
2003;60(2 Suppl):3S-75S; discussion 76S-112S.
3
How many people lack health insurance and for how long?: A CEO paper. Available at:
http://www.cbo.gov/showdoc.cfm?index-4210&seguence-0. Accessed February 15, 2004.
4
Trends in health insurance coverage by race/ethnicity among persons under 65 years of age: United States, 1997-2001. Available at: http://www.cdc.gov/nchs/products/pubs/pubd/hestats/healthinsur.htm. Accessed February 24, 2004
5
The uninsured in America: 2002 estimates for the civilian noninstitutionalized population under age 65. Available
at: http://www.meps.ahrg.gov/PrintProducts/PrintProd Detail.asp. Accessed February 24, 2004.
6
Interim Evaluation Report: Congressionally Mandated Evaluation of the State Children's Health Insurance
Program. February 26, 2003. Available at: http://aspe.hhs.gov/health/schip/interimrpt! Accessed January 20, 2004.
7
National Vital Statistics Reports, Vol. 52, No.9. Available at:
http://www.cdc.gov/nchs/data!nvsr/nvsr52/nvsr52 09.pdf. Accessed March 28, 2004.
8
Feudtner C, Silveira MJ, Christakis DA. Where do children with complex chronic conditions die? Patterns in Washington State, 1980-1998. Pediatrics 2002;109:656-660.
9
Klopfenstein KJ, Hutchinson C, Clark C, eta!. Variables influencing end-of-life care in children and adolescents with cancer. J Ped Hematol Oneal. 2001;23(8):481-486.
10
Wolfe J, Grier HE, Klar N, Levin SB, eta!. Symptoms and suffering at the end of life in children with cancer. N
Eng/ J of Med. 2000;342:326-333.
ll Feudtner C, Christakis DA, Zimmerman FJ, eta!. Characteristics of deaths occurring in children's hospitals:
Implications for supportive care services. Pediatrics. 2002;109:887-893.
12
Franks P, Clancy CM, Gold MR. Health insurance and mortality: Evidence from a national cohort. JAMA. 1993;270(6):737 -741
13
Sorlie PD, Johnson NH, Backlund E, et a!. Mortality in the uninsured compared with that in persons with public and private health insurance. Arch Intern Med. 1994;154: 2409-16.
+---14
Hadley J, Steinberg EP, Feder J. Comparison of uninsured and privately insured hospital patients: Condition on admission, resource use, and outcomes. lAMA. 1991;265(3):374-379.
15
Bradbury RC, Golec JH, Steen PM. Comparing uninsured and privately insured hospital patients: admission severity, health outcomes and resource use. Health Services Management Research. 2001;14:203-210.
16
Moss NE, Carver K. The effect of WIC and Medicaid on infant mortality in the United States. Am J Public Health. 1998;88(9):1354-1361.
18 Ayanian JZ, Kohler BA, AbeT, eta!. The relationship between health insurance coverage and clinical outcomes
among women with breast cancer. N Eng! J Med. 1993;329:326-31.
19 Lee-Feldstein A, Feldstein PJ, B uchmueller T, et a!. The relationship of HMOs, health insurance, and deli very
systems to breast cancer outcomes." Med Care. 2000;388(7):705-718.
20
Roetzheim RG, Pal N, Gonzalenz EC, et al. Effects of health insurance and race on colorectal cancer treatments
and outcomes. Am J Public Health. 2000;90(11):1746-54.
21
Canto JG, RogersWJ, Gore JM, eta!. Payer status and the utilization of hospital resources in acute myocardial infarction. Arch Intern Med. 2000;160:817-23.
22
Young GJ, Cohen BE. Inequities in hospital care, the Massachusetts Experience. Inquiry. 1991;28: 255-262.
23
Haas JS, Goldman L. Acutely injured patients with trauma in Massachusetts: Differences in care and mortality, by insurance status. Am J Public Health. 1994;84(10):1605-068.
24
Marcin FP, Schembri MS, He J. A population-based analysis of socioeconomic status and insurance status and
their relationship with pediatric trauma hospitalization and mortality rates. Am J Public Health.
2003;93(3):461-466.
25 The Healthcare Cost and Utilization Project: An overview. Available at:
http://www.acponline.org/joumals/ecp/mayjun02/steiner.htm. Accessed February 24, 2004.
26
Mitchell JM, Meehan KR, Kong J, eta!. Access to bone marrow transplantation for leukemia and lymphoma: the role of sociodemographic factors. J Clin Oncol. 1997;15(7):2644-2651.
27
Iezzoni LI. Assessing quality using administrative data. Ann Intern Med. 1997;27:666-674.
28
Romano PS. Can administrative data be used to compare the quality of health care? Med Care Rev.
1993;50:451-77.
29
Virnig BA, Marshall M. Administrative data for public health surveillance and planning. Annu Rev Public Health. 2001;22:213-230.
3
°
Chang RR. Hospitalizations for Kawasaki Disease among children in the United States, 1988-1997. Pediatrics.
2002;109(6):e87.
,___
I
31 Chang RR, Chen AY, Klitzner TS. Clinical management of infants with hypoplastic left heart syndrome in the
United States, 1988-1997. Pediatrics. 2002;110:292-298.
32
Howard TS, Hoffman LH, Stang PE, et al. Respiratory syncytial virus pneumonia in the hospital setting: Length of stay, charges and mortality. 1 Pediatr. 2000;137:227-232.
33
Parker JD, Schoendort KC. Variation in hospital discharges for ambulatory care-sensitive conditions among
children. Pediatrics. 2000;106:942-948.
34
Calculated based on a mortality rate of 0.60 among uninsured children and 0.39 among children with Medicaid insurance, and 112,814 weighted uninsured encounters/year.
35
Weinick, RM, Weigers ME, Cohen JW. Children's health insurance, access to care, and health status: New findings. HealthAff. 1998;17:127-136.
36
Newacheck PW, Brindis CD, Cart CU, et al. Adolescent health insurance coverage: Recent changes and access to
care. Pediatrics.1999;104:195-210.
37
Health Insurance, Access, and Use: Tabulations from the 1997 National Survey of America's Families. Available at http://www.urban.org/UploadedPDF/discussion00-14.pdf. Accessed March 20, 2004.
38
Ayanian JZ, Weissman JS, Schneider EC, Ginsburg JA, Zaslavsky AM. Unmet health needs of uninsured adults in the United States. lAMA. 2000;284:2061-2069.
39
Weissman JS, Stern R, Fielding SL, et al. Delayed access to health care: Risk factors, reasons and consequences.
Ann Intern Med. 1991;114:325-331.
40
Baker DW, Shapiro MF, Schur CL. Health insurance and access to care for symptomatic conditions. Arch Intern Med. 2000;160:1269-1274.
41
Shapiro MF, Morton SC, McCaffrey DF, et al. Variations in the care of HJV-infected adults in the United States: Results from the HJV Cost and Services Utilization Study. lAMA. 1999;281:2305-2315.