International Journal of Emerging Technology and Advanced Engineering
Website: www.ijetae.com (ISSN 2250-2459,ISO 9001:2008 Certified Journal, Volume 5, Issue 8, August 2015)
236
Application of FAHP to Debris-Flow Hazards Risk Assessment
Using Generalized Exponential Fuzzy Numbers
Huang Li-Jeng
Associate Professor, Department of Civil Engineering, National Kaohsiung University of Applied Science, 80778, Taiwan, Republic of China
Abstract—This paper presents the fuzzy analytical hierarchy process (FAHP) using generalized exponential fuzzy numbers employed for risk assessment of debris-flow occurrence. Three layers are involved in the structure of FAHP, the goal layer, criteria layer and the sub-criteria layer. In the criteria layer and sub-criteria layer we consider nine major influence factors grouped into three categories: (1) topological and geological conditions including slope angle, type of deposit, grain size distribution, and surface plants; (2) watershed conditions including effective watershed area and quantity of outflow of sediment; (3) rainfall conditions including intensity, duration, and accumulated rainfall. The relative judgment among each influence factor is built up based upon 9-scale to form the fuzzy reciprocal judgment matrices for evaluating weighting vectors for each layer. Generalized exponential membership functions are employed for fuzzy numbers concerning vagueness and uncertainty of human judgment. Two cases of debris-flow disasters occurred Taiwan are tested by the use of FAHP: one is the debris-flow occurred in Sen-Mu Village, Nan-Tou County, July 31, 1996 and the other is the debris-flow occurred in Hua-San Village, Yun-Lin County, September 17-18, 2001. The results show that the proposed FAHP model using generalized exponential fuzzy numbers as well as the associated influence factors and criteria can successfully predict the risk of debris-flow hazard occurrence. Furthermore, the predicted overall risk indices obtained from FAHP using generalized exponential fuzzy numbers are smaller than those obtained from FAHP using triangular and trapezoidal fuzzy numbers and AHP. When wider generalized exponential fuzzy numbers are employed, the predicted values are smaller.
Keywords—Debris-flow, Fuzzy Analytical Hierarchy Process (FAHP), Multi-criteria, Risk Assessment, Generalized Exponential Fuzzy Numbers.
I. INTRODUCTION
Natural disasters caused by debris flows often occur on earth recently and there are many natural or manmade factors leading to these tremendous accidents (Takahashi, 1991) [1]. Debris flow is a special type of hyper-concentrated flow, composed of mud, clay, sand, gravels, water, air and so forth, flowing down mainly due to its gravitational force.
Development of prevention techniques is obviously based on the understanding and analysis of the mechanical behavior of debris flow. However, nowadays prediction and risk assessment of the occurrence of the debris flow hazards becomes more and more important for many countries.
Occurrence of debris flow depends highly on local topographic, meteorologic, geologic, and hydrologic conditions. Many disasters caused by debris-flows and muddy flows in Taiwan were reported and studied (Jan and Shen, 1993; Wu et al., 2006; Lin, 2006) [2-4]. However, the special reasons that Taiwan is prone to debris-flow hazards can be summarized as follows (Jan, 2000; Huang, 2001) [5, 6].
We know that risk assessment task is a multi-level and multi-criteria complicated process. The method based on probability theory requires a lot of statistical data, prior probability, model evidence, and likelihood function, are required for validity of Bayesian inference. In many real cases and especially for debris-flow hazards this is very difficult.
In the field of operational research, Saaty, T. L. (1980) had proposed the so-called Analytic Hierarchy Process (AHP) for multiple criteria decision making problems [7]. It is also a good approach for risk assessment of problem with multi-criteria on influence factors. The author also had attempted applied AHP to risk assessment of debris-flow hazards occurred in Sen-Mu and Hua-San [8] and Tung-Men and Tung-Shing [9], respectively, and the results are verified to be useful.
International Journal of Emerging Technology and Advanced Engineering
Website: www.ijetae.com (ISSN 2250-2459,ISO 9001:2008 Certified Journal, Volume 5, Issue 8, August 2015)
237
The results show that the ranking of importance of influence factors to overall risk obtained from AHP and FAHP models are the same. Accumulated rainfall (AR), duration of rainfall (DR), and averaged slope angle (SA) play the first three leading important influence factors of debris-flow hazards. Both two kinds of FAHP using trapezoidal and triangular fuzzy numbers predict smaller overall risk indices than the AHP model which using crisp judgment matrices. On the other hand, FAHP using trapezoidal fuzzy numbers yields smaller overall risk indices than FAHP using triangular fuzzy numbers and the reason is due to the wider vagueness involved in the trapezoidal fuzzy numbers than the triangular fuzzy numbers.
However, the most frequently tested membership functions in FAHP such as triangular and trapezoidal ones are linear functions which describe the vagueness increasing and decreasing from the centered value. We might wonder what the prediction will be if the nonlinearity of membership functions is involved. Normal probability distribution (Gaussian distribution) is of course can be tested but its parameters are only two (the mean and the standard deviation). Here another nonlinear but with character of similar exponential type membership functions, the so-called generalized exponential functions [13, 14], will be employed for risk assessment of debris-flow hazards. Three layers and nine influence factors (criteria) are involved in the structure of FAHP. These nine major influence factors grouped into three categories: (1) topological and geological conditions: critical slope, type of deposit, grain size distribution, surface plants; (2) effective watershed area: area of watershed, outflow of sediment; (3) rainfall conditions: intensity, duration, accumulated rainfall. The relative judgment among each influence factor is built up based upon 9-level to form the reciprocal judgment matrices for evaluating weighting vectors for each layer. Generalized exponential fuzzy numbers are employed for accounting for the vagueness and uncertainty of human judgment. Cases of disasters occurred in Sen-Mu Village of Nan-Tou County and Hua-San Village of Yun-Lin County, respectively. Furthermore, effect of different vagueness of generalized exponential functions on the predicted values will be studied.
II. FAHPUSING GENERALIZED EXPONENTIAL FUZZY NUMBERS
2.1
Establish a hierarchical model
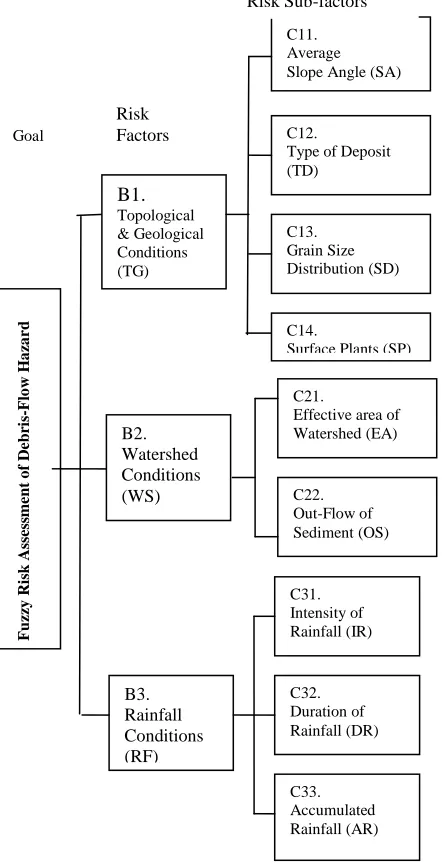
The top of a hierarchical model is the goal to be achieved by FAHP. The second layer (criteria layer) refers to the proposed major categories of influence factors.
Factors in the third layer (sub-criteria-layer) support the factors in the second layer.
2.2 Setup comparison matrices
In general, comparison matrices are obtained through filling in a questionnaire form by some experts in this field. Here we adopt 1-9 scaling method as suggested by Saaty (1980) [27] as shown in Table I and Figure 1. Here we establish the following judgment matrices:
1 2
~ 1 ~
2 ~ 1
21 ~
~ 12
~ 1
] ~ [
n a n a
n a a
in a a
A (1)
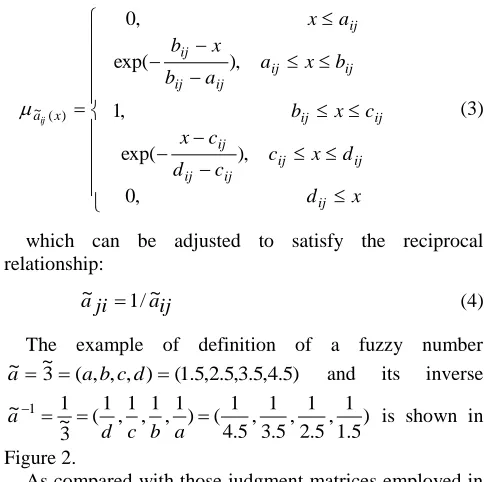
where each entry is a generalized exponential fuzzy number defined as
) , , , ( ~
ij d ij c ij b ij a ij
a (2) and described as a generalized exponential membership function as [14]
x d
d x c c d
c x
c x b
b x a a b
x b
a x
ij ij ij
ij ij
ij
ij ij
ij ij
ij ij
ij
ij
x aij
, 0
), exp(
, 1
), exp(
, 0
) ( ~
(3)
which can be adjusted to satisfy the reciprocal relationship:
ij a ji a 1/~
~ (4)
The example of definition of a fuzzy number
) 5 . 4 , 5 . 3 , 5 . 2 , 5 . 1 ( ) , , , ( 3 ~
~ abcd
a and its inverse
) 5 . 1
1 , 5 . 2
1 , 5 . 3
1 , 5 . 4
1 ( ) 1 , 1 , 1 , 1 ( 3 ~ 1
~1
a b c d
[image:2.612.322.564.389.630.2]a is shown in
Figure 2.
International Journal of Emerging Technology and Advanced Engineering
Website: www.ijetae.com (ISSN 2250-2459,ISO 9001:2008 Certified Journal, Volume 5, Issue 8, August 2015)
238
Here we employ the manner similar to original AHP approach and keeps the reciprocal relationship be satisfied.
TABLEI
1-9SCALING METRHOD FOR RISK ASSESSMENT
Risk Scale Absolutely
Equal 1(1,1,1,1) aij wi wj ~
Equally
) 5 . 2 , 5 . 1 , 1 , 1 ( 1 ~
j w i w ij
a ~1
~
Slightly
more risky 3 (1.5,2.5,3.5,4.5) ~
j w i w ij
a ~3
~
Obviously
more risky 5 (3.5,4.5,5.5,6.5) ~
j w i w ij
a ~5
~
Strongly
more risky 7 (5.5,6.5,7.5,8.5) ~
j w i w ij
a 7
~
Extremely
more risky 9 (7.5,8.5,9,9) ~
j w i w ij
a ~9
~
Intermediate
) 9 , 5 . 8 , 5 . 7 , 5 . 6 ( 8 ~
) 5 . 7 , 5 . 6 , 5 . 5 , 5 . 4 ( 6 ~
) 5 . 5 , 5 . 4 , 5 . 3 , 5 . 2 ( 4 ~
) 5 . 3 , 5 . 2 , 5 . 1 , 1 ( 2 ~
a~ij wi ~2wj
j w i w ij
a ~4
~
j w i w ij
a ~6
~
j w i w ij
a 8~
~
[image:3.612.341.549.136.269.2]
Figure 1 Generalized exponential membership functions employed in FAHP
Figure 2 Generalized exponential membership functions for fuzzy numbers
2.3 Calculate the fuzzy relative weights
The weights for each influence factors in each layers can be calculated using root method as follows
n i
n in a i
a i a i
Z~ (~1~2~ )1/ , 1,2,, (5) n i
n Z Z
Z Z i
W~ ~1(~1~2~ )1, 1,2,, (6) Where and denotes the addition and product of fuzzy numbers and obeys the rule of operation, respectively:
) / 1 1 , / 1 1 , / 1 1 , / 1 1 ( / 1 1 ~
) 1 1 , 1 1 , 1 1 , 1 1 ( 1 1 ~
), 2 1 , 2 1 , 2 1 , 2 1 ( 2 ~ 1 ~
), 2 1 , 2 1 , 2 1 , 2 1 ( 2 ~ 1 ~
n d n c n b n a n a
a b c d a
d d c c b b a a a a
d d c c b b a a a a
(7)
2.4 Defuzzify the relative weights
In the practical application the relative weights can be transformed into crisp values for convenient usage. In addition, the calculation of relative weights does not involve vague human thought and fuzzy logic no need considered. There are a lot of approaches for ranking (sorting) fuzzy number and can be classified into four types as reported by Chen & Hwang (1992) [15].
[image:3.612.49.286.173.623.2] [image:3.612.51.286.188.635.2]International Journal of Emerging Technology and Advanced Engineering
Website: www.ijetae.com (ISSN 2250-2459,ISO 9001:2008 Certified Journal, Volume 5, Issue 8, August 2015)
239
A Q
dx x
dx x x
w x
u
l w
u
l w
i
i
i i
i
i i
) (
) (
(8a)
with
2 / ) (
)] 2
)( ( ) 2 )( [(
2 2
1 1
1
b c
de d c c d ae a b a b e Qx
(8b)
) ( ) )(
1
( e 1 d c b a c b
A (8c) From which we can calculate the crisp relative weights for each level.
2.5 Nomalize the relative weights
The relative weights for each influence factor in both layers are not normalized and can be done as
n i
i w n
i i w i
w , 1,2,...,
1
(9)
Which satisfies
n i
i w n
i
,..., 2 , 1 , 1 1
(10)
2.6 Evaluate the final assessed risk index
Calculate the relative risk impact (RRI) of each influence factors on the overall risk:
A B w B C M A C
RRI} [ ] { 0}
{ (11)
Where {RRI} is a n1crisp vector denoting the relative risk impact factor for each influence factor (C layer) on the global risk (A layer); [M]is a nm crisp transfer matrix that converting each sub-criteria-layer (C layer) to the
criteria-layer (B layer) and {w0}is a m1 crisp transfer vector that converting criteria-layer (B layer) to goal layer (A layer).
Once the RRI of a FAHP (or AHP) model is obtained we can plot the bar chart to observe the relative importance of each sub-criteria-layer influence factor on the overall risk and the assessment model has been built up for practical assessment application.
2.7 Built up the evaluation criteria for each influence factor:
When we want to make the assessment of a hazard, we first investigate the data of the case based on the influence factor from well-established evaluation criteria and assign
the evaluation values E~i (i1,2,...,n) where the fuzzy numbers are also considered to include the vagueness of human judgment.
) ,..., 2 , 1 ( ) , , , ( ~
n i
E E E E
E i
d i c i b i a
i (12)
The evaluation values can be assigned based on the judgment way as depicted in Table I.
2.8 Calculate the overall risk index (ORI):
Then we can calculate the fuzzy overall risk index (ORI):
i i n
i T
d c b
a RRI E RRI E
~ }
~ { } { ) , , , ( ~
1
(13)
Using the method of centroid for defuzzification of generalized exponential fuzzy number the final crispglobal risk index is
A Qx
ORI
(14a)
With
2 / ) (
)] 2
)( (
) 2
)( [(
2 2 1
1 1
b c d
d c c d
a a b a b Q
e e e
x
(14b)
) (
) )(
1
( 1 d c b a c b
A e
(14c)
III. RISK ASSESSMENT OF DEBRIS-FLOW OCCURRENCE -FAHP
3.1
Establish a hierarchical model
International Journal of Emerging Technology and Advanced Engineering
Website: www.ijetae.com (ISSN 2250-2459,ISO 9001:2008 Certified Journal, Volume 5, Issue 8, August 2015)
240
3.2 Setup comparison matrices
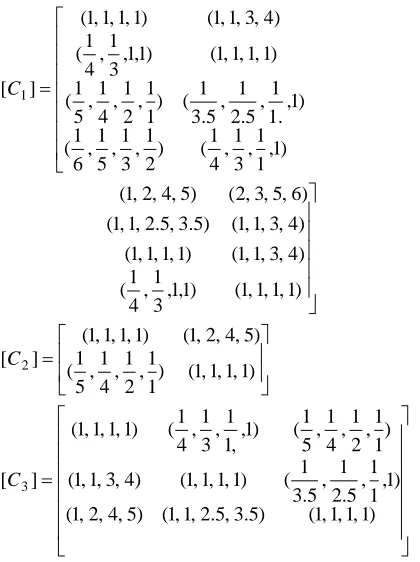
Here the following judgment matrices were built up as follows: ) 1 , 1 , 1 , 1 ( ) 5 . 5 , 5 . 4 , 5 . 3 , 5 . 2 ( ) 5 . 3 , 5 . 2 , 5 . 1 , 1 ( ) 5 . 2 1 , 5 . 3 1 , 5 . 4 1 , 5 . 5 1 ( ) 1 , 1 , 1 , 1 ( ) 1 , 5 . 1 1 , 5 . 2 1 , 5 . 3 1 ( ) 1 , 5 . 1 1 , 5 . 2 1 , 5 . 3 1 ( ) 5 . 3 , 5 . 2 , 5 . 1 , 1 ( ) 1 , 1 , 11 ( ] [B ) 1 , 1 , 1 , 1 ( ) 1 , 5 . 1 1 , 5 . 2 1 , 5 . 3 1 ( ) 5 . 3 , 5 . 2 , 5 . 1 , 1 ( ) 1 , 1 , 1 , 1 ( ) 5 . 3 , 5 . 2 , 5 . 1 , 1 ( ) 25 . 2 , 75 . 1 , 25 . 1 , 1 ( ) 5 . 5 , 5 . 4 , 5 . 3 , 5 . 2 ( ) 5 . 4 , 5 . 3 , 5 . 2 , 5 . 1 ( ) 1 , 5 . 1 1 , 5 . 2 1 , 5 . 3 1 ( ) 5 . 2 1 , 5 . 3 1 , 5 . 4 1 , 5 . 5 1 ( ) 1 , 25 . 1 1 , 75 . 1 1 , 25 . 2 1 ( ) 5 . 1 1 , 5 . 2 1 , 5 . 3 1 , 5 . 4 1 ( ) 1 , 1 , 1 , 1 ( ) 1 , 5 . 1 1 , 5 . 2 1 , 5 . 3 1 ( ) 5 . 3 , 5 . 2 . 5 . 1 , 1 ( ) 1 , 1 , 1 , 1 ( ] [C1
) 1 , 1 , 1 , 1 ( ) 25 . 2 , 75 . 1 , 25 . 1 , 1 ( ) 5 . 4 , 5 . 3 , 5 . 2 , 5 . 1 ( ) 1 , 25 . 1 1 , 75 . 1 1 , 25 . 2 1 ( ) 1 , 1 , 1 , 1 ( ) 5 . 3 , 5 . 2 , 5 . 1 , 1 ( ) 5 . 1 1 , 5 . 2 1 , 5 . 3 1 , 5 . 4 1 ( ) 1 , , 5 . 1 1 , 5 . 2 1 , 5 . 3 1 ( ) 1 , 1 , 1 , 1 ( ] 3 [ ) 1 , 1 , 1 , 1 ( ) 5 . 1 1 , 5 . 2 1 , 5 . 3 1 , 5 . 4 1 ( ) 5 . 4 , 5 . 3 , 5 . 2 , 5 . 1 ( ) 1 , 1 , 1 , 1 ( ] 2 [ C C
As compared with those judgment matrices employed in AHP (Huang, 2014 [7]), the entries of the judgment matrices employed in FAHP are fuzzy numbers with which the vagueness of human consideration and assessment can be included based on the theory of fuzzy sets.
International Journal of Emerging Technology and Advanced Engineering
Website: www.ijetae.com (ISSN 2250-2459,ISO 9001:2008 Certified Journal, Volume 5, Issue 8, August 2015)
[image:6.612.50.271.142.575.2]241
Figure 3 Hierarchical model of the risk assessment of debris-flowshazards using AHP and FAHP 3.4 Defuzzify the relative weights
Using Eq. (8) we can calculate
3628 . 0 3839 . 0
139293 . 0 ) (
) (
1 1
1
A B
Qx B B
w w w
Similarly we can calculate wB2
,
wB3,
…
,
wC33.
3.5 Nomalize the relative weights
After normalization using Eq.(9) we have
5515 . 0 2138 . 1 / 6695 . 0
1495 . 0 2138 . 1 / 1815 . 0
2989 . 0 2138 . 1 / 3628 . 0
3 2 1
B B B
w w w
1160 . 0 2635 . 1 / 1465 . 0
1820 . 0 2635 . 1 / 2300 . 0
2453 . 0 2635 . 1 / 3100 . 0
4567 . 0 2635 . 1 / 5571 . 0
14 13 12 11
C C C C
w w w w
2726 . 0 1206 . 1 / 3055 . 0
7274 . 0 1206 . 1 / 8150 . 0
22 21
C C
w w
4829 . 0 1870 . 1 / 5732 . 0
3328 . 0 1870 . 1 / 3950 . 0
1844 . 0 1870 . 1 / 2189 . 0
33 32 31
C C C
w w w
3.6 Evaluate the final assessed risk index
The calculated results are:
2663 . 0
1835 . 0
1017 . 0
0408 . 0
1088 . 0
0347 . 0
0544 . 0
0733 . 0
1365 . 0
5515 . 0
1495 . 0
2989 . 0
4829 . 0 0 0
3328 . 0 0 0
1844 . 0 0 0
0 2726 . 0 0
0 7274 . 0 0
0 0
1160 . 0
0 0
1820 . 0
0 0
2453 . 0
0 0
4567 . 0
} { ] [ }
{RRI M C B w0 B A
And are plotted in Figure 4 and Table II where the previous AHP results [8], FAHP using triangular fuzzy numbers [11], and FAHP using trapezoidal fuzzy numbers [12] are also shown together for comparison. Only a small deviation exists between AHP and two FAHP results. Furthermore, the ranking of importance of influence factors to overall risk obtained from AHP and two FAHPs models are kept the same.
Goal
Fuzz
y
R
isk
A
ssess
me
n
t
o
f
D
eb
ri
s-Fl
o
w
H
a
za
rd
B1. Topological & Geological Conditions (TG) Risk Factors
C11. Average Slope Angle (SA)
C12.
Type of Deposit (TD)
C14.
Surface Plants (SP) C13.
Grain Size Distribution (SD)
B2. Watershed Conditions (WS)
C21.
Effective area of Watershed (EA)
C22. Out-Flow of Sediment (OS)
B3. Rainfall Conditions (RF)
C31. Intensity of Rainfall (IR)
International Journal of Emerging Technology and Advanced Engineering
Website: www.ijetae.com (ISSN 2250-2459,ISO 9001:2008 Certified Journal, Volume 5, Issue 8, August 2015)
[image:7.612.63.268.153.472.2]242
Figure 4 Diagram for relative risk impact (RRI) for influence factorsof debris-flow hazards using AHP and three FAHPs
TABLEII
COMPARISON OF RELATIVE RISK IMPACT FOR EACH INFLUENCE FACTORS FOR RISK ASSESSMENT OF DEBRIS-FLOW BASED ON AHP
AND FAHPS
INFLUENCE
FACTORS
RRI% (AHP)
RRI% (FAHP)
(Tri-angular)
RRI% (FAHP)
(Trape-zoidal)
RRI% (FAHP) (Present)
R
A N K
C11(SA) 13.64 13.75 13.66 13.65 3 C12(TD) 6.82 7.30 7.26 7.33 6 C13(SD) 5.03 5.31 5.38 5.44 7 C14(SP) 3.08 3.50 3.42 3.47 9 C21(EA) 10.71 11.12 10.87 10.88 4 C22(OS) 3.57 3.86 3.99 4.08 8 C31(IR) 9.52 9.87 10.07 10.17 5 C32(DR) 19.04 18.45 18.45 18.35 2 C33(AR) 28.57 26.85 26.90 26.63 1
SUM 100 100 100 100
3.7 Built up the evaluation criteria for each influence factor:
The evaluation value and criteria for debris-flow occurred in Taiwan is proposed as reported in Ref. [8, 11-12] and not repeated here.
IV. CASE STUDY OF RISK ASSESSMENT OF DEBRIS-FLOW HAZARD
4.1 Description of Debris-Flow Disasters Occurred in Taiwan
(1) Case 1: Debris-Flow Occurred in Sen-Mu Village The first case of debris-flow disaster we employed for checking the validity of risk assessment model is that occurred at July 31, 1996, in the Sen-Mu Village, Shin-Yi township, Nan-Tou County, Taiwan during the attack of Typhoon with strong storms. This debris-flow caused 27 deaths, 17 persons disappeared. A lot of valuable investigation data were collected and reported by Yu (1997)[16], Su (1997) [17] ,Chen et al. (1999) [18], Chen (2000) [19] , and Chen et al. (2010) [20].
(2) Case 2: Debris-Flow Occurred in Hua-Shan Village The second debris-flow hazard occurred in September 17, 18, 2001 at Hua-Shan Village, Gu-Ken township, Yun-Lin County, Taiwan, during the attack of Typhoon Nari. A lot of gravels and stones moved down from Hua-Shan River to the village destroyed some houses. In fact at June 3, 2000 debris-flow had occurred once in this village due to thunder storm and large amount of stones moved from Ker-Giau River and caused disasters. Many field investigation data were collected and rported by Chen (2006) [21] and Tsai (2007) [22]
4.2 Recorded data and the judgment vector {E}
The recorded data of debris-flows occurred at Sen-Mu Village and Hua-San Village can be observed in Ref. [8, 11-12], respectively.
4.3 FAHP Risk Assessment Results
From Eq. (14), we can calculate the overall risk index of the debris-flow occurred in Sen-Mu Village and Hua-San Village, respectively, as
5836 . 7 4705 . 1
1819 . 11
) 4687 . 8 , 1698 . 8 , 5203 . 7 , 5203 . 6 ( ~ 9
1
A Q ORI
E RRI
x i i i
International Journal of Emerging Technology and Advanced Engineering
Website: www.ijetae.com (ISSN 2250-2459,ISO 9001:2008 Certified Journal, Volume 5, Issue 8, August 2015)
243
3004 . 7 4705 . 1
7354 . 10
) 1855 . 8 , 8866 . 7 , 2371 . 7 , 2371 . 6 ( ~ 9
1
A Q ORI
E RRI
x i i
i
[image:8.612.324.565.176.344.2]Which can be classified to be within a dangerous regime as shown in Figure 5 and Table III.
Figure 5 Diagram for overall risk index (ORI) of risk assessment of tested debris-flow hazards occurred at Sen-Mu Village and Hua-San
Village, Taiwan, using AHP and three FAHPs
TABLEIII
COMPARISON OF OVERALL RISK INDEX OF RISK ASSESSMENT OF TESTED DEBRIS-FLOW HAZARDS OCCURRED AT SEN-MU VILLAGE AND
HUA-SAN VILLAGE,TAIWAN, USING AHP AND THREE FAHPS Debris-Flow Hazards SEN-MU
Village
Hua-San Village
ORI-AHP 8.0552 7.7881
ORI-FAHP (Using Triangular Fuzzy
Numbers)
7.7881 (3.32 %)*
[image:8.612.62.269.233.509.2]7.5046 (3.64 %)* ORI-FAHP
(Using Trapezoidal Fuzzy Numbers)
7.6443 (5.10 %)*
7.3624 (5.47 %)* ORI-FAHP
(Using Generalized Exponential Fuzzy
Numbers)
7.5836 (5.85 %)*
7.3004 (6.26 %)*
*Deviation(%) = 100%
AHP FAHP AHP
In Figure 5 and Table III it can be obviously observed that only a small deviat.15"ion (within 3% ~7%) exists between AHP and three FAHPs results. Furthermore, the results of risk indices predicted by AHP model are higher than those obtained from two FAHP models. This means the results of two FAHPs model are a little conservative. In addition, using nonlinear (generalized exponential) fuzzy numbers leads to wider vagueness of judgment and thus results in smaller overall risk indices than using linear (triangular and trapezoidal) fuzzy numbers. However, the prediction for these two real debris-flow hazards is nearly the same and all are within the “dangerous” range assessed using AHP and three FAHPs models.
V. EFFECT OF VAGUENESS OF GENERALIZED EXPONENTIAL FUNCTIONS
International Journal of Emerging Technology and Advanced Engineering
Website: www.ijetae.com (ISSN 2250-2459,ISO 9001:2008 Certified Journal, Volume 5, Issue 8, August 2015)
244
Here two kinds of width of vagueness will be employed for comparison. The first generalized exponential function (mark by 1) is described as Eq. (3) and Figure 1 and 2. The second generalized exponential function is described by Eq. (3) and Figure 6 and 7. Following this concept, the example of definition of the second generalized exponential fuzzy number a~~3(a,b,c,d)(1,2,4,5) and its inverse
) 1 1 , 2 1 , 4 1 , 5 1 ( ) 1 , 1 , 1 , 1 ( 3 ~ 1
~1
a b c d a
[image:9.612.325.535.133.414.2]The analysis procedure of risk assessment ofdebris-flow hazards is the same as Sec. IV with only the difference on variables with the values of fuzzy numbers involved, such as judgment matrices, Relative Risk Impact (RRI), judgment vector {E}, and Overall Risk Index (ORI), etc.
Figure 6 Generalized exponential membership functions employed in FAHP
Figure 7 Generalized exponential membership functions for fuzzy numbers
The judgment matrices for FAHP using the second generalized exponential fuzzy numbers are
) 1 , 1 , 1 , 1 ( ) 6 , 5 , 3 , 2 ( ) 4 , 3 , 1 , 1 ( ) 2 1 , 3 1 , 5 1 , 6 1 ( ) 1 , 1 , 1 , 1 ( ) 1 , 1 , 3 1 , 4 1 ( ) 1 , 1 , 3 1 , 4 1 ( ) 4 , 3 , 1 , 1 ( ) 1 , 1 , 1 , 1 ( ] [B ) 1 , 1 , 1 , 1 ( ) 1 , 1 , 3 1 , 4 1 ( ) 4 , 3 , 1 , 1 ( ) 1 , 1 , 1 , 1 ( ) 4 , 3 , 1 , 1 ( ) 5 . 3 , 5 . 2 , 1 , 1 ( ) 6 , 5 , 3 , 2 ( ) 5 , 4 , 2 , 1 ( ) 1 , 1 1 , 3 1 , 4 1 ( ) 2 1 , 3 1 , 5 1 , 6 1 ( ) 1 , . 1 1 , 5 . 2 1 , 5 . 3 1 ( ) 1 1 , 2 1 , 4 1 , 5 1 ( ) 1 , 1 , 1 , 1 ( ) 1 , 1 , 3 1 , 4 1 ( ) 4 , 3 , 1 , 1 ( ) 1 , 1 , 1 , 1 ( ] [C1
) 1 , 1 , 1 , 1 ( ) 5 . 3 , 5 . 2 , 1 , 1 ( ) 5 , 4 , 2 , 1 ( ) 1 , 1 1 , 5 . 2 1 , 5 . 3 1 ( ) 1 , 1 , 1 , 1 ( ) 4 , 3 , 1 , 1 ( ) 1 1 , 2 1 , 4 1 , 5 1 ( ) 1 , , 1 1 , 3 1 , 4 1 ( ) 1 , 1 , 1 , 1 ( ] [ ) 1 , 1 , 1 , 1 ( ) 1 1 , 2 1 , 4 1 , 5 1 ( ) 5 , 4 , 2 , 1 ( ) 1 , 1 , 1 , 1 ( ] [ 3 2 C C
Accordingly, the Relative Risk Impact (RRI) for the FAHP using the second generalized exponential fuzzy numbers becomes 2741 . 0 1709 . 0 1036 . 0 0455 . 0 1063 . 0 0343 . 0 0554 . 0 0771 . 0 1329 . 0 5486 . 0 1518 . 0 2996 . 0 4996 . 0 0 0 3115 . 0 0 0 1889 . 0 0 0 0 2995 . 0 0 0 7005 . 0 0 0 0 1144 . 0 0 0 1848 . 0 0 0 2573 . 0 0 0 4435 . 0 } { ] [ }
{RRI M C B w0 B A
[image:9.612.328.555.465.613.2]International Journal of Emerging Technology and Advanced Engineering
Website: www.ijetae.com (ISSN 2250-2459,ISO 9001:2008 Certified Journal, Volume 5, Issue 8, August 2015)
[image:10.612.67.268.145.312.2]245
Figure 8 Diagram for relative risk impact (RRI) for influence factorsof debris-flow hazards using two FAHPs with different generalized exponential fuzzy numbers
The overall risk indices of the debris-flow occurred in Sen-Mu Village and Hua-San Village, respectively, predicted by FAHP using the second generalized exponential fuzzy numbers become
4252 . 7 1211 . 2
7494 . 15
) 6236 . 8 , 3240 . 8 , 0244 . 7 , 0244 . 6 ( ~ 9
1
A Q ORI
E RRI
x i i
i
2047 . 7 9841 . 1
2945 . 14
) 3365 . 8 , 0369 . 8 , 8744 . 6 , 8744 . 5 ( ~ 9
1
A Q ORI
E RRI
x i i
i
[image:10.612.337.544.147.369.2]Which can be classified to be within a dangerous regime as shown in Figure 9. It shows that the wider the vagueness involved in the generalized exponential fuzzy numbers yield the lower the predicted values of risk assessment.
Figure 9 Diagram for overall risk index (ORI) of risk assessment of tested debris-flow hazards occurred at Sen-Mu Village and Hua-San Village using two FAHPs with different generalized exponential fuzzy
numbers
VI. CONCLUDING REMARKS
A FAHP model using generalized exponential fuzzy numbers for risk assessment of debris-flow hazards has been successfully tested. The findings are:
1)the ranking of importance of influence factors to overall risk obtained from AHP and FAHP models are the same. Accumulated rainfall (AR), duration of rainfall (DR), and averaged slope angle (SA) plays the first three leading important influence factors of debris-flow hazards;
International Journal of Emerging Technology and Advanced Engineering
Website: www.ijetae.com (ISSN 2250-2459,ISO 9001:2008 Certified Journal, Volume 5, Issue 8, August 2015)
246
3)Both three kinds of FAHP using linear (triangular and trapezoidal) and nonlinear (generalized exponential) fuzzy numbers predict smaller overall risk indices than the AHP model which using crisp judgment matrices.
4)The wider the vagueness involved in the generalized exponential fuzzy numbers yield the lower the predicted values of risk assessment.
REFERENCES
[1] Takahashi, T. 1991. Debris Flow, Balkema, Rotterdam.
[2] Jan, C. D. and Shen, H. W. 1993. A Review of Debris Flow Analysis, Proc. XXV Congress, IAHR, 3, 25-32.
[3] Wu, J. M., Yu, F. C. and Chao, C. M. 2006. The Earth Disasters of Slope Lands in Taiwan, J. of Envir. and Manag., VII(1), 86-98. [4] Lin, M. L. 2006. Debris Flow Hazards and Mitigations in Taiwan.
Keynote Speech, Proc. the 2nd Taiwan-Japan Joint Workshop on Geotechnical Hazards from Large Earthquakes and Heavy Rainfall, Japan.
[5] Jan, C. D. 2000. Introduction to Debris Flows, Science and Technology Books Company, Taiwan, R. O. C. (in Chinese). [6] Huang, L. J. 2001. Introduction to Theory and Practice of
Debris-Flow Hazards Mitigation, Chuan-Hwa Publishing Ltd. Taiwan, R.O.C. (in Chinese).
[7] Saaty, T. L., 1980. The Analytic Hierarchy Process, McGraw-Hill. [8] Huang, L. J. 2014. Application of AHP to Debris-Flow Hazards
Risk Assessment - Case Study of Disasters Occurred in Sen-Mu and Hua-San Villages, Taiwan. Int. J. Emer. Tech. Advan. Engng. (IJETAE), 4(12), 106-113.
[9] Huang, Li-Jeng , Lin, Yo-Ren and Chen, Tzy-Wei. 2015. Debris-Flow Hazards Risk Assessment Using Analytical Hierarchy Process (AHP) - Case Study of Disasters Occurred in Taiwan. Paper No. P-55, 6th. Int. Conf. on Debris-Flow Hazards Mitig.: Mech., Pred. and Assess. (DFHM6), June 22-25, Tsukuba, Japan.
[10] Zadeh, L. A. 1965. Fuzzy Sets. Information and Control. 8, 338-353.
[11] Huang, L. J. 2015. Application of FAHP to Debris-Flow Hazards Risk Assessment - Case Study of Disasters Occurred in Sen-Mu and Hua-San Villages, Taiwan. Second International Conference on Advanced Developments in Engineering and Technology (ICADET-15).Int. J. Emer. Tech. Advan. Engng. (IJETAE Special Issue), 5(1), 16-25.
[12] Huang, L. J. 2015. Application of FAHP to Debris-Flow Hazards Risk Assessment Using Trapezoidal Fuzzy Numbers. Int. J. Emer. Tech. Advan. Engng. (IJETAE), 5(4), 462-471
[13] Chen, C. H. and Li, G. C. 2000. Representation, Ranking, and Distance of Fuzzy Number with Exponential Membership Function Using Grade Mean Integration Method. Tamsui Oxford J. Mathe. Sci. 16(2), 123-131.
[14] Kumar, A., Singh, P. and Kaur, A. 2010. Ranking of Generalized
Exponential Fuzzy Numbers Using Integral Value Approach. Int. J. Advance. Soft Comput. Appl. 2(2), 1-10.
[15] Chen, S. J. and Hwang, C. L. 1992. Fuzzy Multiple Attribute Decision Making Methods and Applications. Lecture Notes in Economics and Mathematical System, Springer-Verlag, New York. [16] Yu, F. C. 1997. Case Study of Debris-Flow Hazards Caused by
Typhoon Hobo. Conf. Debris-Flow and Mitigation.
[17] Su, D. Y. 1997. The Study of Engineering Geology Characteristics of Debris Flow along Hoshe River, Nanto. Institute of Geosciences, National Taiwan University.
[18] Chen, H. Y., Su, D. Y. and Chen, K. M. 1999. Correlation Between Mechanism of Initiation of Debris-Flow and Geological Environment. Sino-Geotech., 74, 5-20.
[19] Chen, H. Y. 2000. Geological Characteristics of Source Area of Debris-Flow Around Upstream of Tsu-Suei River at Southern of Sheng-Mu Village, NSC Report.
[20] Chen, S. C., Wu, C. H. and Chen, S. C. 2010. The Characteristics of Debris Flow in Sheng-Mu Village.
[21] Chen, K. H. 2006. The Study of Fuzzy Reasoning Applied to the Prediction System of Debris Flows. Master Thesis. Institute of Civil Engineering, Fung-Chia University. (in Chinese)