Abstract— Small and Medium Enterprises (SMEs) setup wireless networks in order to make the process of communicating and sharing resources easier. SMEs implement wireless networks, because it’s easy, fast and cheaper to implement. However, with the rapid growth within the SMEs sector. SMEs tend to hire more employees when they grow and this increases their bandwidth demand. This is mainly due to fact that the number of users sharing the same space on the wireless network channel increases. Then their bandwidth allocation rapidly dwindles, which quickly leads to high network latency, link congestion and high number of lost packets. These network performance limitations lead to poor QoS. Therefore in this paper, we designed an enhanced bandwidth sharing scheme by integrating transferable payoff coalitional game theory and standard-Dijkstra algorithm, in order to produce the desired QoS. It has been proven by Network Simulator 2 (NS2) simulation results that the proposed scheme reduced link congestion, end-to-end delay and minimized number of packets lost at various packet sizes when compared to other existing algorithms.
Index Terms— wireless network, bandwidth sharing, transferable payoff coalitional game theory, standard-dijkstra algorithm, QoS, SMEs
I. INTRODUCTION
VER the past decade we have seen many advances in physical-layer wireless communication theory and their implementation in wireless network systems. This has led wireless network technologies to receive greater market acceptance all over the world in today’s technological world. This is partly due to the fact that wireless network operations permit services, such as long-range communications using radio communication or signals [1]. Wireless network allows users to transcend time and place of work, thus increasing their work productivity [2].
Wireless Local Area Networks (WLANs) support mobile computing in small areas such as small office, home office or campus. Over the past years WLANs has extended or replaced wired Local Area Networks (LANs) in both infrastructure and ad-hoc configurations by employing short-range wireless technologies such as Wireless Fidelity
(Wi-Manuscript received June 23, 2014; revised August 10, 2014. This work was supported in part by the Tshwane University of Technology.
Topside E. Mathonsi is with the Tshwane University of Technology, Department of Information Technology (Communication Networks), Private Bag X680, Pretoria 0001, South Africa (e-mail: mathonsite@ tut.ac.za).
Okuthe P. Kogeda is with Tshwane University of Technology, Department of
Computer Science, Private Bag X680, Pretoria 0001, South Africa (e-mail: [email protected]).
Fi) in order to provide users with access to the Internet [3]. Currently wireless technologies use 2.4 GHz Ultra high frequency (UHF) and 5 GHz Super high frequency (SHF) radio waves to transmit packets over a WLAN.
Although the current WLAN speeds are less than wired Ethernet, but WLANs offers a quick and inexpensive way to set up LANs because cabling is not needed [4]. WLAN users also get additional benefits such as: more efficient use of office space, improved employee efficiency or productivity, increased network flexibility, lower network support and network maintenance costs [5]. This is why many South African Small and Medium Enterprises (SMEs) have implemented wireless network.
Users require fast and consistent communications from their wireless network systems; however, this is not always what South African SMEs get from their wireless network systems. This is mainly due to rapid growth within the SMEs sector, because SMEs tend to hire more employees when they grow. This increases their bandwidth demand as the number of users sharing the same space on the wireless network channel increases. Then their bandwidth allocation rapidly dwindles and their network latency quickly climbs. As a result, their wireless network systems tend to suffer from poor Quality of Service (QoS), high link congestion, end-to-end delays and high number of lost and dropped packets during packet transmission.
Wireless network is considered to be good and successful if it offers good QoS, because users always demand good QoS [6]. In order to meet the users QoS criteria, we designed and implemented an enhanced bandwidth sharing scheme by integrating transferable payoff coalitional game theory and standard-Dijkstra algorithm and we named the new algorithm Improved-Dijkstra algorithm. This integration is an improvement on previous work [7-9].The performance of layer 2 by selecting a more reliable path with low link load and less link interference has greatly improved. Furthermore, it improves performance of layer 3 by allocating the available bandwidth between communicating users based on traffic type they want to send at a particular time. When applying transferable payoff coalitional game theory, we prioritized packets, where high-bandwidth traffic (high-priority traffic) had high priority over low-bandwidth traffic (low-priority traffic).
The remainder of this paper is organized as follows: Overview of transferable payoff coalitional game theory is presented in Section II. In Section III, we present related work. In Section IV, we present the route discovery process. In Section V, we provide the system design and architecture. In Section VI, we provide simulation tests and results. In
Enhanced Bandwidth Sharing Scheme for Small
and Medium Enterprises
Topside E. Mathonsi and Okuthe P. Kogeda
Section VII, we conclude the paper.
II. OVERVIEW OF TRANSFERABLE PAYOFF COALITIONAL GAME THEORY
In order to satisfy an SME goal which is to grow their business, transferable payoff coalitional game theory was used, because SMEs are small organizations and cooperation is encouraged in order to increase productivity. A transferable payoff coalitional game theory is one of the cooperative game theories. A cooperative game differs from non-cooperative game only in that binding agreement is possible before the start of the game. The basic notions defining a cooperative game are the set of players, the action sets, and the payoffs. The value to a coalition is what it can achieve by coordinating their actions.
A coalitional game [10] consists of a set of players
}
...,
,
2
,
1
{
N
N
that can form cooperative groups known as coalitions, who seek to form cooperative groups, in order to strengthen their positions in the game. Any coalitionN
S
represents an agreement between the players inS
to act as a single entity.The formation of agreements (coalitions) is omnipresent in many applications. For example, in political parties, individuals can form alliances in order to improve their voting power. In addition to the player set
N
, the second fundamental concept of a coalitional game is the coalition value. Mainly, the coalition value, denoted byv
, quantifies the worth of a coalition in a game. The definition of the coalition value determines the form and type of the game. Nonetheless, independent of the definition of the value, a coalitional game is uniquely defined by the pair(
N
,
v
)
. It must be noted that the coalition value(
v
)
is, in many instances, referred to as the game, since for every coalition value(
v
)
a different game may be defined [8, 11].A coalition value can be in three different forms: Characteristic form, Graph form, and Partition form. In this study our focus is on the characteristic form, because a decision is made based on traffic type and the available resources i.e., bandwidth in a network [8, 9, 11].
In graph form, the value of a coalition
S
depends on how the members ofS
are connected in a graph (network), since the players are interconnected and communicate through pairwise links in a graph (network) [7, 8, 10].In partition form, the value of a coalition depends on the partition of
N
that is in place at any time during the game. In such games, unlike the characteristic form, the value of a coalitionS
will have a strong dependence on how the players inN
\
S
are structured [7, 9, 10]In characteristic form, the coalition value of any coalition
S
belonging toN
and the coalition value depend on the traffic type a user wants to send at particular time and the available bandwidth. In characteristic form, a coalition value is the value which is assigned to a play after all players have communicated and made a decision based on the available bandwidth and the traffic type a user wants to send at a particular time [7-9].The disadvantage of transferable payoff coalitional game theory is that it is difficult to apply in a larger organization; because competition is very high due to that a user makes decisions that benefit him/her only.
III. RELATED WORK
Over the past years a lot of work has been done on bandwidth sharing schemes, protocols and algorithms in order to optimize the utilization of the available bandwidth in a wireless network.
In 1999, Padmanabhan [6] proposed coordinating congestion management and bandwidth sharing management in order to improve the performance of a wireless network. The author used Utility-based Multi-service Bandwidth Allocation (UMBA) algorithm which allocates bandwidth between communicating users based on the utility fairness of a user without knowing the capacity of the whole network [12]. They implemented and tested their solution using Network Simulator (2) and the simulation results showed that the congestion management and bandwidth sharing management solution reduced the number of packets lost than Evolutionary game theory and Simultaneous games theory.
Zuyuan et al. [13] proposed the use of game theory framework for bandwidth sharing between the communicating nodes in a wireless network. The authors used game theory framework with Lagrange relaxation and duality theory for bandwidth sharing between communicating users in order to increase the utilization of the available bandwidth. However, the network performance remained poor since there was high link congestion and end-to-end delay.
The Game-Theoretic Bandwidth Allocation (GTBA) scheme was proposed by Massoulié et al. [7]. The GTBA scheme uses call control mechanism to allocate and maintain the QoS performance of various services by different nodes in a wireless network. The simulation results have showed that GTBA reduced link congestion, but we still have the possibility of experiencing packet delays, because GTBA doesn’t have the intelligence to select a reliable path before transmission can start.
Utility-based Multi-service Bandwidth Allocation (UMBA) allocates bandwidth between communicating users based on the utility fairness of a user without knowing the capacity of the whole network [12]. While Game-Theoretic Bandwidth Allocation (GTBA) algorithm uses call control mechanism to allocate bandwidth between the communicating users [7].
the desired QoS.
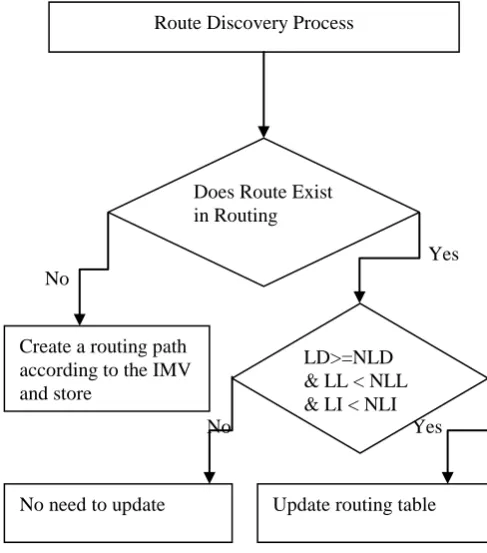
IV. ROUTE DISCOVERY PROCESS
When a node desires to communicate with other nodes in a WLAN, it first checks its routing table for a route. Subsequently, the node always creates or updates a reverse route to the source IP Address in its routing table. If a route to the source IP Address already exists, it is updated only if either the Source Sequence Number in the Route Request (RREQ) is higher than the destination sequence number of the Source IP Address in the route table, or the sequence numbers are equal, but the Integrated_Metrics_Value (IMV)
in RREQ is smaller than the Prev_
Integrated_Metrics_Value (PIMV) in the routing table. The Integrated_Metrics_Value is calculated by using equation 1.
) _
/ _
/
_ / ( _
_
hopCount prev
hopCount rtt
prev rtt
etx prev etx Value Metric
Integrated
(1)
Prev_ Integrated _Metrics_Value is calculated by using equation 2.
) /
/ _
_ ( _
_
hopCount hopCount
prev rtt rtt prev
etx prev Value
Metric Integrated
Perv
(2)
When a node wants to send a reply packet to the source, it first checks the routing table for collecting route information. The forward route for the destination is created or updated only if the Destination Sequence Number in the Route Reply (RREP) is greater than the node's copy of the destination sequence number, or the sequence numbers are the same, but the route is no longer active.
Flow Chart of Route Discovery Process is demonstrated in figure 1.
Yes No
[image:3.595.44.288.467.744.2]No Yes
Figure 1: Flow Chart of Route Discovery Process
Acronym: LD: Link Distance, NLD: Newly LD, LL: Link Load, NLL: Newly LL, LI: Link Interference, NLI: Newly
LI.
V. SYSTEM DESIGN AND ARCHITECTURE We integrated transferable payoff coalitional game theory with standard-Dijkstra algorithm in order to reduce link congestion, end-to-end delay and minimize number of packets lost during packet transmission. The integration of transferable payoff coalitional game theory and standard-Dijkstra algorithm was done in order to allow the proposed scheme to first select a more consistent path with low link load and less link interference. Then allocate the available bandwidth between communicating users based on traffic type. Before bandwidth can be allocated between communicating users, all users share their packet information so that high-priority traffic or low-priority traffic can be determined. When applying transferable payoff coalitional game theory, we prioritized packets, where high-priority traffic had high high-priority over low-high-priority traffic (see Equation 3). This theory minimizes packet delay and delay variation for high priority traffic to ensure better QoS. Transferable payoff coalitional game ensures zero interruption of high priority traffic, such as audio or video applications.
In transferable payoff coalitional game theory
N
,
v
all users’ payoff (allocated bandwidth) is not below what each user was going to get in absence of cooperation
S
v
S
x
(
)
for allS
N
.
X
IR
x
N
v
N
x
S
v
S
S
N
C
N:
,
(
),
(
)
,
(3)We adapted standard-Dijkstra algorithm and added features (shown in bold):
1.Initialization steps:
Set distance value to zero, link load to zero and link interference to zero for the Source/Origin
intersection.
2.Set distance value to infinity, link load to zero and link interference to zero for all intersection. The algorithm then processes the vertices one by one in some order. 3.Mark all intersection as unvisited.
4.Mark Source/Origin as current 5.Iterative steps:
Repeat
For each (visited) neighbours of the current intersection do
a)Calculate their distance, link load and link interference
b)If the present distance of a neighbour is less than the previously recorded distance, set its distance to the newly computed distance, if the present link load is less than the previously recorded link load set link load to the newly computed link load and if the present link interference is less than the previously recorded link interference set link interference to the newly computed link interference.
c)If the present distance of a neighbour is equal to the previously recorded distance, if newly computed link load is greater than previously recorded link load set its link load to the previously recorded Route Discovery Process
Does Route Exist in Routing
Create a routing path according to the IMV and store
LD>=NLD & LL < NLL & LI < NLI
link load and if newly computed link interference is greater than previously recorded link
interference set its link interference to the previously recorded link interference. d)Mark the current intersection visited.
6. Let i be the set of unvisited intersection with the shortest distance from Source/Origin. From i, select an intersection that has less link load and low link interference as the next “current node” (if more than one intersection in i have less link load and low link interference select one of them randomly). 7. Run equation (3)
8.Until the Destination is “current intersection”, then stop, the algorithm has finished.
9.Select the unvisited node that is marked with the smallest distance, and set it as the new "current node" then go back to step 3.
In this paper, link load was calculated by using equation (2), where all packets per link were added together to form a link load. The packets per link were calculated from
Packet
1,
Packet
2,...
Packet
n, therefore the link load is given by equation (4):n
Packet
Packet
Packet
load
Link
_
1
2
(4)Intra-flow interference exists if two links belonging to the same path work on the same channel and are located within each other’s interference range, i.e. within
r
(
2
)
hops. We calculated the link interference using the concept of sub-path spanningr
2
hops, based on the observation that a link will potentially interfere with another link at most2
r
hops away. In general, aH
hop
path contains1
r
H
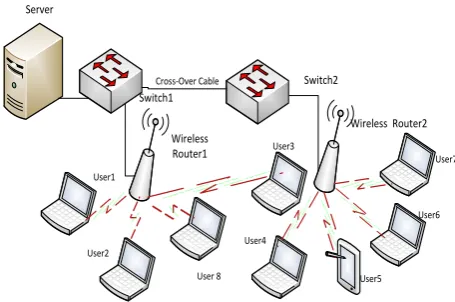
sub-paths.Figure 2 shows an SME wireless network architecture which is made-up of 8 users connected to one server through two wireless routers and two switches. The System Architecture indicates that a user’s machine (node) does not use a hop count metric to establish a communication. This is indicated by user3 which is closer to wireless router2, but uses wireless router1 as its communication path, because the node first checked link load and link interference in order to avoid bottlenecks. This reduced high end-to-end delay and high percentage of packets lost during transmission.
Server
Switch2 Switch1
Wireless Router1
Wireless Router2
Cross-Over Cable
User7
User6
User5 User4
User2 User1
User3
[image:4.595.56.284.596.747.2]User 8
Figure 2: Typical SME of 8 users/nodes
VI. SIMULATION TESTS AND RESULTS We carried out simulations using IEEE 802.11 model developed using Network Simulator 2 (NS2) version 2.35. A virtual machine running Linux 12.04 operating system with 512 RAM was used and NS2.35 was installed. Tool Command Language (TCL) script was used in NS2 to simulate network topology and C++ was used to simulate the proposed enhanced bandwidth sharing scheme, standard-Dijstra and GTBA algorithms. A network topology of 500mX400m with 8 randomly located nodes was used to compare the algorithms. Constant Bit Rate (CBR) traffic type with 10, 50, 100 and 150 packet sizes was configured between communicating nodes. The simulation was configured to start transmitting CBR packets at 0.5 seconds and stop transmitting at 300 seconds. The algorithms were compared using the performance results gained and recorded in sprit named out.nam. This was done in order to get the average of packet delivery ratio, end-to-end delay, average percentage of packets lost during transmission and network throughput after several simulations.
We compared our algorithm with standard-Dijstra algorithm and GTBA algorithm. The two algorithms were chosen, because standard-Dijstra algorithm does not support a shortest path with negative weight. A shortest path with negative weight leads to acyclic graphs and most often cannot obtain the right shortest path. When standard-Dijstra algorithm is used in a network, the available bandwidth is allocated dynamically between communicating users. While GTBA algorithm was chosen, because it uses call control mechanism to allocate the available bandwidth between communicating users. In GTBA algorithm users make decisions independently, this means that users wait for a decision that benefits all of them to be taken is when they communicate. However, Improved-Dijkstra algorithm uses transferable payoff coalitional game theory and standard-Dijkstra algorithm, to allocate the available bandwidth and select a path to transmit packets.
The performance metrics analyzed in our simulations include:
a) Packet Delivery Ratio: A fraction of packets sent from source and are received at the destination. b) Average End-to-end delay: indicates how long it
took one packet from the source to the destination. c) Average percentage of packets lost: is the number of
packets lost during packet transmission.
d) Throughput: is a rate at which packets were delivered.
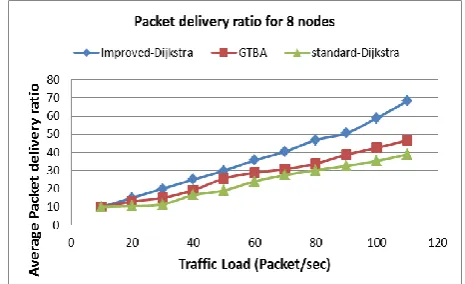
A. Packet Delivery Ratio
Figure 3: Average packet delivery ratio during transmission The simulation results showed that when the traffic load is low, all three algorithms produced similar average packet delivery ratio. While the traffic load increases both standard-Dijstra and GTBA algorithms produced lower average packet delivery ratio. However, the Improved-Dijkstra algorithm produced higher average packet delivery ratio. The Improved-Dijkstra algorithm produced good results, because transferable payoff coalitional game theory encouraged users to work together and make decisions that benefited all users within a wireless network. When the Improved-Dijkstra algorithm applied between communicating users, there was a high utilization of the available bandwidth, because the bandwidth was allocated based on the traffic type a user wants to send at that particular time.
B. End-to-end delay
[image:5.595.305.550.217.385.2]The average end-to-end delay of packets delayed during transmission between communicating users are demonstrated using Figure 4. The performance of algorithms during the simulations was monitored under various packet sizes: 10, 50, 100 and 150 bytes.
Figure 4: Average end-to-end delay during transmission The three algorithms performances were identical at lower traffic load as demonstrated by the simulation results in Figure 4. While the traffic load increases the Improved-Dijkstra algorithm performed better than both standard-Dijkstra and GTBA algorithms. The Improved-standard-Dijkstra algorithm outperforms both standard-Dijkstra and GTBA algorithms; because packets were transmitted over consistent path and high-bandwidth traffic had high priority over
low-bandwidth traffic using transferable payoff coalitional game theory.
C. Number of packets lost
We also compared our scheme in terms of packet loss rate with standard-Dijkstra and GTBA algorithms, as shown in Figure 5. Packet loss rate is calculated as the number of lost packets over the total number of transmitted packets as given in equation (5). It can be observed from the simulation results that all three algorithms had similar average percentage of packets lost during transmission while the traffic was low.
Figure 5: Average percentage of packets lost
100
X d transmitte
received d
transmitte lost
packet of
num
(5)
However, when the traffic load increased both standard-Dijkstra and GTBA algorithms produced high average percentage of packets lost during transmission, because both algorithms had high end-to-end delay, which resulted in the loss of packets. Our proposed solution gave the lowest packet loss rate, because it resulted in the lowest end-to-end delay, hence minimized the number of lost packets.
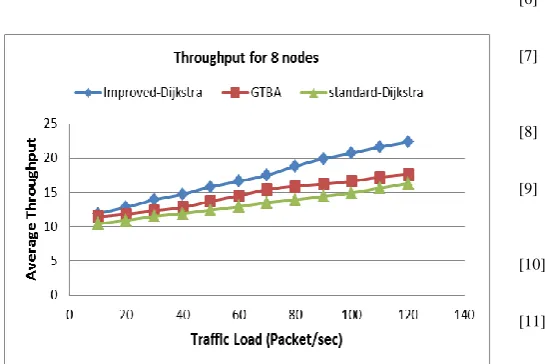
D. Network Throughput
[image:5.595.46.292.515.657.2]Figure 6: Average throughput under various packet sizes VII. CONCLUSION
In this paper, we presented the design of the Improved-Dijkstra algorithm by integrating transferable payoff coalitional game theory and standard-Dijkstra algorithm. The Improved-Dijkstra algorithm reduced link congestion and end-to-end delays that SMEs wireless network systems suffers from. Our proposed solution uses standard-Dijkstra algorithm to first find a consistent path with low link load and less link interference in order to produce the desired QoS. The Improved-Dijkstra algorithm also uses transferable payoff coalitional game theory to allocate the available bandwidth between communicating users, where high-bandwidth traffic had high priority over low-bandwidth traffic. This ensured that high-priority traffic had short delay and this minimized the average percentage of packets lost during packet transmission. In order to validate the performance of the Improved-Dijkstra algorithm, simulations were carried out using 8 nodes. The simulation result showed that the Improved-Dijkstra algorithm reduced link congestion, end-to-end delay and minimizes average percentage of packets lost during transmission. This resulted in improved network throughput and better QoS.
ACKNOWLEDGMENT
The authors will like to thank Tshwane University of Technology for financial support.
REFERENCES
[1] U. Varshney and R. Vetter, "Emerging Mobile and Wireless Networks," Communications of the ACM, vol. 43, pp. 73-81, 2000.
[2] Y. Choi, et al., "Joint Resource Allocation for parallel Multi-Radio Access in Heterogeneous Wireless Networks," IEEE Transactions on Wireless Communications, vol. 9, pp. 3324-3329, 2010.
[3] U. Varshney, "Mobile and wireless information systems: applications, networks, and research problems.," Communications of the AIS, vol. 12, pp. 155-166, 2003. [4] M. Agrawal, et al., "Demystifying wireless thechnologies:
Navigating through the wireless technology maze," Communications of the AIS, vol. 12, pp. 166-182, 2003. [5] Cisco. (2003, 18 June 2014). Cisco AVVID Wireless LAN
Design. Available: Cisco Systems Press, San Jose CA, pp. 1.1-1.2
[6] V. N. Padmanabhan, "Coordinating Congestion Management and Bandwidth Sharing for Heterogeneous Data Streams," Microsoft Research, pp. 1-5, 1999.
[7] D. Niyato and E. Hossain, "Bandwidth allocation in 4G heterogeneous wireless access networks: A non-cooperative game theoretical approach," in Proceedings of IEEE GLOBECOM, 2006.
[8] D. Niyato and E. Hossain, "A cooperative game framework for bandwidth allocation in 4G heterogeneous wireless networks," in Proceedings of IEEE ICC, 2006.
[9] A.L. Ramaboli, et al., "Bandwidth Allocation in Heterogeneous Wireless Networks with Multi-homed Terminals," Southern Africa Telecommunication Networks and Applications Conference (SATNAC), pp. 55-59, 2013.
[10] L. Massoulié and J. Roberts, "Bandwidth Sharing: Objectives and Algorithms," IEEE/ACM TRANSACTIONS ON NETWORKING, vol. 10, pp. 320-328, 2002.
[11] Y. V. Kumar, et al., "Bandwidth Management in Wireless Mesh Networks," International Journal of Scientific & Engineering Research vol. 4, pp. 1-5, 2013.