lymphoblastoid cell line expression quantitative
trait loci
Lea K Davis
1*, Eric R Gamazon
1, Emily Kistner-Griffin
2, Judith A Badner
3, Chunyu Liu
4, Edwin H Cook
4,
James S Sutcliffe
5and Nancy J Cox
1Abstract
Background:Autism spectrum disorder is a severe early onset neurodevelopmental disorder with high heritability but significant heterogeneity. Traditional genome-wide approaches to test for an association of common variants with autism susceptibility risk have met with limited success. However, novel methods to identify moderate risk alleles in attainable sample sizes are now gaining momentum.
Methods:In this study, we utilized publically available genome-wide association study data from the Autism Genome Project and annotated the results (P<0.001) for expression quantitative trait loci present in the parietal lobe (GSE35977), cerebellum (GSE35974) and lymphoblastoid cell lines (GSE7761). We then performed a test of enrichment by comparing these results to simulated data conditioned on minor allele frequency to generate an empiricalP-value indicating statistically significant enrichment of expression quantitative trait loci in top results from the autism genome-wide association study.
Results:Our findings show a global enrichment of brain expression quantitative trait loci, but not lymphoblastoid cell line expression quantitative trait loci, among top single nucleotide polymorphisms from an autism genome-wide association study. Additionally, the data implicates individual genesSLC25A12,PANX1andPANX2as well as pathways previously implicated in autism.
Conclusions:These findings provide supportive rationale for the use of annotation-based approaches to genome-wide association studies.
Keywords:Autism, annotation, cerebellum, enrichment, expression quantitative trait (eQTL), GWAS, LCL, pannexin, parietal, SLC25A12
* Correspondence:[email protected] 1
Section of Genetic Medicine, Department of Medicine, University of Chicago, Chicago, IL 60637, USA
Full list of author information is available at the end of the article
Background
Autism spectrum disorder (ASD) is characterized by impairments in three core domains: development of so-cial interaction; language and communication develop-ment; and restricted or circumscribed interests and repetitive behaviors [1]. By definition, children with aut-ism show impairments in all three areas, though the de-gree to which each is affected varies. The study of autism genetics began with twin studies conducted as early as the 1970s [2], indicating a strong heritable com-ponent. Since then, the autism genetics field has pro-gressed to include linkage, association, copy number variation and candidate gene studies targeting the broad autism diagnosis as well as specific endophenotypes of autism. The discovery of genetic variants involved in autism has been confounded by phenotypic, genetic and allelic heterogeneity, multiple modes of transmission, in-consistent application of diagnostic criteria and un-known environmental risks. Progress has been made in our understanding of the genetic architecture of autism despite these complexities. However, few genes harbor-ing common risk factors have been convincharbor-ingly impli-cated in the etiology of autism.
Multiple traditional genome-wide association studies (GWAS) of ASD have been published with limited power to detect common variants contributing to risk. Genome-wide significantly associated risk alleles have been identified on chromosome 5p14 [3,4], 5p15 [5] and 20p12.1 [6]. The latter study was the largest to date and included over 1,500 parent–child-trio families in the analysis. The single genome-wide significant result found on chromosome 20p12.1 fell within theMACRO domain containing protein 2 gene. However, at least one subse-quent study has failed to replicate this association [7].
Recent studies have shown that novel analytic approaches using GWAS data can increase the power to identify statis-tically significant relationships. For example, Lu and Cantor describe a method that allows for sex-specific associations, resulting in highly significant findings at the ryanodine re-ceptor 2 locus (P<3.9 × 10⁻¹¹) in a multiplex autism dataset [8]. Additionally, several pathway-based analyses of autism GWAS have recently been published, showing enrichment of sub-genome-wide significant associations with pathways of prior interest in autism. For example, Yaspan and colleagues applied their method (pathway analysis by randomization incorporating structure) to the available Autism Genetic Resource Exchange GWAS dataset, sub-sequently identifying over-representation of pathways involved in ubiquitination (supporting a pathway analysis in Glessneret al. [9]) as well as synthesis and degradation of ketone bodies [10]. Anney and colleagues also pub-lished a pathway-based analysis, which successfully ap-plied the SNP ratio test methodology to genome-wide
data from Autism Genome Project (AGP) families, result-ing in a number of convincresult-ingly implicated pathways [6]. Mining of existing autism GWAS data is proving to be a valuable undertaking with the potential to provide signifi-cant insight into the biology and common risk assessment of ASD.
Recent studies providing thorough investigation of top signals from GWAS of a number of complex disorders have shown enrichment for expression quantitative trait loci (eQTL) in relevant tissues [11-13]. These findings suggest that SNPs with significant functional impact on the expression of genes are more likely to be associated with disease phenotypes [11]. Based on this finding, our group sought to determine if brain-specific eQTL were over-represented in the most significant association from a recently published autism GWAS and whether the spe-cific genes implicated as enriched might highlight new, or help cement existing, candidate genes and pathways. We used publically available data from the AGP GWAS [6], the SNP and CNV Annotation Database [14] and genome-wide expression datasets in brain [13] to test for enrichment of eQTL (those previously identified in transformed lymphocytes and two regions of the brain, parietal lobe and cerebellum), among top nominally associated SNPs from reported autism GWAS.
Methods
Study design
in brain tissues were identified. Additional analyses were conducted on these eQTL targets to determine if particular genes, gene families or pathways were strongly implicated by eQTL present in any of the primary AGP GWAS analyses.
Autism genome project genome-wide association study data collection
The methods and samples used for the AGP GWAS are described in depth in the publication by Anneyet al. [6]. Additional files published with that analysis contained all SNPs significant atP<0.001 under an additive model from which the primary analyses were extracted. The lists of significant SNPs came from family-based primary analyses including those stratified by diagnosis subtype and population. In total, four lists of SNPs, significant at
aGWAS P <10-3threshold, were taken from the publi-cally available GWAS results published by Anney et al. [6] (Table 1).
Expression quantitative trait locus determination
eQTL data from LCLs were generated from 176 HapMap European (CEU) and African (YRI) cell lines as described previously (GSE7761) [15]. Cerebellar (GSE35974) and par-ietal cortex (GSE35977) cis and trans eQTL were generated from 153 individuals of European ancestry obtained from the Stanley Medical Research Institute [13]. ComBat and Surrogate Variable Analysis were used to adjust for batch and both known and unknown covariate effects [16,17]. SNP genotyping was performed on the Affymetrix Gen-ome-Wide Human SNP Array 5.0 (Affymetrix, Santa Clara, CA, USA) and imputed, using MaCH to include all
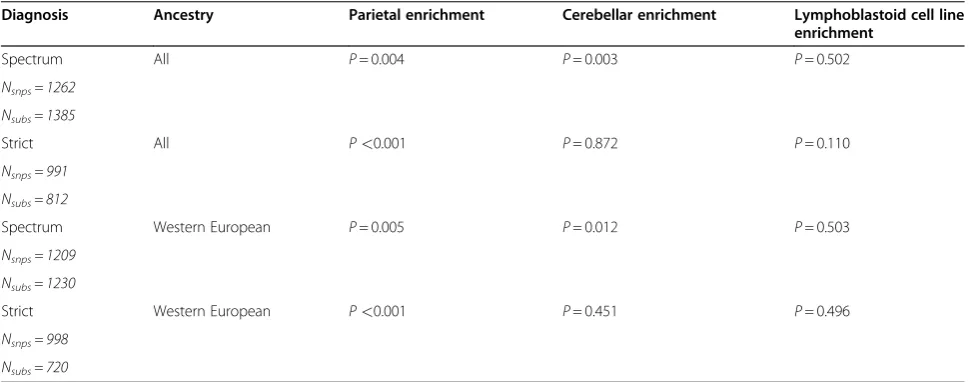
Table 1 Enrichment results for primary analyses
Diagnosis Ancestry Parietal enrichment Cerebellar enrichment Lymphoblastoid cell line
enrichment
Spectrum All P= 0.004 P= 0.003 P= 0.502
Nsnps= 1262
Nsubs= 1385
Strict All P<0.001 P= 0.872 P= 0.110
Nsnps= 991
Nsubs= 812
Spectrum Western European P= 0.005 P= 0.012 P= 0.503
Nsnps= 1209
Nsubs= 1230
Strict Western European P<0.001 P= 0.451 P= 0.496
Nsnps= 998
Nsubs= 720
Results for primary analyses are shown by diagnostic category and ancestry. The number of subjects (Nsubs) that went into the GWAS, and the subsequent number of SNPs (Nsnps) that were significant at aGWAS P<10-3and went into the eQTL enrichment analysis is shown in each diagnostic and ancestry category. The empirically derivedenrichment P-value for each diagnostic and ancestry category in each tissue tested is also provided. eQTL: expression quantitative trait loci; GWAS: genome-wide association study; SNP: single nucleotide polymorphism.
HapMap SNPs [18,19]. The Affymetrix Human Gene 1.0 ST Exon Array was used for gene expression profiling. Imputed genotype dosage data were analyzed for associ-ation with expression phenotypes using PLINK [20]. For cis eQTL, defined as SNPs within 4 Mb of the probe site, the corrected significance threshold for determining eQTL status (eQTL P-value) was P <0.0001. For trans eQTL, theeQTL P-value was corrected as 0.05/n, where n = 25,834 probes for the expression data.
Enrichment of top genome-wide association study signal analysis
All ASD GWAS SNPs with aGWAS P≤10-3in the four primary analyses were subsequently annotated with eQTL information, including the strength of the evidence for the impact of the polymorphism on expression. To test for en-richment of eQTL among these top SNP associations, 1,000 randomized SNP sets were generated. Each of these 1,000 lists, comprising the simulated set of SNPs, included the same number of SNPs as the original list of ASD GWAS associations and contained only SNPs matching the minor allele frequency distribution of the original list of ASD GWAS SNPs. The random lists were sampled without replacement from the set of typed SNPs on the Illumina HumanHap610 array. Minor allele frequency matching was conducted by classifying all Illumina Hap610 platform SNPs into discrete minor allele fre-quency bins at 5% intervals (0 to 5%, 5 to 10%,. . .,45 to 50%), followed by random selection of SNPs from the same allele-frequency bins as those in the top signals. The number of eQTL in each simulated set yields an empirical distribution and anenrichment P-value, calculated as the proportion of randomized sets in which the eQTL count matches or exceeds the actual observed count in the list of top SNP associations.
Pathway analysis of significantly enriched brain expression quantitative trait loci
The program PANTHER (http://www.pantherdb.org [21]) was used to identify networks or gene families represented by top autism GWAS eQTL. PANTHER’s classification of genes and proteins provides functional-ity to determine if gene annotations (that is, membership in pathway or Gene Ontology) are over-represented in a test gene list compared with expectation, given all genes in the human genome. P-values generated by the pro-gram are Bonferonni-corrected for the number of com-parisons conducted. Of the 140 unique genes implicated as eQTL targets from the four primary autism GWAS, 130 were mapped to identifiers in the PANTHER data-base and analyzed for pathway, molecular function and biological process terms that were over-represented compared to expectation.
Results
The focus of this study was to determine if enrichment of brain eQTL (that is, SNPs that regulate brain expressed genes) existed in the top signals from pub-lished autism GWASs. To this end, we analyzed SNPs at a GWAS P <10-3 for four primary analyses from the published AGP GWAS [6].
Primary genome-wide association study enrichment analyses
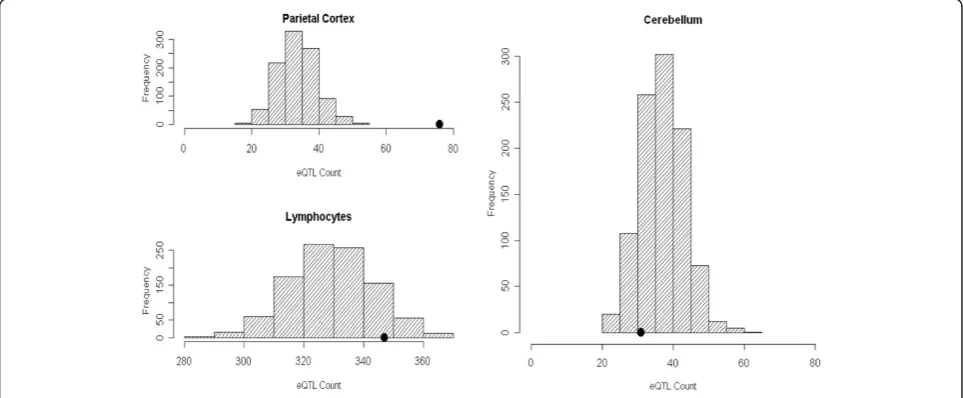
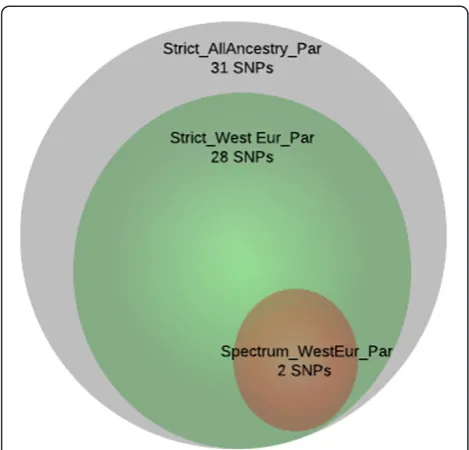
The primary GWAS enrichment analyses consist of two stratifications including diagnosis and ancestry. We observed significant enrichment of parietal (P= 0.004) and cerebellar (P<0.003) eQTL, but not LCL eQTL (P= 0.502) among the top signals from the most broadly inclusive dataset of spectrum diagnosis including all ances-tries (Figure 2). Similarly, enrichment of both parietal (P= 0.005) and cerebellar (P= 0.012) eQTL persisted in the spectrum diagnosis when limited to individuals of Western European descent. Significant enrichment of parietal eQTL (P <0.001), but not cerebellar (P= 0.872) or LCL eQTL (P= 0.110) was identified in the Strict|All dataset (Figure 3). We again observed significant enrichment of parietal (P <0.001) eQTL but not cerebellar (P= 0.45) or LCL (P= 0.49) eQTL in the Strict diagnosis when limited to individuals of Western European descent. Results from all analyses are summarized in Table 1.
Descriptive statistics from primary autism genome-wide association study expression quantitative trait loci enrichment analyses
SNPs from all four primary non-independent SNP lists that were eQTL in either cerebellum or parietal tissues contributed to a total number of 539 brain eQTL found in the primary AGP GWAS top signals. In brief, of the total 539 eQTL SNPs, 256 eQTL SNPs were uniquely identified, meaning that the remaining 283 eQTL SNPs were redundancies of the 256 unique eQTL SNPs. Of the unique 256 eQTL SNPs, 214 (84%) were found to be eQTL for only one gene. Forty-two (16%) eQTL SNPs acted as eQTL for more than one gene. Of the 214 SNPs that target only one gene, 124 (58%) act in cis and 88 (42%) actin trans. Of the 42 SNPs that target more than one gene, 21 (50%) SNPs regulate all target genes in cis, 5 (12%) SNPs regulate all target genes in trans, and 16 (38%) SNPs are both trans and cis regulators of different target genes. All eQTL from enrichment analysis are provided in Additional file 1: Table S1.
of such genes (31% and 28%, respectively). Of the 140 uniquely implicated genes, 71 (51%) genes were implicated in only one analysis; 69 (49%) genes were detected in two or more analyses; 20 (14%) genes were identified in three or more analyses; and 14 (10%) genes were found in all four analyses. There was relatively little overlap in the eQTL target genes across tissues. In an analysis of the
broadest diagnostic and ancestry category, only 18 (13%) of the 140 brain-enriched genes were also targeted by eQTL found in LCLs. Of these 18, only three (2%) were identified in parietal, cerebellum and LCL tissues. Of the 140 brain-enriched genes, only 10 genes (7%) were found in both cerebellum and parietal tissues. In all pairwise comparisons of tissues, the overlap in the eQTL target
Figure 3Histograms of expression quantitative trait loci enrichment analyses for Strict|All dataset.The gray histogram distributions represent the null distribution created by 1,000 lists of randomly ascertained SNPs drawn from the 1 M array platform and conditioned on minor allele frequency. The black dot represents the actual count of SNPs annotated as eQTL present in each tissue in the Strict|All Ancestry analysis. Significant enrichment of parietal eQTL (P<0.001), but not cerebellar (P<0.872) or LCL (P<0.110) eQTL was identified in the Strict|All dataset. eQTL: expression quantitative trait loci; LCL: lymphoblastoid cell line; SNP: single nucleotide polymorphism.
genes was not statistically significant (P >0.05, Fisher’s exact test). All genes implicated in enrichment analyses are given in Additional file 2: Table S2.
Gene and pathway level analysis from primary autism genome-wide association study expression quantitative trait loci enrichment analyses
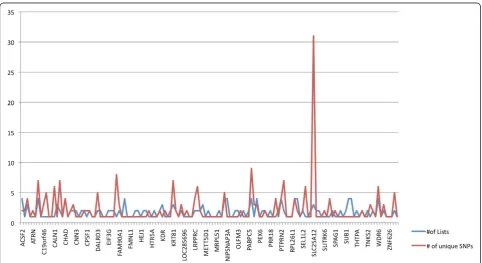
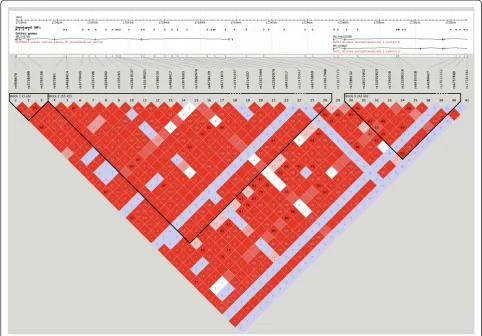
We reviewed the function of those genes implicated in the enrichment analysis to identify common pathways, gene families or functions of said genes. The genes solute carrier family 25 member 12 (SLC25A12), pannexin 1 (PANX1) and pannexin 2 (PANX2) were strongly implicated in our analyses. SLC25A12 was multiply-implicated by a unique set of 31 SNPs, which was by far the largest number of SNPs implicating a single transcript and was the only tran-script implicated in such a way (Figure 4). These SNPs all show a high degree of linkage disequilibrium and appear to implicate an extended haplotype (Figure 5). Twenty-eight of the 31 SNPs were found in more than one analysis and two of those 28 SNPs were found in three analyses (Figure 6). All SNPs implicatingSLC25A12were cis regula-tors. All eQTL SNPs implicatingSLC25A12, and additional information such as SNPs in linkage disequilibrium (r2>0.8), are provided in Additional file 3: Table S3.The genes PANX1 and PANX2 were also multiply-implicated.
PANX1was identified as an eQTL target in all four of the
primary analyses. No genes were implicated by both cis and trans eQTL; however, PANX1 was targeted by nine cis eQTL andPANX2was targeted by three trans eQTL.
Additionally, we sought to identify any overlap between the eQTL implicated in this study and those recently pub-lished by Voineagu and colleagues [22], who identified a number of genes differentially expressed in autism and matched control brains. We found that four of the 140 brain eQTL target genes from our list overlapped with the 1,153 differentially expressed genes identified by Voineagu
et al. [22]. These includedSLC25A12,PANX2,calponin 3 acidic and cleavage and polyadenylation specificity factor subunit 1.
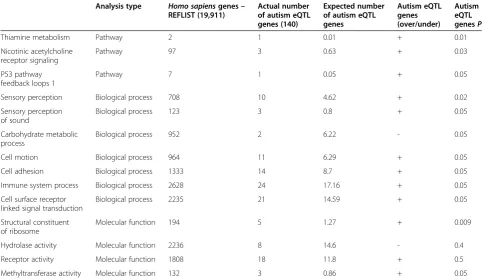
Based on PANTHER analysis, we found modest evi-dence of significant over-representation of 14 processes and pathways of interest in autism, including structural components of ribosomes (P <0.009), methyltransferase activity (P<0.05), the nicotinic acetylcholine receptor sig-naling pathway (P<0.02), sensory perception (P<0.01), and receptor activity (P<0.05) among others (Table 2).
Discussion
This study sought to identify biologically meaningful associations buried within top signals that did not meet genome-wide significance thresholds from autism GWAS results. Traditional GWAS in autism have been
burdened with problems of heterogeneity and limited sample sizes. To date, multiple traditional autism GWAS have been published although it is important to note that some of these studies use overlapping datasets [3-6]. We believe that, while these studies might be underpowered to identify signals that survive genome-wide correction, their reported results do not reflect the full value of the data.
There are excellent examples to date of such novel methodologies providing additional insight into the role of common genetic variants in complex human disor-ders, including autism. Anney and colleagues in the AGP also conducted a novel analysis of the present gen-ome-wide data utilizing the SNP ratio test in an effort to detect over-transmitted SNPs in predefined pathways of interest, which subsequently identified multiple path-ways and/or Gene Ontology terms enriched for asso-ciated signals [23]. Interestingly, two of these pathways,
ribosomal components and methyltransferase activity, were also identified in the current study as pathways regulated by eQTL-associated SNPs. Our study comple-ments these pathway-based approaches and demon-strates a method of utilizing expression based SNP annotations to mine already existing analyses for disease associations with functional variants in relevant tissues.
Our study identified significant enrichment of parietal and cerebellum eQTL, but not LCL eQTL, among the top SNP associations in all four of the primary AGP GWAS identified by Anneyet al. This pattern of results showing significant enrichment in brain (the affected and relevant tissue) and not in tissues peripheral to the main pathology was also seen in a study of cis-regulatory SNPs in bipolar disorder [13]. Similarly, Belowet al. [12] report enrichment of top signals from a type 2 diabetes GWAS in tissues involved in pathogenesis (muscle and adipose) but not LCLs. Additionally, we found no
significant difference in proximity to genes between our GWAS implicated SNPs and the SNPs forming the null distribution. Taken together, the minor allele matching, the lack of a significant difference in distance to nearest gene, and the fact that enrichment is found in some tis-sues and not in others provide strong evidence against possible sources of systematic bias.
There was very little overlap in the eQTL targets found in parietal, cerebellum and LCLs. Only three target genes, protein NIP-SNAP homologue 3A (NIPSNAP3A), TM2 domain containing protein 2 (TM2D2) and copine 1 (CPNE1), were present in all three tissues in the analysis of the broadest diagnostic and ancestry categories. These findings also strongly suggest that the most appropriate tissue for further functional work is the tissue of path-ology. This poses clear challenges for difficult to access tissues, such as neurons. However, there is significant evi-dence that human induced pluripotent stem cells, once transformed into neurons, provide an invaluable source of neuronal tissue from live patients in which to study cellu-lar phenotypes [24-26]. Our study highlights the import-ance of furthering the development of methods that allow access to tissues involved in pathology.
While we expected, and observed, overlap in top sig-nals between each primary GWAS, our findings showed
an abundance of unique eQTL and implicated a total of 140 target genes. Additionally, three genes, SLC25A12,
PANX1 and PANX2, were strongly implicated by our results. Two of these genes,SLC25A12andPANX2, were also identified in a recent study of genes differentially expressed in the brains of individuals with autism com-pared to control brains [22]. PANX2 is a protein impli-cated by trans eQTL that modulates the timing of neuroprogenitor commitment to a neuronal lineage in the hippocampus [27]. It is located 500 kb proximal to SH3 and multiple ankyrin repeat domains protein 3 in the Phe-lan-McDermid Syndrome 22q13.33 terminal deletion re-gion that has been implicated in ASD [28]. PANX1 was implicated in cis by multiple SNPs in multiple analyses and across multiple tissues and has recently been shown to play a role in N-methyl-D-aspartic acid-mediated epi-leptiform activity [29]. In murine models, Panx1 and Panx2 are strongly co-expressed early in the developing brain, specifically in the hippocampus [30].
SLC25A12 is a 109 kb gene found on chromosome 2q31.1 and functions as a calcium-binding mitochondrial protein, integral in the exchange of aspartate for glutamate across the mitochondrial membrane. Several studies have investigated the role of SLC25A12 in the development of autism andSLC25A12SNPs have been implicated [31-34]. Due to the platform used in the original AGP GWAS and quality-based filtering of imputed eQTL data, only one of the previously publishedSLC25A12risk variants (rs908670) was included in our study [31]. Rs908670 was identified as an SLC25A12 eQTL in parietal tissue. Previous work has found SLC25A12 to be differentially expressed in autism brains compared to controls [22,35]. One such recent study found SLC25A12 expression decreased in autism brains compared to controls [22]. We found that the risk alleles of theSLC25A12 eQTL SNPs identified in the AGP GWAS are correlated with decreased expression of SLC25A12 in the parietal lobe. We add our findings to this growing body of evidence and suggest that common variation in
SLC25A12auto-regulates expression and may contribute to autism susceptibility.
Our study is limited by the available analyses and the sample sizes used in the original GWAS. It is with some caution that the comparison of results (for example, Strict| All versus Spec|All) must be interpreted. Enrichment ana-lyses, such as those conducted here, include only the top SNP signals and therefore are sensitive to power and sam-ple size differences between the GWAS scans that provide the data to go into an enrichment analysis. It is not possible to make direct comparisons between GWAS enrichment results that differed with respect to sample size, ranging from 720 subjects (Strict|WestEur) to 1,385 subjects (Spec| All). However, within a single sample (for example, Spec| All or Strict|WestEur), comparisons can easily be made be-tween all tissues including cerebellum, parietal and LCLs.
Additional mining of available GWAS data may provide new insight into the biology of autism while allowing the genetics community to leverage data from smaller studies of GWAS. Our study provides evidence for the hypothesis that SNPs below the genome-wide significant threshold (P =10-8) are functionally relevant to the development of autism and may yet contribute to risk. Additionally, our results point specifically to SLC25A12and PANX1/2and to pathways (such as, methyltransferase, ribosomal com-ponents) previously implicated in autism.
Conclusions
Our results demonstrate that loci moderately associated with autism are more likely to be brain-specific eQTL than randomly sampled loci conditioned on minor allele frequency. Moreover, targets for the eQTL identified among top signals from autism GWAS include compelling candidate genes such as SLC25A12 and the pannexins. These findings suggest that while very few SNPs from a GWAS reach genome-wide significance, it is likely that an abundance of SNPs at sub-significant thresholds are in-deed associated with disease risk. This study provides
further rationale for annotation-based approaches to GWAS methods.
Additional files
Additional file 1: Table S1.Includes all eQTL from enrichment analysis identified in parietal and cerebellar tissues, from all of the four primary GWAS analyses.Worksheets provided in the database include information on the eQTL target gene as well as the eQTL host gene.
Additional file 2: Table S2.Provides additional information on each gene that was targeted in cerebellum and parietal tissues by an autism-associated eQTL SNP.
Additional file 3: Table S3.Provides additional supplementary data regarding SLC25A12 eQTL including the original GWAS p-values and z-scores, parietal tissue eQTL p-values and beta scores and tagged and proxy SNPs for significant eQTL.
Abbreviations
ASD: autism spectrum disorder; AGP: Autism Genome Project; eQTL: expression quantitative trait loci; GWAS: genome-wide association study; LCL: lymphoblastoid cell line; PANX1: pannexin 1; PANX2: pannexin 2; SNP: single nucleotide polymorphism; SLC25A12: solute carrier family 25 member 12.
Competing interests
The authors declare they have no competing interests.
Sensory perception Biological process 708 10 4.62 + 0.02
Sensory perception of sound
Biological process 123 3 0.8 + 0.05
Carbohydrate metabolic process
Biological process 952 2 6.22 - 0.05
Cell motion Biological process 964 11 6.29 + 0.05
Cell adhesion Biological process 1333 14 8.7 + 0.05
Immune system process Biological process 2628 24 17.16 + 0.05
Cell surface receptor linked signal transduction
Biological process 2235 21 14.59 + 0.05
Structural constituent of ribosome
Molecular function 194 5 1.27 + 0.009
Hydrolase activity Molecular function 2236 8 14.6 - 0.4
Receptor activity Molecular function 1808 18 11.8 + 0.5
Methyltransferase activity Molecular function 132 3 0.86 + 0.05
Authors’contributions
LKD conducted analyses and drafted the manuscript. EG conducted analyses and assisted in drafting the manuscript. EKG assisted in drafting the manuscript. JAB and CL conducted analyses yielding brain eQTL data and participated in the drafting of the manuscript. EHC directed analyses and assisted in drafting the manuscript. JS directed analyses of the study and assisted in drafting the manuscript. NJC conceived of the study, directed analyses and helped to draft the manuscript. All authors read and approved of the final manuscript.
Acknowledgments
We wish to acknowledge the efforts made by the families who participated in the original AGP GWAS. We also wish to acknowledge the AGP-GPAC for their collection of the sample, dissemination of results and thoughtful discussion of the methods and results in our paper. The project described was supported in part by Grant Number by Grant Number R01 MH090937, P50MH094267, and by Grant Number P50 HD055751 from the Eunice Kennedy Shriver National Institute of Child Health and Human Development. Finally we would like to thank Suma Jacob, MD, PhD, for her review of the manuscript.
Author details
1Section of Genetic Medicine, Department of Medicine, University of
Chicago, Chicago, IL 60637, USA.2Division of Biostatistics and Epidemiology,
Medical University of South Carolina, Charleston, SC, USA.3Department of
Psychiatry, University of Chicago, Chicago, IL 60637, USA.4Department of
Psychiatry, University of Illinois, Chicago, IL 60608, USA.5Vanderbilt Brain
Institute, Vanderbilt University, Nashville, TN 37232, USA.
Received: 27 January 2012 Accepted: 22 March 2012 Published: 16 May 2012
References
1. American Psychiatric Association:Diagnostic and Statistical Manual-IV-text revision. Washington DC: American Psychiatric Association; 2000. 2. Folstein S, Rutter M:Genetic influences and infantile autism.Nature1977,
265:726–728.
3. Ma D, Salyakina D, Jaworski JM, Konidari I, Whitehead PL, Andersen AN, Hoffman JD, Slifer SH, Hedges DJ, Cukier HN, Griswold AJ, McCauley JL, Beecham GW, Wright HH, Abramson RK, Martin ER, Hussman JP, Gilbert JR, Cuccaro ML, Haines JL, Pericak-Vance MA:A genome-wide association study of autism reveals a common novel risk locus at 5p14.1.Ann Hum Genet2009,73:263–273.
4. Wang K, Zhang H, Ma D, Bucan M, Glessner JT, Abrahams BS, Salyakina D, Imielinski M, Bradfield JP, Sleiman PM, Kim CE, Hou C, Frackelton E, Chiavacci R, Takahashi N, Sakurai T, Rappaport E, Lajonchere CM, Munson J, Estes A, Korvatska O, Piven J, Sonnenblick LI, Alvarez Retuerto AI, Herman EI, Dong H, Hutman T, Sigman M, Ozonoff S, Klin A,et al:Common genetic variants on 5p14.1 associate with autism spectrum disorders.Nature 2009,459:528–533.
5. Weiss LA, Arking DE, Daly MJ, Chakravarti A:A genome-wide linkage and association scan reveals novel loci for autism.Nature2009,461:802–808. 6. Anney R, Klei L, Pinto D, Regan R, Conroy J, Magalhaes TR, Correia C, Abrahams
BS, Sykes N, Pagnamenta AT, Almeida J, Bacchelli E, Bailey AJ, Baird G, Battaglia A, Berney T, Bolshakova N, Bölte S, Bolton PF, Bourgeron T, Brennan S, Brian J, Carson AR, Casallo G, Casey J, Chu SH, Cochrane L, Corsello C, Crawford EL, Crossett A,et al:A genome-wide scan for common alleles affecting risk for autism.Hum Mol Genet2010,19:4072–4082.
7. Curran S, Bolton P, Rozsnyai K, Chiocchetti A, Klauck SM, Duketis E, Poustka F, Schlitt S, Freitag CM, Lee I, Muglia P, ITAN, Poot M, Staal W, de Jonge MV, Ophoff RA, Lewis C, Skuse D, Mandy W, Vassos E, Fossdal R, Magnusson P, Hreidarsson S, Saemundsen E, Stefansson H, Stefansson K, Collier D:No association between a common single nucleotide polymorphism, rs4141463, in the MACROD2 gene and autism spectrum disorder.Am J Med Genet B Neuropsychiatr Genet2011,156B:633–639.
8. Lu AT, Cantor RM:Allowing for sex differences increases power in a GWAS of multiplex Autism families.Mol Psychiatry2012,17(2):215–222. 9. Glessner JT, Wang K, Cai G, Korvatska O, Kim CE, Wood S, Zhang H, Estes A,
Brune CW, Bradfield JP, Imielinski M, Frackelton EC, Reichert J, Crawford EL, Munson J, Sleiman PM, Chiavacci R, Annaiah K, Thomas K, Hou C, Glaberson W, Flory J, Otieno F, Garris M, Soorya L, Klei L, Piven J, Meyer KJ,
Anagnostou E, Sakurai T:Autism genome-wide copy number variation reveals ubiquitin and neuronal genes.Nature2009,459:569–573. 10. Yaspan BL, Bush WS, Torstenson ES, Ma D, Pericak-Vance MA, Ritchie MD,
Sutcliffe JS, Haines JL:Genetic analysis of biological pathway data through genomic randomization.Hum Genet2011,129:563–571. 11. Nicolae DL, Gamazon E, Zhang W, Duan S, Dolan ME, Cox NJ:Trait-associated
SNPs are more likely to be eQTLs: annotation to enhance discovery from GWAS.PLoS Genet2010,6:e1000888.
12. Below JE, Gamazon ER, Morrison JV, Konkashbaev A, Pluzhnikov A, McKeigue PM, Parra EJ, Elbein SC, Hallman DM, Nicolae DL, Bell GI, Cruz M, Cox NJ, Hanis CL:Genome-wide association and meta-analysis in populations from Starr County, Texas, and Mexico City identify type 2 diabetes susceptibility loci and enrichment for expression quantitative trait loci in top signals.Diabetologia2011,54:2047–2055.
13. Gamazon ER, Badner JA, Cheng L, Zhang C, Zhang D, Cox NJ, Gershon ES, Kelsoe JR, Greenwood TA, Nievergelt CM, Chen C, McKinney R, Shilling PD, Schork NJ, Smith EN, Bloss CS, Nurnberger JI, Edenberg HJ, Foroud T, Koller DL, Scheftner WA, Coryell W, Rice J, Lawson WB, Nwulia EA, Hipolito M, Byerley W, McMahon FJ, Schulze TG, Berrettini WH,et al:Enrichment of cis-regulatory gene expression SNPs and methylation quantitative trait loci among bipolar disorder susceptibility variants.Mol Psychiatry2012, [Epub ahead of print].
14. Gamazon ER, Zhang W, Konkashbaev A, Duan S, Kistner EO, Nicolae DL, Dolan ME, Cox NJ:SCAN: SNP and copy number annotation. Bioinformatics2010,26:259–262.
15. Duan S, Huang S, Zhang W, Bleibel W, Roe C, Clark T, Chen T, Schweitzer A, Blume J, Cox NJ, Dolan ME:Genetic architecture of transcript-level variation in humans.Am J Hum Genet2008,82:1101–1113. 16. Johnson WE, Li C, Rabinovic A:Adjusting batch effects in microarray
expression data using empirical Bayes methods.Biostatistics2007,8:118–127. 17. Leek JT, Storey JD:Capturing heterogeneity in gene expression studies
by surrogate variable analysis.PLoS Genet2007,3:1724–1735. 18. Li Y, Willer C, Ding J, Scheet P, Abecasis GR:MaCH: using sequence and
genotype data to estimate haplotypes and unobserved genotypes.Genet Epidemiol2010,34:816–834.
19. Li Y, Willer C, Sanna S, Abecasis GR:Genotype imputation.Annu Rev Genomics Hum Genet2009,10:387–406.
20. Purcell S, Neale B, Todd-Brown K, Thomas L, Ferreira MA, Bender D, Maller J, Sklar P, de Bakker PI, Daly MJ, Sham PC:PLINK: a tool set for whole-genome association and population-based linkage analyses.Am J Hum Genet2007,81:559–575.
21. Thomas PD, Kejariwal A, Campbell MJ, Mi H, Diemer K, Guo N, Ladunga I, Ulitsky-Lazareva B, Muruganujan A, Rabkin S, Vandergriff JA, Doremieux O: PANTHER: a browsable database of gene products organized by biological function, using curated protein family and subfamily classification.Nucl. Acids Res.2003,31:334–341.
22. Anney RJ, Kenny EM, O'Dushlaine C, Yaspan BL, Parkhomenka E, Buxbaum JD, Sutcliffe J, Gill M, Gallagher L, Buxbaum JD, Sutcliffe J, Gill M, Gallagher L, Autism Genome Project:Gene-ontology enrichment analysis in two independent family-based samples highlights biologically plausible processes for autism spectrum disorders.Eur J Hum Genet2011,19:1082–1089.
23. Voineagu I, Wang X, Johnston P, Lowe JK, Tian Y, Horvath S, Mill J, Cantor RM, Blencowe BJ, Geschwind DH:Transcriptomic analysis of autistic brain reveals convergent molecular pathology.Nature2011,474:380–384. 24. Pasca SP, Portmann T, Voineagu I, Yazawa M, Shcheglovitov A, Pasca AM, Cord
B, Palmer TD, Chikahisa S, Nishino S, Bernstein JA, Hallmayer J, Geschwind DH, Dolmetsch RE:Using iPSC-derived neurons to uncover cellular phenotypes associated with Timothy syndrome.Nat Med2011,17:1657–1662. 25. Ananiev G, Williams EC, Li H, Chang Q:Isogenic pairs of wild type and
mutant induced pluripotent stem cell (iPSC) lines from Rett syndrome patients asin vitrodisease model.PLoS One2011,6:e25255.
26. Marchetto MC, Brennand KJ, Boyer LF, Gage FH:Induced pluripotent stem cells (iPSCs) and neurological disease modeling: progress and promises. Hum Mol Genet2011,20:R109–R115.
27. Swayne LA, Sorbara CD, Bennett SA:Pannexin 2 is expressed by postnatal hippocampal neural progenitors and modulates neuronal commitment.J Biol Chem2010,285:24977–24986.
32. Sakurai T, Ramoz N, Barreto M, Gazdoiu M, Takahashi N, Gertner M, Dorr N, Gama Sosa MA, De Gasperi R, Perez G, Schmeidler J, Mitropoulou V, Le HC, Lupu M, Hof PR, Elder GA, Buxbaum JD:Slc25a12 disruption alters myelination and neurofilaments: a model for a hypomyelination syndrome and childhood neurodevelopmental disorders.Biol Psychiatry 2010,67:887–894.
33. Silverman JM, Buxbaum JD, Ramoz N, Schmeidler J, Reichenberg A, Hollander E, Angelo G, Smith CJ, Kryzak LA:Autism-related routines and rituals associated with a mitochondrial aspartate/glutamate carrier SLC25A12 polymorphism.Am J Med Genet B Neuropsychiatr Genet2008, 147:408–410.
34. Ramoz N, Cai G, Reichert JG, Silverman JM, Buxbaum JD:An analysis of candidate autism loci on chromosome 2q24-q33: evidence for association to the STK39 gene.Am J Med Genet B Neuropsychiatr Genet 2008,147B:1152–1158.
35. Lepagnol-Bestel AM, Maussion G, Boda B, Cardona A, Iwayama Y, Delezoide AL, Moalic JM, Muller D, Dean B, Yoshikawa T, Gorwood P, Buxbaum JD, Ramoz N, Simonneau M:SLC25A12 expression is associated with neurite outgrowth and is upregulated in the prefrontal cortex of autistic subjects.Mol Psychiatry2008,13:385–397.
doi:10.1186/2040-2392-3-3
Cite this article as:Daviset al.:Loci nominally associated with autism
from genome-wide analysis show enrichment of brain expression quantitative trait loci but not lymphoblastoid cell line expression quantitative trait loci.Molecular Autism20123:3.
Submit your next manuscript to BioMed Central and take full advantage of:
• Convenient online submission
• Thorough peer review
• No space constraints or color figure charges
• Immediate publication on acceptance
• Inclusion in PubMed, CAS, Scopus and Google Scholar
• Research which is freely available for redistribution