R E S E A R C H A R T I C L E
Open Access
Experimental evolution of recombination
and crossover interference in
Drosophila
caused by directional selection for
stress-related traits
Dau Dayal Aggarwal
1, Eugenia Rashkovetsky
1, Pawel Michalak
2, Irit Cohen
1, Yefim Ronin
1, Dan Zhou
3,
Gabriel G. Haddad
3,4and Abraham B. Korol
1*Abstract
Background:Population genetics predicts that tight linkage between new and/or pre-existing beneficial and deleterious alleles should decrease the efficiency of natural selection in finite populations. By decoupling beneficial and deleterious alleles and facilitating the combination of beneficial alleles, recombination accelerates the
formation of high-fitness genotypes. This may impose indirect selection for increased recombination. Despite the progress in theoretical understanding, interplay between recombination and selection remains a controversial issue in evolutionary biology. Even less satisfactory is the situation with crossover interference, which is a deviation of double-crossover frequency in a pair of adjacent intervals from the product of recombination rates in the two intervals expected on the assumption of crossover independence. Here, we report substantial changes in
recombination and interference in three long-term directional selection experiments withDrosophila melanogaster: for desiccation (~50 generations), hypoxia, and hyperoxia tolerance (>200 generations each).
Results:For all three experiments, we found a high interval-specific increase of recombination frequencies in selection lines (up to 40–50 % per interval) compared to the control lines. We also discovered a profound effect of selection on interference as expressed by an increased frequency of double crossovers in selection lines. Our results show that changes in interference are not necessarily coupled with increased recombination.
Conclusions:Our results support the theoretical predictions that adaptation to a new environment can promote evolution toward higher recombination. Moreover, this is the first evidence of selection for different recombination-unrelated traits potentially leading, not only to evolution toward increased crossover rates, but also to changes in crossover interference, one of the fundamental features of recombination.
Keywords:D. melanogaster, Directional selection, Evolution of interference, Negative interference, Positive interference
* Correspondence:[email protected] 1
Institute of Evolution, University of Haifa, Haifa 3498838, Israel Full list of author information is available at the end of the article
Background
Unraveling the forces responsible for the nearly universal distribution of sex and recombination among eukaryotes is one of the central problems in evolutionary biology. Several classes of models based on the combinatorial consequences of recombination (initially suggested by Weismann [1]), have been developed to explain the maintenance of sex and recombination, including selec-tion against deleterious mutaselec-tions and combinaselec-tion of advantageous mutations [2–7], and genetic adaptation to varying environments, both biotic and abiotic [8–12]. Tight linkage between new and/or pre-existing beneficial and deleterious alleles should decrease the efficiency of natural selection, as a consequence of the Hill-Robertson effect [13], which includes various forms of interference in finite populations [14–17]. Recombin-ation accelerates the formRecombin-ation of high-fitness genotypes, which in turn can indirectly select for higher recombin-ation rates. The shared condition for such siturecombin-ations is negative linkage disequilibrium (LD; <0) between fitness loci, as a result of weak negative epistasis, spatially and temporally varying selection (biotic or abiotic), or gen-etic drift [14, 15, 18–20]. Despite the considerable pro-gress in theoretical analyses over the last decade, the interplay between mutation, recombination and selection remains a controversial issue in evolutionary biology, partly due to a lack of robust empirical evidence. As noted by Barton [21], “…although the basic theoretical framework is clear, we still do not know whether selection is generally strong enough, and has the right form, to give a general advantage to sex and recombination”. In this respect, it is worth mentioning the important and de-bated assumption of insufficient recombination as a limit to selection. Numerous studies support this hypothesis [20, 22–30], while opposite conclusions have also been reached [31–35] based on the idea that a low level of re-combination should be sufficient to achieve most of the benefits associated with this process [36].
The existence of significant genetic variation for re-combination is a precondition for efficient indirect selec-tion for recombinaselec-tion. Such variaselec-tion has indeed been demonstrated in many organisms [12, 37]. Experiments showing responses to direct selection for altered recom-bination frequency (rf) provide further evidence for gen-etic polymorphism at recombination-controlling loci [38–45]. A question arises as to whether selection for fitness-related traits can utilize this variation and lead to directional changes in rf. Theoretical models indicate that directional or variable selection for multilocus traits may promote evolution towards increased recombin-ation [18, 46]. A considerable increase inrfas a result of selection for various traits unrelated to recombination has indeed been observed in a few studies with Drosoph-ila melanogaster [47–52] (Additional file 1: Table S1).
Simulation analysis suggests that interaction between drift and selection could be the source of LD <0 in most of the studies where increased recombination was caused by selection for unrelated quantitative traits [53].
Substantial evidence indicates that the observed fre-quency of double crossovers in adjacent intervals usually differs from the product of recombination rates in the two intervals, which is expected on the assumption of independence, a phenomenon termed crossover interfer-ence [54, 55]. The degree of interferinterfer-ence is measured by the coefficient of coincidence (c), the ratio of observed to expected rates of double crossovers in target intervals: positive interference (c <1) corresponds to situations in which the occurrence of a crossover in one segment re-duces the probability of exchange in the second seg-ment, whereas negative interference (c >1) refers to situations in which the observed rate of double cross-overs is higher than the expected rate with independ-ence. Positive crossover interference is a common characteristic of meiotic organisms, with only a very few known exceptions (some fungi) where recombination pro-ceeds with no interference ([56] and references therein). It is generally assumed that negative crossover interference is mainly associated with intragenic recombination (gene conversion). Nevertheless, cases are known of a higher than expected frequency of double crossovers in adjacent segments of small genetic but large physical length. In
Drosophila melanogaster, a strong excess of double ex-changes was reported within a 4 cM segment of chromo-some 3 spanning the centromere and accounting for 25 % of its cytological length [57]. Similar results have been ob-tained in otherDrosophilastudies with autosomes [12, 58, 59], but not with the X chromosome [60]. Negative inter-ference in Drosophilahas also been shown to be associ-ated with the interchromosomal effect of translocations on recombination and in situations with temperature-induced recombination [59]. It has been suggested that negative interference could be a characteristic of gen-omic regions with a low density of recombination events [57]. Despite numerous physical and formal models of interference and corresponding statistical tools to analyze experimental data on interference, only one attempt has been undertaken to explain interference as an evolvable feature [61]. As empha-sized by Wang et al. [62], interference remains a mys-tery, an evolutionary conundrum. To our knowledge, this aspect has generally been overlooked, despite the
interesting models aimed at understanding the
mechanism.
facts that (1) the effect of long-term selection (50–200 generations) for three traits unrelated to recombination was evaluated over 16 marked intervals, with independ-ent replicates and (2) in addition to increased recombin-ation, relaxation of positive interference and the occurrence of significant negative interference were observed, which may be considered as first evidence of experimental evolution of crossover interference.
Results
For each of the three selection experiments, we esti-mated the recombination frequency and coefficient of crossover coincidence in backcrossed progeny (scheme in Additional file 2: Figure S1).
Effect of selection for desiccation tolerance on recombination
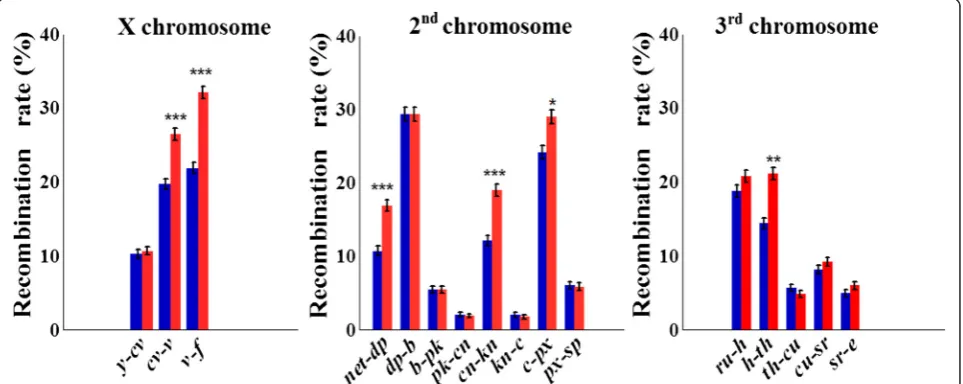
A highly significant interval-specific increase in rf was observed in each of the three large chromosomes in the selection lines compared to controls (Fig. 1, Table 1; Additional file 3). In the X chromosome, we observed a maximal relative increase in rf (δrf) in the proximal
interval v-f(from 21.9 to 32.1 %, δrf= 46.7 %, P= 3.1 ×
10–18) and a moderate increase in the intervalcv-v(from 19.7 to 26.4 %, δrf= 34.3 %, P= 4.1× 10⁻⁹). In
chromo-some 2, increased rf in selection versus control lines
was found in distal region net-dp of the 2 L arm
(from 10.7 to 16.9 %, δrf= 58.1 %, P= 2.5 × 10⁻⁸),
proximal region cn-kn of the 2R arm (from 12.1 to 19.0 %, δrf= 56.9 % P= 4.1 × 10⁻⁹), and c-px region of
the 2R arm (from 24.1 to 29.0 %, δrf= 20.0 %, P=
1.0 × 10⁻³). In chromosome 3, an increase in rf was
only detected in the interval h-th: from 14.4 to 21.1 (δrf= 46.6 %, P= 5.1 × 10–08). Altogether, in six out of
the 16 intervals, significantly higher rf values were obtained in selection lines, and an opposite significant effect was not observed in any of the intervals (Table 1). The sum of rf estimates across the tested intervals in chromosome X has changed from 51.9 to
69.2 (δ= 33.5 %), in chromosome 2 from 91.9 to
109.3 (δ= 18.9 %), in chromosome 3 from 52.0 to 61.9 (δ= 19.1 %), and for all 16 scored intervals, from 195.8 to 240.4 (22.8 %).
The increase inrfin the selection lines was accompan-ied by changes in crossover interference in adjacent and non-adjacent intervals (Table 2; Additional file 1: Table S2; Additional files 4 and 5). Thus, significant positive interference in the region y-cv-v of chromosome X in the control was replaced by no interference in the se-lection lines: the coefficient of coincidence c increased from 0.56 to 0.95 (P= 8.4 × 10⁻³). Moreover, in the
cv-v-f region, significant positive interference in the control (ĉ= 0.70) changed to significant negative inter-ference (ĉ= 1.40) in the selection lines; the difference between the two estimates was highly significant (P= 1.1 × 10⁻¹⁶). We did not find negative interference in chromosome 2, but the tendency towards significant relaxation of positive interference in the selection lines was expressed in both arms, e.g. in region net-dp-b in 2 L (from 0.35 to 0.81, P= 2.3 × 10⁻⁵) and in
cn-kn-px in 2R (from 0.38 to 0.91, P= 1.3 × 10⁻⁶). n arm 2R, this tendency was also observed for pairs of non-adjacent intervals, e.g. for cn-kn_c-px, with ĉ= 0.41 in the control and ĉ= 0.95 in the selection lines
(P= 3.1 × 10⁻⁶; Additional file 1: Table S2). As in chromosomes X and 2, selection caused a consistent and, in certain cases, highly significant tendency to-ward relaxation of positive interference in adjacent and non-adjacent intervals in chromosome 3. More-over, in some pairs of intervals, significant positive interference was replaced by significant negative inter-ference, e.g. in the h-cu-sr region, with ĉ= 0.41 in control and ĉ= 1.32 in selection lines (P= 5.1 × 10⁻⁷). Notably, we also observed a tendency toward relax-ation of positive interference for intervals separated by the centromere. For example, segmentsru-hand h-thare lo-cated in the 3 L arm, while cu-sr and sr-eare in the 3R arm (Additional file 2: Figure S2). A significant relaxation of positive interference was observed for several pairs of these intervals: forru-h_cu-sr, coefficientĉchanged from 0.52 to 1.14 (P= 2.3 × 10⁻³), for ru-h_cu-e from 0.41 to 0.92 (P= 4.0 × 10⁻⁴), and for ru-th_cu-sr from 0.36 to
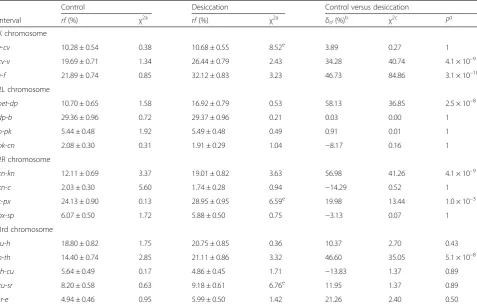
Table 1Effect of desiccation selection on recombination rates in 16 regions of theD. melanogastergenome
Control Desiccation Control versus desiccation
Interval rf(%) χ2a rf(%) χ2a δrf(%)
b
χ2c
Pd
X chromosome
y-cv 10.28 ± 0.54 0.38 10.68 ± 0.55 8.52e 3.89 0.27 1
cv-v 19.69 ± 0.71 1.34 26.44 ± 0.79 2.43 34.28 40.74 4.1 × 10⁻⁹
v-f 21.89 ± 0.74 0.85 32.12 ± 0.83 3.23 46.73 84.86 3.1 × 10⁻¹⁸
2L chromosome
net-dp 10.70 ± 0.65 1.58 16.92 ± 0.79 0.53 58.13 36.85 2.5 × 10⁻⁸
dp-b 29.36 ± 0.96 0.72 29.37 ± 0.96 0.21 0.03 0.00 1
b-pk 5.44 ± 0.48 1.92 5.49 ± 0.48 0.49 0.91 0.01 1
pk-cn 2.08 ± 0.30 0.31 1.91 ± 0.29 1.04 −8.17 0.16 1
2R chromosome
cn-kn 12.11 ± 0.69 3.37 19.01 ± 0.82 3.63 56.98 41.26 4.1 × 10⁻⁹
kn-c 2.03 ± 0.30 5.60 1.74 ± 0.28 0.94 −14.29 0.52 1
c-px 24.13 ± 0.90 0.13 28.95 ± 0.95 6.59e 19.98 13.44 1.0 × 10⁻³
px-sp 6.07 ± 0.50 1.72 5.88 ± 0.50 0.75 −3.13 0.07 1
3rd chromosome
ru-h 18.80 ± 0.82 1.75 20.75 ± 0.85 0.36 10.37 2.70 0.43
h-th 14.40 ± 0.74 2.85 21.11 ± 0.86 3.32 46.60 35.05 5.1 × 10⁻⁸
th-cu 5.64 ± 0.49 0.17 4.86 ± 0.45 1.71 −13.83 1.37 0.89
cu-sr 8.20 ± 0.58 0.63 9.18 ± 0.61 6.76e 11.95 1.37 0.89
sr-e 4.94 ± 0.46 0.95 5.99 ± 0.50 1.42 21.26 2.40 0.50
We scored 1,050 individuals of each line (three lines in control and three in selection variant); the total sample size was 6,300 for estimation of recombination frequency (rf) in X chromosome intervals. For each of the other crosses (2L, 2R, and 3), we scored 750 individuals per line, i.e. 4,500 per cross. Thus, the total sample for recombination analysis in desiccation selection experiment was 19,800 flies
a
χ2
test for between-lines heterogeneity within either control of selection variants (df = 2)
b
δrf(%), relative change ofrfin selection variant compared to control variant cχ2
test for significance betweenrfvalues in selection versus control (df = 1), seeMethods d
False discovery rate correctedPvalues (two-tailed test) based onχ2 c
are present to take into account the effect of multiple comparisons
eP
<0.05; for more details of this table, seeMethodsand Additional file3
Table 2Effect of desiccation selection on the coefficient of coincidence in adjacent intervals of the major chromosomes ofD. melanogaster
Intervals Control Desiccation χ2
ML P
y-cv-v 0.564 ± 0.086 0.947 ± 0.084 9.39 8.4 × 10⁻³
cv-v-f 0.698 ± 0.061 1.395 ± 0.045 72.75 1.1 × 10⁻¹⁶
net-dp-b 0.352 ± 0.065 0.813 ± 0.069 21.13 2.3 × 10⁻⁵
dp-b-pk 0.110 ± 0.054 0.220 ± 0.075 1.44 0.66
c-px-sp 0.060 ± 0.042 0.052 ± 0.036 0.02 1
ru-h-th 0.814 ± 0.099 1.101 ± 0.081 0.41 0.09
h-th-cu 0.109 ± 0.076 0.680 ± 0.154 10.20 5.4 × 10⁻³
th-cu-sr 0.192 ± 0.134 0.478 ± 0.206 1.34 0.71
cu-sr-e 0.109 ± 0.108 0.234 ± 0.133 0.50 1
Pvalues (two-tailed test) are based on unweighted likelihood tests for the difference between control and selection estimates, corrected for false discovery rate
0.73 (P= 5.8 × 10⁻³; Additional file 1: Table S3 and Additional file 5). As with adjacent intervals, replacement of significant positive interference in the control by signifi-cant negative interference in the selection lines was also found for non-adjacent intervals, e.g. for pair h-th_cu-sr, coefficientĉchanged from 0.49 to 1.56 (P= 1.9 × 10⁻⁶). Effect of two-way selection for hypoxia/hyperoxia tolerance on recombination
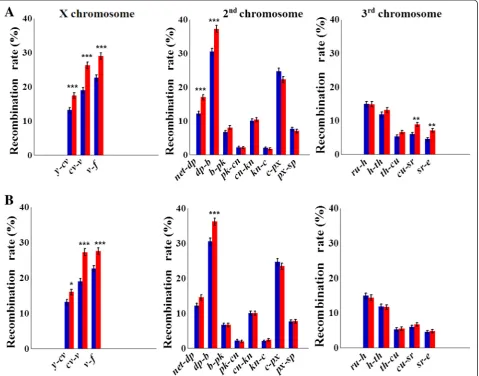
As with selection for desiccation tolerance, selection for both hypoxia and hyperoxia tolerance resulted in highly significant interval-specific increases inrf(Fig. 2, Table 3; Additional file 3). No significant decrease in rf was ob-served in any of the 16 marker intervals in either direc-tion of selecdirec-tion. In total, indirect selecdirec-tion for increased
recombination had a significant effect on more intervals in hypoxia lines than in hyperoxia lines (7 vs. 4). Fisher’s exact test for the 2 × 2 contingency table of the out-comes of these two experiments across 16 intervals indi-cated their significant association (P= 0.019). The observed changes in rf were more pronounced in the lines selected for hypoxia tolerance (Table 3), excluding the reaction of the cv-v interval, with δrf= 38.7 % (P=
5.1 × 10⁻⁸) and 43.7 % (P= 2.1 × 10⁻⁹) in hypoxia and hyperoxia lines, respectively. This interval was among the most reactive with respect to δrf in the entire
hyp-oxia/hyperoxia experiment. Other hyper-reactive inter-vals (all in hypoxia-tolerant lines) includednet-dpin the 2 L arm, withδrf= 39.4 % (P= 4.2 × 10⁻⁵), andcu-srand
sr-e in chromosome 3, with δrf= 47.0 % (P= 1.8 × 10⁻³)
and 56.9 % (P= 1.6 × 10⁻³), respectively.No change inrf
was observed in the 2R arm. The sum ofrfvalues across all 16 tested intervals changed from 192.9 to 228.7 (δ= 18.6 %) in hypoxia-selected lines and to 216.5 (δ= 12.2 %) in hyperoxia-selected lines.
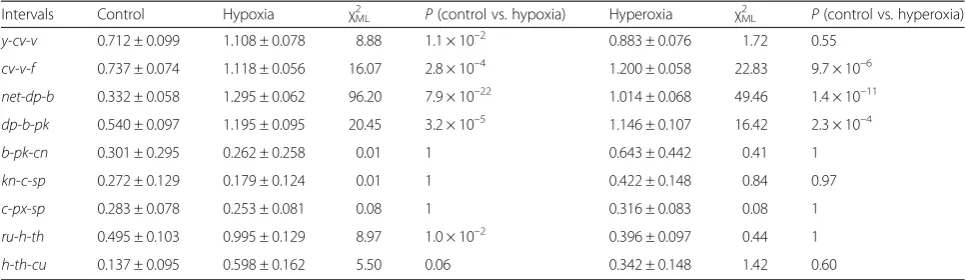
Selection for hypoxia and hyperoxia tolerance also caused relaxation of positive interference and appearance of negative interference. In the X chromosome, the latter effect was expressed particularly strongly, in both direc-tions of selection, in pairs of adjacent and non-adjacent in-tervals (Table 4; Additional file 1: Table S3 and Additional files 4 and 5). Remarkably, for they-cv-fregion, no inter-ference in the control (ĉ= 1.05) changed to highly signifi-cant negative interference in the selection lines:ĉ= 2.12 in hypoxia (P= 9.5 × 10⁻²⁸) and ĉ= 2.09 in hyperoxia (P= 6.8 × 10⁻²⁵). A similar pattern, for either adjacent or non-adjacent pairs of intervals (net-dp-b, dp-b-pk, net-dp_b-pk,
and net-dp_b-cn), was observed in the 2 L arm for both directions of selection (Additional file 1: Table S3). The difference between control and selection lines was more
pronounced for hypoxia selection and for adjacent pairs of intervals. Although selection had no significant effect on
rfin arm 2R, changes in crossover interference in adjacent and non-adjacent intervals of 2R were observed in the hyperoxia selection lines. Thus, for adjacent intervals, the coefficient of coincidence increased from ĉ= 0.43 to 0.72 (P =2.9 × 10⁻²) for cn-kn-sp, from 0.42 to 0.70 (P =1.8 × 10⁻²) forcn-c-sp, and from 0.37 to 0.66 (P =4.6 × 10⁻²) for
cn-px-sp. In chromosome 3, no changes inrfor interfer-ence were found in hyperoxia-tolerant lines. Although no increase in rf in the lines selected for hypoxia tol-erance was detected in the 3 L arm, we observed sig-nificant changes in interference in this arm: either considerable relaxation of strong positive interference (e.g. in h-th-sr region) or replacement of significant positive interference with no interference (e.g. inru-h
-th region). Relaxation of interference was also noted for non-adjacent intervals, including across-centromere ef-fects: for the pair of intervals ru-th_cu-e, coefficient ĉ changed from 0.15 to 0.49 (P =4.8 × 10⁻⁴).
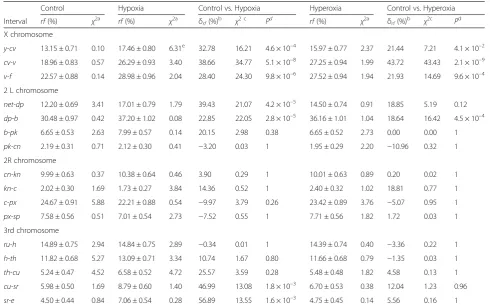
Table 3Effect of hypoxia and hyperoxia selection on recombination rates in 16 regions of theD. melanogastergenome
Control Hypoxia Control vs. Hypoxia Hyperoxia Control vs. Hyperoxia
Interval rf(%) χ2a rf(%) χ2a δrf(%)
b χ2 c
Pd rf(%) χ2a δrf(%)
b χ2c
Pd X chromosome
y-cv 13.15 ± 0.71 0.10 17.46 ± 0.80 6.31e 32.78 16.21 4.6 × 10⁻⁴ 15.97 ± 0.77 2.37 21.44 7.21 4.1 × 10⁻²
cv-v 18.96 ± 0.83 0.57 26.29 ± 0.93 3.40 38.66 34.77 5.1 × 10⁻⁸ 27.25 ± 0.94 1.99 43.72 43.43 2.1 × 10⁻⁹
v-f 22.57 ± 0.88 0.14 28.98 ± 0.96 2.04 28.40 24.30 9.8 × 10⁻⁶ 27.52 ± 0.94 1.94 21.93 14.69 9.6 × 10⁻⁴
2 L chromosome
net-dp 12.20 ± 0.69 3.41 17.01 ± 0.79 1.79 39.43 21.07 4.2 × 10⁻⁵ 14.50 ± 0.74 0.91 18.85 5.19 0.12
dp-b 30.48 ± 0.97 0.42 37.20 ± 1.02 0.08 22.85 22.05 2.8 × 10⁻⁵ 36.16 ± 1.01 1.04 18.64 16.42 4.5 × 10⁻⁴
b-pk 6.65 ± 0.53 2.63 7.99 ± 0.57 0.14 20.15 2.98 0.38 6.65 ± 0.52 2.73 0.00 0.00 1
pk-cn 2.19 ± 0.31 0.71 2.12 ± 0.30 0.41 −3.20 0.03 1 1.95 ± 0.29 2.20 −10.96 0.32 1
2R chromosome
cn-kn 9.99 ± 0.63 0.37 10.38 ± 0.64 0.46 3.90 0.29 1 10.01 ± 0.63 0.89 0.20 0.02 1
kn-c 2.02 ± 0.30 1.69 1.73 ± 0.27 3.84 14.36 0.52 1 2.40 ± 0.32 1.02 18.81 0.77 1
c-px 24.67 ± 0.91 5.88 22.21 ± 0.88 0.54 −9.97 3.79 0.26 23.42 ± 0.89 3.76 −5.07 0.95 1
px-sp 7.58 ± 0.56 0.51 7.01 ± 0.54 2.73 −7.52 0.55 1 7.71 ± 0.56 1.82 1.72 0.03 1
3rd chromosome
ru-h 14.89 ± 0.75 2.94 14.84 ± 0.75 2.89 −0.34 0.01 1 14.39 ± 0.74 0.40 −3.36 0.22 1
h-th 11.82 ± 0.68 5.27 13.09 ± 0.71 3.34 10.74 1.67 0.80 11.66 ± 0.68 0.79 −1.35 0.03 1
th-cu 5.24 ± 0.47 4.52 6.58 ± 0.52 4.72 25.57 3.59 0.28 5.48 ± 0.48 1.82 4.58 0.13 1
cu-sr 5.98 ± 0.50 1.69 8.79 ± 0.60 1.40 46.99 13.08 1.8 × 10⁻³ 6.70 ± 0.53 0.38 12.04 1.23 0.96
sr-e 4.50 ± 0.44 0.84 7.06 ± 0.54 0.28 56.89 13.55 1.6 × 10⁻³ 4.75 ± 0.45 0.14 5.56 0.16 1
For each cross, we scored 750 individuals of each line (3 lines each in control, hypoxia and hyperoxia variant) i.e., 6750 per cross. Thus, a total 27,000 flies were scored for recombination analysis in X chromosome, 2L arm, 2R arm and 3 chromosome in hypxoxia-hyperoxia experiment.
aχ2
test for between-lines heterogeneity within either control of selection variants (df = 2)
b
δrf(%), relative change ofrfin selection variant compared to control variant c
χ2
test for significance betweenrfvalues in selection versus control (df = 1), seeMethods d
False discovery rate correctedPvalues (two-tailed test) based onχ2c
are present to take into account the effect of multiple comparisons
eP
Between-replicate heterogeneity in recombination rates and changes in interference
Analysis of 16 genomic intervals showed segment-specific increases in recombination rate and relaxation of positive interference, or even its replacement by nega-tive interference in all three selection experiments com-pared to the corresponding controls. The question is whether the changes in interference, deduced using the estimates of coefficient of coincidence, represent a‘true’ cytogenetic effect, or an alternative process? Säll and Bengtsson [63] demonstrated that, even in the absence of negative interference, heterogeneity of recombination rates within a sample, with positive covariation of rf
values in two intervals, may lead to biased upwardĉand even to ĉ values highly significantly exceeding c= 1, i.e. the false discovery of negative interference. To reduce the risk of such outcomes when combining potentially hetero-geneous data from the replicated lines, we used a weighted maximum likelihood (ML) approach in addition to the standard ML approach (see Methods). A special analysis of data heterogeneity and correlation between rf values was performed to assess the possible effect onĉestimates.
As explained in Methods, the segregating progeny of each of the three replicate control and selection lines were obtained in three bottles each with approximately 250 flies (Additional file 2: Figure S1). Although each such trio of sub-samples represents the same selection or control line, analyzing them separately enables taking into account one additional source of variation on post-meiotic stages (differential survival of the progeny) that might affect the rf estimates. The small size of these sub-samples (n = 250) precludes the possibility of inter-ference analysis for a considerable portion of the interval pairs on such a sub-replicate level, but linkage analysis is still possible. Thus, based on nine data points (three rep-licate lines × three bottles of backcross segregants per line), we could calculate the correlation between rf
values for pairs of intervals, either adjacent and non-adjacent (Additional file 1: Tables S2 and S3 for desicca-tion and hypoxia/hyperoxia selection experiments, respectively). For each of the three experiments, the fol-lowing question can be addressed: is there any associ-ation between a significant change of c in selection material for certain interval pairs and a significant posi-tive correlation between rf values for the same interval pairs? The analysis (Additional file 1: Table S4a) suggests that this factor does not explain the cases of significant increase ofcvalues in selection lines in any of the three selection experiments. Likewise, cases with significant increase ofcin selection lines do not show strong asso-ciations with significant increase in rf in one or both segments (Additional file 1: Table S4b,c and Additional file 6: Text S1).
Additional observations on negative interference
In all three experiments, the most pronounced
changes toward negative interference were observed in the X chromosome. In the 2 L arm, negative interfer-ence appeared in a number of cases in hypoxia- and hyperoxia-tolerant lines, while desiccation-tolerant lines manifested only a reduction in positive interference. In the 2R arm, desiccation- and hyperoxia-tolerant lines showed relaxation of positive interference, while no such effect was observed in the hypoxia-tolerant lines. In some intervals of chromosome 3, negative interference appeared in the desiccation-tolerant lines, while only relaxation of positive interference was observed in hypoxia-tolerant lines, and there was no effect in hyperoxia-tolerant lines. We also found that negative interference caused by selec-tion can be accompanied by a decrease in rf over long intervals compared to controls. Thus,rf values along the X chromosome in hypoxia-tolerance selection lines sig-nificantly exceeded corresponding control values (Table 3): 17.46 vs. 13.15 in y-cv, 26.29 vs. 18.96 incv-v, and 28.98
Table 4Effect of hypoxia and hyperoxia selection on the coefficient of coincidence in adjacent intervals of the major chromosomes ofD. melanogaster
Intervals Control Hypoxia χ2
ML P(control vs. hypoxia) Hyperoxia χ2ML P(control vs. hyperoxia)
y-cv-v 0.712 ± 0.099 1.108 ± 0.078 8.88 1.1 × 10⁻² 0.883 ± 0.076 1.72 0.55
cv-v-f 0.737 ± 0.074 1.118 ± 0.056 16.07 2.8 × 10⁻⁴ 1.200 ± 0.058 22.83 9.7 × 10⁻⁶
net-dp-b 0.332 ± 0.058 1.295 ± 0.062 96.20 7.9 × 10⁻²² 1.014 ± 0.068 49.46 1.4 × 10⁻¹¹
dp-b-pk 0.540 ± 0.097 1.195 ± 0.095 20.45 3.2 × 10⁻⁵ 1.146 ± 0.107 16.42 2.3 × 10⁻⁴
b-pk-cn 0.301 ± 0.295 0.262 ± 0.258 0.01 1 0.643 ± 0.442 0.41 1
kn-c-sp 0.272 ± 0.129 0.179 ± 0.124 0.01 1 0.422 ± 0.148 0.84 0.97
c-px-sp 0.283 ± 0.078 0.253 ± 0.081 0.08 1 0.316 ± 0.083 0.08 1
ru-h-th 0.495 ± 0.103 0.995 ± 0.129 8.97 1.0 × 10⁻² 0.396 ± 0.097 0.44 1
h-th-cu 0.137 ± 0.095 0.598 ± 0.162 5.50 0.06 0.342 ± 0.148 1.42 0.60
Pvalues (two-tailed test) are based on unweighted likelihood tests for the difference between control and selection estimates, corrected for false discovery rate For more details, see Additional file1: Table S3
vs. 22.57 inv-f. Nevertheless, therfy-fvalue in control lines
was significantly higher than that in selection lines: 38.58 vs. 26.66 (Additional file 3). Similarly, a higherrfvalue for
y-f in control lines compared to selection lines was ob-served in the hyperoxia experiment (38.58 in control vs. 27.77 in selection) and desiccation experiment (39.26 in control vs. 31.46 in selection), as well as fornet-cnof the 2L arm in hypoxia and hyperoxia experiments (45.64 in control vs. 35.84 in hypoxia and 39.68 in hyperoxia; Additional file 3). This non-monotonicity can be ex-plained by the increased chance of double-recombination events observed among the component shorter intervals (see the corresponding estimates ofcin Additional file 1: Tables S2 and S3). Our results of non-monotonicity raises an important point about marker spacing in experimental recombination-evolution studies: by choosing intervals that are too long, one might actually observerfvalues that remain the same or appear to decrease even if the map length has truly increased (due to the increased chance of double crossovers). This comment may be relevant for some of the long intervals used in the previous studies and the current data.
Discussion
We estimated genomic changes in recombination in D. melanogaster caused by long-term selection (50–200 generations) for tolerance to desiccation, hypoxia, and hyperoxia. Using the same sets of markers, we provide robust evidence of indirect selection for recombination in all three experiments. We found that long-term selec-tion has resulted in a dramatic increase in recombin-ation rates in different genomic regions (up to 40–50 % per interval) relative to control levels. A higher response was displayed by the X chromosome compared to auto-somes in all the three experiments. No significant
reduc-tion in rf was observed in any of the 16 genomic
intervals analyzed, for any of the three experiments. Remarkably, in addition to the unidirectional changes in
rf, we observed a highly significant increase in the rate of double crossovers, expressed as relaxation of positive interference and occurrence of negative interference. Relaxation of positive interference was evident for all tested chromosomes in all three experiments, whereas the intervals with selection-induced negative interfer-ence differed between the selection regimes.
Crossover interference as an evolving phenotype
A comparison of meiotic mutants and normal geno-types leads to the conclusion that the genomic distri-bution of crossover exchanges in normal meiosis is more restricted and less proportional to physical dis-tances than in meiosis altered by mutations [64–66]. Thus, these restrictions may be largely a result of evolutionary adjustments of crossover distribution
along the chromosome. Relaxation of (positive) inter-ference in meiotic mutants has also been observed, despite a general tendency toward linkage tightening [67–69]. Such effects (crossover re-distribution along the chromosome and relaxation of interference) were also displayed by mei-mutants with increased recom-bination rates [70]. Such observations suggest that the direction and level of interference are evolvable phe-notypes. A first, formal analysis of interference-modifier evolution was conducted by Goldstein et al. [61]. Using numerical analysis, they showed that in an overdominance selection model, interference modifiers evolve to reduce the overall recombination rate, whereas in a mutation-selection balance model interference can evolve toward an overall increase in recombination if fitness effects of the selected loci are super-multiplicative. However, there has been no evidence available to date showing changes in interference in evolution experiments. Our results indicate that long-term directional selection for recombination-unrelated traits may lead not only to an increase in recombination rates, but also to re-laxation of positive interference and appearance of negative interference.
Alternative explanations for the obtained results
The repeatable observation of association between directional selection and increased recombination im-plies selection for rec modifiers [12, 71, 72] or changes in the respective genomic regions’ ability to recombine. These two mutually non-exclusive scenar-ios can be considered as changes in regulating and reacting systems of the hierarchical control of bination [12, 72]. The fixation of polymorphic recom-bination hotspot motifs can serve as an example of changes in the reacting system. Selection pressure may also strengthen the ability to recombine if the initial material was heterozygous for small inversions and evolved toward structural homozygosity due to selection and drift. However, despite our growing under-standing of the importance of structural heterozygosity in population-genetic experiments with D. melanogaster
[73], this assumption cannot explain the reproducibility of the observed patterns among replicates and the similarity ofrf values between the controls for desiccation and hyp-oxia/hyperoxia experiments, as well as their good corres-pondence with the standardD. melanogastergenetic map. More importantly, this assumption is also incompatible with exclusively upward changes inrfin all selection lines (Tables 1 and 3). Another assumption, that the increase in
prevalence of cis-regulation of recombination for all inter-vals that showed a selection-induced increase inrf; it also requires a further assumption of uniformity of signs of such LDs. Moreover, this explanation contradicts our find-ings of unidirectional changes of rf in both hypoxia and hyperoxia selection experiments, similar to earlier findings of unidirectional changes of rf in two-way selection for geotaxis [51].
Conclusions
Theoretical analysis shows that the fitness epistasis caused by truncation selection with a steadily moving optimum can have a powerful effect on selection for in-creased recombination in large populations [18]. An al-ternative mechanism is fluctuation of LD in small populations combined with directional selection, which may also lead to higher recombination [19]. In the present study, we observed increased recombination in three independent replicates of each selection experi-ment – for desiccation, hypoxia, and hyperoxia toler-ance. Presumably, both abovementioned mechanisms could play a role in the observed changes in recombin-ation. However, although selection × drift interaction may be an important factor contributing to the evolu-tionary advantage of increased recombination, the high uniformity of the replicates enables us to suggest that directional selection with a steadily moving optimum has played a leading role in the observed recombination response. As shown by Charlesworth [18], selection pressure on a rec-modifier when a trait is subject to se-lection with a steadily moving optimum should be suffi-cient to account for observed increases in rfin artificial selection experiments, especially for organisms with small chromosome number, likeD. melanogaster.
The observed pattern of recombination changes across the genome induced by selection for traits unrelated to recombination does not necessarily adequately reflect the distribution of loci affecting those traits. Flexon and Rodell [48] did find such a correspondence in their pio-neering study of the effect of selection for resistance to DDT on recombination inD. melanogaster and revealed a positive correlation between the chromosome contri-bution to resistance and the extent of change inrf rela-tive to the control level. It is worth noting that experiments involving direct selection for changed re-combination have shown that selection for rf in one region can result in a spectrum of correlated changes in other regions with different chromosomes being involved in this changed control of recombination [39, 41, 45]. Concerning our results, out of 188 genes residing in hypoxia-tolerance selected regions [74], 44 are located on the 3R arm and 144 on the X chromo-some; 10 of these genes from 3R and 52 from X
be-long to the intervals with observed significant
increases in rf(y-f for X and th-e for 3R). To evaluate whether the increase in rf is coordinated with the se-lection of new combinations of alleles of relevant tol-erance genes, these results should be complemented with fine-scale assays of recombination landscapes and genome scanning for footprints of selection. This would enable testing whether alterations in the re-combination system caused by long-term selection in-clude a change in the ‘spectrum of recombinants’, i.e. involvement in crossover exchanges in genomic re-gions that were excluded from crossing-over in con-trols [12, 68], or simply reflect a quantitative increase in rf.
Presumably, episodes of novel intensive selection pres-sures are not uncommon in nature [14, 15, 75]. As noted by Barton [14], “…it remains possible that local popula-tions experience far more directional selection, and that it is this which sustains widespread sex and recombin-ation”. D. melanogaster is one of the organisms that, at least outside of its native habitats in Africa, seems to undergo boom-bust cycles, dramatically reducing the long-term effective population size and allowing adapta-tion in the boom years to occur in populaadapta-tions of large short-term effective population size, enabling short-term evolution to act primarily on pre-existing intermediate-frequency genetic variants that are driven the rest of the way to fixation via soft sweeps [76, 77]. The results of the current study indicate that selection for stress toler-ance can lead to a considerable increase in the level of recombination and also deeply modify such basic fea-tures of recombination as crossover interference, dis-played by relaxation of positive interference, and even evolution of negative interference. Till now, theoretical studies of recombination evolution have been concen-trated on the central question of ‘why sex and recom-bination?’, ignoring the fact that several important features of recombination also remain unexplained, including its environmental dependence, widespread occurrence of crossover interference, sex differences in rf, and its species-specificity, to name just a few ([12, 71, 78]; but see [12, 79, 80]). Comparative ana-lysis of recombination in ecologically divergent popu-lations and assessment of changes in recombination in selection experiments may serve as an important source of evidence for better understanding of the mechanisms of maintenance of sexual recombination and explaining why recombination is so variable within and between species.
Methods
Three sets ofD. melanogasterlines resulting from long-term directional selection for stress tolerance were employed in our experiments: (1) three
generations; (2) three lines tolerant to severe hypoxic stress generated through long-term experimental selec-tion (for more than 200 generaselec-tions), and (3) three hyperoxia-tolerant lines. Details of the experimental scheme for hypoxia-tolerance selection were provided elsewhere [81, 82]. Peculiarities of the selection for hyperoxia tolerance are described by Zhao et al. [83]. Selection for desiccation tolerance was performed by DDA.
Selection for desiccation tolerance
Wild individuals of D. melanogaster (n = 120) were col-lected in March 2009 from Madhya Pradesh, Jabalpur, India (23°30’N; 80°01’E; alt. 393 m). Before the start of the selection experiment, mass culture was maintained for five generations under standard laboratory conditions at low density (on yeast-cornmeal-agar medium at 21 °C, and ~70 % relative humidity) to eliminate environmental effects. For laboratory selection, virgin flies were sexed under CO2 anesthesia at least 48 h prior to the experi-ment. Then, virgin flies (3–4 days old) were placed in groups of 25 into plastic vials containing 2 g of silica gel
and covered with foam discs. Experiments were
conducted for males and females separately. Flies were subjected to desiccation stress until approximately LT70–LT85 level of mortality was reached. Control groups were established in the same manner, excluding water stress. In each generation, we examined approxi-mately 1,000 virgin flies of each sex per replicate, of which at least 100 males and 100 females survived the LT70–85cut-off to become the parents of the next gener-ation. For each group (selection and control), survivors were randomly allocated into three sub-groups (three replicates). The same protocol was repeated for 48 generations (each next generation was subjected to analogous treatment), and then selection was relaxed for 8–10 generations before initiating the recombination tests. The control lines were not subjected to any treat-ment and were maintained in comparable densities to the selection lines on standard media. In the present study, we used three control and three desiccation-resistant lines for recombination tests. Average desicca-tion tolerance of the initial populadesicca-tion was 14.8 h and 23.2 h (with SD = 2.88 and 3.44), for males and females, respectively. After 48 generations of selection, these tol-erance characteristics increased to 25.3 h and 43.6 h for males and females, respectively, i.e. 3.65 SDs and 5.93 SDs compared to the starting population.
Hypoxia- and hyperoxia-tolerant lines
Selection for hypoxia/hyperoxia tolerance was initiated after crossing 27 isofemale D. melanogasterlines (kindly provided by Dr. Andrew Davis), that varied considerably in acute anoxia test as well as for eclosion rates when
cultured under hypoxic or hyperoxic conditions. Males and virgin females (n = 20) were collected and pooled from each isofemale line. This parental population was reared at room temperature with standard food medium. F1embryos from the pooled population were separated and maintained in nine separate chambers, three each for control, hypoxia- and hyperoxia-selection experi-ments. Trial experiments were run to determine the starting O2 concentrations for hypoxia- and hyperoxia-tolerance selection. We analyzed the feasibility and tol-erance capacity of the F1 progeny of the parental cross to different O2 concentrations (i.e. 8, 6, or 4 % O2 for hypoxia selection and 60 %, 70 %, 80 % and 90 % O2 for hyperoxia selection). In addition, the tol-erance levels of each parental line to hypoxia or hyperoxia were measured by testing survival of each individual line in the hypoxic or hyperoxic environ-ments. In the pilot study, the selection for hypoxia tolerance was therefore started at 8 % O2 and for hyperoxia tolerance at 60 % O2. The low O2 concen-tration was gradually decreased by 1 % and the high O2was increased by 10 % every 3 to 5 generations to maintain the selection pressure. The population size was kept at around 2,000 flies in each generation. Eggs of the first egg laying for each generation were removed to limit genetic drift induced by the ‘ early-bird’ effect. After seven generations of selection, hyperoxia tolerance was increased to 80 % O2, and after 13 generations the hypoxia tolerance in the hypoxia-selected flies reached 5 %, a level that is le-thal for most of the control flies (Additional file 2: Figure S3). The hyperoxia-selected flies broke through the lethal hyperoxic level (90 % O2) after 13 genera-tions of selection, and the hypoxia-selected flies ex-hibited tolerance to a severe level of hypoxia (4 % O2, embryonic lethal to control flies) following 32 generations of selection. The lethality in these selec-tion experiments was defined as the level of oxygen in which D. melanogaster cannot complete develop-ment and reproduce.
Genetic crosses
50-to 60-hour old (post-eclosion) F1 virgin females to mate with marker males for approximately 48 hours. To obtain a sufficient number of flies per replicate for scoring recombination, each replicate line was di-vided into three sub-replicates before the start of re-combination experimentation. In this panel, we scored recombination in nine sub-replicates of three replicate lines each for control and selection. In the desiccation experiment, we scored 1,050 individuals of each repli-cate line (or 350 individuals per sub-replirepli-cate), i.e. a total 6,300 flies were counted for estimation of rf at the X chromosome. We scored 750 individuals of each replicate line (or 250 individuals per sub-replicate), i.e. 4,500 individuals each were scored for arms 2 L and 2R and chromosome 3. A total of 19,800 flies were counted for estimation of rf in the desiccation-selection experiment. Similarly, 750 flies per line, or a total 27,000 flies, were scored for rf in the hypoxia/hyperoxia experiments. In the three ex-periments, we scored a total of 46,800 individuals.
Statistical analysis
For each pair of intervals and each of the three control or selection lines, ML analysis was performed to esti-mate the recombination frequenciesr1kand r2ktogether with the coefficient of coincidence ck (k= 1,2,3). For a
pair of intervals, either adjacent or non-adjacent, the log-likelihood function had the following form:
log
Lðr1k;r2k;ckÞ
¼X
ij;k
nij;klog
pij;kðr1k;r2k;ckÞ
where i, j ϵ {0, 1} define whether the recombination event occurred in the first or second interval, respect-ively (0 – no recombination, 1 – recombination), k
denotes the replicate line, andpijkandnijkrepresent the
probability and the observed number of individuals of the genotype class ij in replicate linekin the backcross progeny (within control or selection). The frequencies for the four genotype classes were defined as:
p11;k¼ ðr1kr2kckÞ;
p01;k¼r2kð1−r1kckÞ;
p01;k¼r1kð1−r2kckÞ;
p00;k¼ ð1−r2k−r1kþr1kr2kckÞ:
The ML estimate θ^k of the vectorθk= (r1k,r2k,ck) for
k= 1,2,3 was obtained by numerical optimization of the log-likelihood functionL(θk), using the gradient-descent procedure in which all three parameters r1k, r2k and ck
are evaluated simultaneously in every iteration:
r1nþ1;k¼r1n;k−αnþ1∂
Lð Þθκ
∂r1k
r2nþ1;k¼r2n;k−αnþ1∂
Lð Þθκ
∂r2k
cnþ1;k ¼cn;k−αnþ1∂
Lð Þθκ
∂ck
wheren refers to iteration number,kto the line (within control or selection), and α to the step size. The vari-ances of the estimated parametersr1k,r2k,ckwere
calcu-lated as corresponding diagonal elements of the covariance matrix Vk= I−1(θ^k ) =Ik−1, where I is the Fisher’s information matrix [54]. The estimates of the parameter vectorΘ= (r1,r2,c) for the entire group (con-trol or selection) together with the vector VΘ of their variances, were obtained as:
^
Θ¼ X
iIiθ^ι
X
iIi
andVΘ¼ X
iIi
−1
This approach enables tests of the heterogeneity of the lines within selection and control groups, across the en-tire set of selection and control lines, and between selec-tion and control groups, with respect to the estimated parameters. To assess the heterogeneity of θ^k estimates of all three parameters (r1k,r2kck) in klines we can use
the following statistics that is asymptotically distributed asχ2with 3(k-1) degrees of freedom:
X23ðk−1Þ ¼X
m
^
Θ−θ^m
T
Im Θ^−θ^m
To assess heterogeneity of a single parameter p in k
lines the following statistics asymptotically distributed as χ2
with df =k-1 can be used:
X2k−1 ¼ X
m
^
Θ−θ^m
2
σ2
pm
where θ^k is the ML-estimate of θk, σpk2 is the squared
standard error of parameter pin the kthline, and Θ^ is the weighted mean of θ^k. Using this weighted likelihood approach, we can present the total heterogeneity of θ^k across all lines of control and selection groups as:
X2total controlð þselectionÞ¼ X2within controlð Þ
þX2
within selectionð Þ
þX2between control vsð :selectionÞ:
X2between control vsð :selectionÞ¼ X2total controlð þselectionÞ ‐X2within controlð Þ
‐X2within selectionð Þ
which is distributed approximately as χ2 with df = 1 upon H0{no difference between the compared groups (selection vs. control) for the parameterp}.
The importance of using this approach in testing the differences in interference derives from the fact that het-erogeneity of recombination rates within the sample (e.g. between replicate lines of the selection group), with positive co-variation of recombination rates in two inter-vals, may lead to biased upward estimates of cand even
c >1 [63]. Therefore, to reduce the danger of such out-comes while testing for significance between control and selection lines in each of the three experiments, we employed, wherever possible, the weighted ML estimates of recombination (Additional file 3) and interference (Additional files 4 and 5) parameters in weighted likeli-hood approach, in addition to the standard ML ap-proach (see below). However, where θc^ , the estimate of
c, was zero in one or more of the three control or selec-tion lines, its standard error was also zero, thereby over-weighting the estimates of c from the other two lines and leading to zero weighted average per selection or control. Thus, for all the data we also employed the standard and more direct ML approach allowing for each line, in both selection and control, to have its own
r1kandr2k. Namely, to test for significance of the
differ-ences ofcvalues in selection and control, we performed log-likelihood ratio test of H0 {one global c for all se-lected and control lines} versus H1{two c’s, one for all selected lines and one for all control lines}:
H1: {Θcontrol= (r1c,r2c,cc),Θselection= (r1s,r2s,cs)} vs. H0: {Θcontrol= (r1c,r2c,c),Θselection= (r1c,r2c,c)}, where pairs of vectors r1c and r2c represent the unknown rf values for the analyzed pair of intervals for the three control lines,r1s andr2s –the vectors of rfvalues for the three selection lines,ccandcs–the line-independent values of
coefficients of coincidence for control and selection groups, and cg– the global cunder the H0assumption that cs=cc. Therefore, the H0 and H1 hypotheses are specified by 14 and 13 parameters and the log-likelihood ratio test of H1versus H0is asymptotically distributed as χ2
with df = 1.
The obtained P values (for two-tailed test) were sub-jected to false discovery rate correction for multiple comparisons before demonstrations in tables, figures and text. For false discovery rate correction, we used a total 48 comparisons across three experiments (with 16 intervals in each) for the recombination rates, while 189 comparisons for the interference estimates.
Additional files
Additional file 1: Table S1.A review of previous reports on indirect selection for recombination inDrosophila melanogaster.Table S2.Effect of desiccation selection on the coefficient of coincidence in adjacent and non-adjacent intervals ofD. melanogaster.Table S3.Effect of hypoxia and hyperoxia selection on the coefficient of coincidence in adjacent and non-adjacent intervals ofD. melanogaster.Table S4.Coincidence of interval-pair cases of changes in interference with significant positive correlation betweenrfvalues in the interval-pairs (a) and with significant increases inrfin desiccation, hypoxia, and hyperoxia selection variants (b). (PDF 486 kb)
Additional file 2: Figure S1.Effects of selection for tolerance to desiccation, hypoxia, and hyperoxia stresses on recombination rates in Drosophila melanogaster: (a) general scheme; (b) a fragment of the flowchart for selected line D1 of the desiccation experiment.Figure S2.
Marker lines employed in the study. For each chromosome, a separate line was employed, excluding chromosome 2, where two lines (a and b) were used.Figure S3.The schematic presentation of hypoxia/hyperoxia selection experiment (PDF 497 kb)
Additional file 3:Estimates of recombination rates per replicate and entire variants (selection and control).(PDF 1054 kb)
Additional file 4:Estimates of the coefficients of coincidence for adjacent intervals per replicate and entire variants (selection and control).(PDF 2958 kb)
Additional file 5:Estimates of the coefficients of coincidence for non-adjacent intervals per replicate and entire variants (selection and control).(PDF 2103 kb)
Additional file 6:Text S1.Changes in recombination and interference are not necessarily directly coupled.(PDF 199 kb)
Abbreviations
c:Coefficient of coincidence; LD: Linkage disequilibrium; ML: Maximum likelihood;rf: Recombination frequency.
Competing interests
The authors declare that they have no competing interests.
Authors’contributions
DDA conducted the selection for desiccation tolerance and the entire recombination experiments and participated in data analysis and preparation of the manuscript. ER participated in experiments and preparation of the manuscript. PM participated in the preparation of the manuscript. IC and YR developed the algorithms; IC performed the data analysis. GH and DZ conducted the selection for hypoxia and hyperoxia. AK conceived the recombination study, and participated in data analysis and preparation of the manuscript. All authors read and approved the final manuscript.
Acknowledgments
We acknowledge with thanks the three reviewers and Graham Bell for their helpful comments and suggestions. We also thank Zeev Frenkel for productive discussions and help in computer simulations. The study was supported by Binational USA-Israeli Science Foundation (grant BSF # 2011438) and Postdoctoral fellowship for DDA from the Israeli Council for Higher Education and University of Haifa.
Author details
1
Institute of Evolution, University of Haifa, Haifa 3498838, Israel.2Virginia Bioinformatics Institute, Virginia Tech, Washington Street, MC 0477, Blacksburg, VA 24061-0477, USA.3University of California, San Diego, USA. 4Rady Children’s Hospital, San Diego, USA.
Received: 26 July 2015 Accepted: 27 October 2015
References
2. Fisher RA. The genetical theory of natural selection. Oxford: Oxford University Press; 1930.
3. Muller JH. Some genetic aspects of sex. Am Nat. 1932;66:118–38. 4. Felsenstein J, Yokoyama S. The evolutionary advantage of recombination.
Individual selection for recombination. Genetics. 1976;83:845–59. 5. Kondrashov A. Deleterious mutations and the evolution of sexual
reproduction. Nature. 1998;336:435–40.
6. Charlesworth B. Mutation-selection balance and the evolutionary advantage of sex and recombination. Genet Res. 1990;55:199–221.
7. Charlesworth B, Campos JL. The Relations between recombination rate and patterns of molecular variation and evolution inDrosophila. Annu Rev Genet. 2014;48:383–403.
8. Charlesworth B. Recombination modification in a fluctuating environment. Genetics. 1976;83:181–95.
9. Lenormand T, Otto SP. The evolution of recombination in a heterogeneous environment. Genetics. 2000;156:423–38.
10. Bell G, Maynard SJ. Short-term selection for recombination among mutually antagonistic species. Nature. 1987;328:66–8.
11. Carja O, Liberman U, Feldman MW. Evolution in changing environments: modifiers of mutation, recombination, and migration. Proc Natl Acad Sci U S A. 2014;111:17935–40.
12. Korol AB, Preygel IA, Preygel SI. Recombination variability and evolution. London: Chapman & Hall; 1994.
13. Hill WG, Robertson A. The effect of linkage on limits to artificial selection. Genet Res. 1966;8:269–94.
14. Barton NH. Genetic linkage and natural selection. Phil Trans R Soc B. 2010;365:2559–69.
15. Barton NH. Mutation and the evolution of recombination. Phil Trans R Soc B. 2010;365:1281–94.
16. Charlesworth B, Betancourt A, Kaiser VB, Gordo I. Genetic recombination and molecular evolution. Cold Spring Harb Symp Quant Biol. 2009;74:177–86. 17. Campos JL, Halligan DL, Haddrill PR, Charlesworth B. The relation between
recombination rate and patterns of molecular evolution and variation in Drosophila melanogaster. Mol Biol Evol. 2014;31:1010–28.
18. Charlesworth B. Directional selection and evolution of sex and recombination. Genet Res. 1993;61:205–24.
19. Barton NH, Otto SP. Evolution of recombination due to random drift. Genetics. 2005;169:2353–70.
20. Roze D, Barton NH. The Hill–Robertson effect and the evolution of recombination. Genetics. 2006;173:1793–811.
21. Barton NH. Why sex and recombination? Cold Spring Harbor Symposia Quant Biol. 2009;74:187–95.
22. Rice WR, Chippendale AK. Sexual recombination and the power of natural selection. Science. 2001;294:555–9.
23. Bachtrog D, Charlesworth B. Reduced adaptation of a non-recombining neo-Y chromosome. Nature. 2002;416:323–6.
24. Colegrave N. Sex releases the speed limit on evolution. Nature. 2002;420:664–6. 25. Goddard MR, Godfray HC, Burt A. Sex increases the efficacy of natural
selection in experimental yeast populations. Nature. 2005;434:636–40. 26. Betancourt AJ, Welch JJ, Charlesworth B. Reduced effectiveness of selection
caused by a lack of recombination. Curr Biol. 2009;19:655–60.
27. Williford A, Comeron JM. Local effects of limited recombination: historical perspective and consequences for population estimates of adaptive evolution. J Heredity. 2010;101 Suppl 1:S127–34.
28. Langley CH, Stevens K, Cardeno C, Lee YCG, Schrider DR, Pool JE, et al. Genomic variation in natural populations ofDrosophila melanogaster. Genetics. 2012;192:533–98.
29. McGaugh SE, Heil CSS, Manzano-Winkler B, Loewe L, Goldstein S, Himmel TL, et al. Recombination modulates how selection affects linked sites in Drosophila. PLoS Biol. 2012;10, e1001422.
30. Comeron JM. Background selection as baseline for nucleotide variation across theDrosophilagenome. PLoS Genet. 2014;10, e1004434. 31. Thompson V. Recombination and response to selection inDrosophila
melanogaster. Genetics. 1977;85:125–40.
32. Zeyl C, Bell G. The advantage of sex in evolving yeast populations. Nature. 1997;388(6641):465–8.
33. Bourguet D, Gair J, Mattice M, Whitlock MC. Genetic recombination and adaptation to fluctuating environments: selection for geotaxis inDrosophila melanogaster. Heredity. 2003;91:78–84.
34. Bullaughey K, Przeworski M, Coop G. No effect of recombination on the efficacy of natural selection in primates. Genome Res. 2008;18:544–54.
35. Webster MT, Hurst LD. Direct and indirect consequences of meiotic recombination: implications for genome evolution. Trend Genet. 2012;28:102–9.
36. Hurst LD, Peck JR. Recent advances in understanding of the evolution and maintenance of sex. Trends Ecol Evol. 1996;11:46–53.
37. Brooks LD, Marks RW. The organization of genetic variation for recombination inDrosophila melanogaster. Genetics. 1986;114:525–47. 38. Allard RW. Evidence for genetic restriction of recombination in the lima
bean. Genetics. 1963;48:1389–95.
39. Chinnici JP. Modification of recombination frequency inDrosophila. II. The polygene control of crossing over. Genetics. 1971;69:85–96.
40. Landner L. Genetic control of recombination inNeurospora crassa: correlated regulation in unlinked chromosome intervals. Heredity. 1971;27:385–92. 41. Kidwell MG. Genetic change of recombination value inDrosophila
melanogaster. I. Artificial selection for high and low recombination and some properties of recombination modifying genes. Genetics. 1972;70:419–32.
42. Shaw DD. Genetic and environmental components of chiasma control. II. The response to selection inSchistocerca. Chromosoma. 1972;37:297–308. 43. Dewees AA. Genetic modification of recombination rate inTribolium
castaneum. Genetics. 1975;81:537–52.
44. Turner JRG. Genetic control of recombination in the silkworm. Multigenic control of chromosome 2. Heredity. 1979;43:273–93.
45. Charlesworth B, Charlesworth D. Genetic variation in recombination in Drosophila. II. Genetic analysis of a high recombination stock. Heredity. 1985;54:85–98.
46. Barton NH. Linkage and the limits to natural selection. Genetics. 1995;140:821–41.
47. Lobashev ME, Ponomarenko VV, Polyanskaya GG, Tsapygina RI. On the role of nervous system in regulation of various genetic and cytological processes. J Evol Biochem (USSR). 1973;9:398–405.
48. Flexon PB, Rodell CF. Genetic recombination and directional selection for DDT resistance inDrosophila melanogaster. Nature. 1982;298:672–5. 49. Zhuchenko AA, Korol AB, Kovtyukh LP. Change of crossing-over frequency
inDrosophiladuring selection for resistance to temperature fluctuations. Genetica. 1985;67:73–8.
50. Gorodetsky VP, Zhuchenko AA, Korol AB. Efficiency of feedback selection for recombination inDrosophila. Genetika (USSR). 1990;26:1942–52 (in Russian). 51. Korol AB, Iliadi KG. Recombination increase resulting from directional
selection for geotaxis inDrosophila. Heredity. 1994;72:64–8.
52. Rodell CF, Schipper MR, Keenan DK. Modes of selection and recombination response inDrosophila melanogaster. J Heredity. 2004;95:70–5.
53. Otto SP, Barton NH. Selection for recombination in small populations. Evolution. 2001;55:1921–31.
54. Bailey NTJ. Mathematical theory of genetic linkage. Amen House, London: Oxford Univ. Press; 1961.
55. Berchowitz LE, Copenhaver GP. Genetic Interference: don’t stand so close to me. Curr Genomics. 2010;11:91–102.
56. Loidl J, Scherthan H. Organization and pairing of meiotic chromosomes in the ciliateTetrahymena thermophila. J Cell Sci. 2004;117:5791–801. 57. Sinclair DA. Crossing over between closely linked markers spanning the
centromere of chromosome 3 inDrosophila melanogaster. Genet Res. 1975;11:173–85.
58. Green MM. Conversion as a possible mechanism of high coincidence values in the centromeric region ofDrosophila. Mol Gen Genet. 1975;39:57–66. 59. Denell RE, Keppy DO. The nature of genetic recombination near the third
chromosome centromere ofDrosophila melanogaster. Genetics. 1979;93:117–30.
60. Lake S. Recombination frequencies and the coincidence in proximal X-chromosome regions including heterochromatin inDrosophila melanogaster. Hereditas. 1986;105:263–8.
61. Goldstein DB, Bergman A, Feldman MW. The evolution of interference: reduction of recombination among three loci. Theor Pop Biol. 1993;44:246–59.
62. Wang S, Zickler D, Kleckner N, Zhang L. Meiotic crossover patterns: obligatory crossover, interference and homeostasis in a single process. Cell Cycle. 2015;14:305–14.
63. Säll T, Bengtsson BO. Apparent negative interference due to variation in recombination frequencies. Genetics. 1989;122:935–42.
65. Szauter P. An analysis of regional constraints on exchange inDrosophila melanogasterusing recombination-defective meiotic mutants. Genetics. 1984;100:45–71.
66. Zetka MC, Rose AM. Mutantrec-1eliminates the meiotic pattern of crossing over inCaenorhabditis elegans. Genetics. 1995;141:1339–49.
67. Baker BS, Hall JC. Meiotic mutants: genie control of meiotic recombination and chromosome segregation. In: Ashburner M, Novitski E, editors. The Genetics and Biology of Drosophila, Vol 1a. New York: Academic; 1976. p. 351–434.
68. Zhuchenko AA, Korol AB. Recombination in evolution and Breeding. Moscow: Nauka; 1985. In Russian.
69. Bhagat R, Manheim EA, Sherizen DE, McKim KS. Studies on crossover specific mutants and the distribution of crossing over inDrosophilafemales. Cytogenet Gen Res. 2004;107:160–71.
70. Séguéla-Arnaud M, Crismani W, Larchevêque C, Mazel J, Froger N, Choinard S, et al. Multiple mechanisms limit meiotic crossovers: TOP3αand two BLM homologs antagonize crossovers in parallel to FANCM. Proc Natl Acad Sci. 2015;112:4713–8.
71. Korol AB. Selection for adaptive traits as a factor of recombination evolution: Evidence from natural and experimental populations. In: Wasser SP, editor. Evolutionary theory and processes: modern perspective. Dordrecht: Kluwer; 1999. p. 31–53.
72. Korol AB. Recombination. In: Levin SA, editor. Encyclopedia of Biodiversity, vol. 6. 2nd ed. Waltham: Academic Press; 2013. p. 353–69.
73. Tobler R, Franssen SU, Kofler R, Orozco-Terwengel P, Nolte V, Hermisson J, et al. Massive habitat-specific genomic response inD. melanogaster populations during experimental evolution in hot and cold environments. Mol Biol Evol. 2015;31(2):364–75.
74. Zhou D, Udpa N, Gersten M, Visk DW, Bashir A, Xue J, et al. Experimental selection of hypoxia-tolerantDrosophila melanogaster. Proc Natl Acad Sci U S A. 2011;108:2349–54.
75. Becks L, Agrawal AF. The evolution of sex is favoured during adaptation to new environments. PLoS Biol. 2012;10, e1001317.
76. Burke MK, Dunham JP, Shahrestani P, Thornton KR, Rose MR, Long AD. Genome-wide analysis of a long-term evolution experiment withDrosophila. Nature. 2010;467:587–90.
77. Karasov T, Messer PW, Petrov DA. Evidence that adaptation inDrosophilais not limited by mutation at single sites. PLoS Genet. 2010;6k:e1000924. 78. Butlin RK. Recombination and speciation. Mol Ecol. 2005;14:2621–35. 79. Zhuchenko AA, Korol AB, Preigel IA, Bronstein SI. The evolutionary role of
the dependence of recombination on environment. Theor Appl Genet. 1995;69:617–24.
80. Lenormand T. The evolution of sex dimorphism in recombination. Genetics. 2003;163:811–22.
81. Zhou D, Xue J, Chen J, Morcillo P, Lambert JD, White KP, et al. Experimental selection forDrosophilasurvival in extremely low O(2) environment. PLoS One. 2007;2(5), e490.
82. Zhou D, Xue J, Lai JC, Schork NJ, White KP, Haddad GG. Mechanisms underlying hypoxia tolerance inDrosophila melanogaster: hairy as a metabolic switch. PLoS Genet. 2008;4(10), e1000221.
83. Zhao HW, Zhou D, Nizet V, Haddad GG. Experimental selection for Drosophilasurvival in extremely high O2environments. PLoS One. 2010;5,
e11701.
Submit your next manuscript to BioMed Central and take full advantage of:
• Convenient online submission
• Thorough peer review
• No space constraints or color figure charges
• Immediate publication on acceptance
• Inclusion in PubMed, CAS, Scopus and Google Scholar
• Research which is freely available for redistribution