An Objective Wavelength Selection Method Based
on Moving Window Partial Least Squares for
Near-Infrared Spectroscopy
Long Xu, Jiangang Lu*, Qinmin Yang, and Jinshui Chen
State Key Laboratory of Industrial Control Technology, Department of Control Science and Engineering, Zhejiang University, Hangzhou 310027, China
Email: {xulong, jglu, qmyang, jschen}@iipc.zju.edu.cn Yingzi Shi
School of Education Science, Hangzhou Normal University, Hangzhou 310036, China Email : [email protected]
Abstract—An objective wavelength selection method is proposed for near-infrared (NIR) spectroscopy mainly to overcome the possible subjectivity introduced by moving window partial least squares regression (MWPLS). This improved procedure (iMWPLS) introduced an indicator to evaluate importance of each wavelength and then all wavelengths were ranked by these indicators. On the basis of the indicator ranking, a series of PLS models were constructed by starting with one wavelength and incorporating a new one until all wavelengths were involved. Finally, according to root mean square error of cross-validation (RMSECV) obtained by each model, wavelengths that constructed the optimal model were selected as informative ones while the others were discarded. Subsequently, this new objective procedure was applied to two real standard NIR datasets and the prediction performance was compared with full-spectrum PLS and the original MWPLS. Results demonstrated that iMWPLS could achieve an effective wavelength selection and improve predictive accuracy in near-infrared spectroscopy.
Index Terms— Near-infrared spectroscopy, Moving window partial least squares, Objective wavelength selection
I. INTRODUCTION
In the past three decades, near-infrared spectroscopic technique has been widely accepted as a powerful analytical tool in analytical chemistry due to its salient advantages such as simplicity, rapidity, efficiency, non-invasion, low cost[1-6]. Spectroscopists preferred to develop a calibration model with full spectrum, because theoretically, the predictive ability can be improved by the addition of spectral channels under some certain conditions[7], and moreover, full spectrum might contribute to a robust calibration model intuitively. However, along with the further study, it has been generally recognized that deleting wavelengths with serious nonlinearity or significant noises can improve
prediction performance, decrease modeling time and even be helpful to the stability of calibration model. Recently, considerable efforts have been made to develop algorithms that can distinguish informative wavelengths or remove non-informative ones from hundreds of spectroscopic data points. The recently developed methods for wavelength selection included generalized moving window partial least squares (MWPLS)[8], interval partial least squares regression (iPLS)[9], backward iPLS (BiPLS)[10], uninformative variable elimination (UVE)[11], successive projections algorithm (SPA)[12], intelligent algorithms such as genetic algorithm (GA)[13], simulated annealing (SA)[14] and some fusion methods based on the aforementioned algorithms[15].
Among theories of wavelength selection, one view is declared that, in near-infrared spectral data, if one wavelength proves informative, its neighborhood is very likely to be informative[8-9]. This interval selection strategy is mainly derived from the following two facts that near-infrared spectra is characterized by the vibrational modes of functional groups (such as C=H, N=H, O=H and S=H) and different functional groups result in quite different absorption bands. The functional group effect is by far the most dominant in the NIR spectrum[16]. Based on this strategy, MWPLS algorithm proposed by Jiang et al.[8] is one of the typical and widely used wavelength selection methods.
In MWPLS, a spectral window with a fixed-size H is moved throughout the whole spectrum, in more specific terms, if one window starts at the ith spectral channel, then its ending point will be the (i+H-1)th spectral channel. At each position, a series of PLS models with varying number of latent variables (LVs) are built and root mean square error of cross-validation (RMSECV) calculated with these models are plotted as a function of window position. On the basis of such RMSECV lines, informative region is determined under the following two conditions: an acceptable RMSECV level and a relatively small number of PLS model dimensionality (i.e. PLS components or latent variables). According to Jiang et al.[8], model dimensionality increases significantly if extra Manuscript received March 28, 2013; revised June 5, 2013.
variability created by some factors unrelated to analyze is taken into account when modeling. It should be noted that, access to informative region in MWPLS is quite dependent on the number of latent variables in the PLS model. So far, this method has been applied to determination of soil organic matter[17], EtOAc concentration in mixtures, human serum albumin, γ-globulin, glucose[18] and so on. However, there exist some disadvantages which may lead to poor analytical accuracy in modeling and/or users’ confusion during the process of MWPLS, so an objective method is proposed in this study to overcome the shortcomings especially the subjectivity introduced by MWPLS. The details of this new method and disadvantages of MWPLS will be described in the next section.
II. THE PROPOSED METHOD
The significant innovation of MWPLS is the deep study of the internal relationship between model dimensionality and wavelengths with much uncertainty or noise. However, to the author’s knowledge, there are total three aspects which may lead to poor prediction performance and affect the promotion of this algorithm in spectral analysis, as follows:
•In the process of MWPLS algorithm, two crucial conditions of an acceptable RMSECV level of informative region and a relatively small number of model dimensionality directly relate to the determination of informative intervals, but these two criterions are likely to introduce subjectivity into interval selection. Users may be plunged into confusion because it is not an easy task to determine the specific degree of an ‘acceptable’ RMSECV level and a ‘relatively’ small number of model dimensionality accurately. Although a representative informative region often shows a sharp characteristic of an upside down peak, region borders remain difficult to be identified objectively.
•In almost all applications, window position is used for denoting the starting position of this window, in other words, prediction performance of a window is always recognized as that of the first wavelength in this window and if a window-based model obtains a large RMSECV, the first wavelength will probably be eliminated. Though MWPLS adopting this strategy sometimes performed a good predictive ability, obviously this idea is not reasonable because each wavelength of that window made a contribution to the window-based model. It is not proper to simply treat the window prediction accuracy as that of single wavelength.
•Selection based on intervals always meet a difficulty that regions with a small size, especially those
be regarded as a common weakness of methods based on interval selection strategy.
Under the above circumstances, an objective method named iMWPLS is proposed here. This new method is a forward selection algorithm, i.e., PLS model starts with one wavelength and incorporates a new one until all wavelengths are involved. Based on importance ranking, the most important set of wavelengths will construct an optimal PLS model and be selected as informative for calibration model.
Step 1: A fixed-size window is employed to move throughout the whole spectrum. PLS models with varying components number are built and a series of RMSECV will be obtained at each window position. For each window, the smallest RMSECV of RMSECVs obtained by PLS models with different components number is determined to be window predictive ability so that a RMSECV line rather than RMSECV lines can then be plotted as a function of the window position.
Step 2: For each wavelength, an indicator, which reflects the importance for the final calibration model is calculated by equation (3).
Step 3: A series of PLS models are built in a stepwise way in accordance with wavelength indicator ranking.
Step 4: Wavelengths that construct the best PLS model are selected as informative ones while the others are eliminated.
The evaluation indices of how a given model performs are root mean square error (RMSE) and correction coefficient (R). RMSE and R are defined as the following equations:
RMSE =
N ) y y ( N 1 k 2 p , k k
∑
= − (1)(
)
(
)
∑
∑
= = − − − = test test N 1 k 2 k N 1 k 2 p , k k y y y y 1R (2)
where N is the number of observations, ykand yk,p are the
laboratory-measured value and the predicted value of the kth observation respectively, y is the mean of
laboratory-measured value in the dataset. RMSECV and RMSEP are calculated from the cross-validated observations and test set respectively.
Indicators are achieved by the following equation:
∑
= = i w 1 j j , i i i RMSECV W 1Indicator (3)
where Indicatori is the indicator of the ith wavelength, Wi is
Two standard datasets which can be easily obtained online are applied to investigate the performance of iMWPLS. A. Beer Dataset[9]
NIR spectra of total 60 observations are measured at 25 ℃ in the wavelength range from 400 to 2250nm with an interval of 2nm. Before data processing, K-stone method is applied to select 30, 15 and 15 observations as calibration set, validation set and test set respectively.
B. Corn dataset
This experimental dataset (one can download from www.eigenvector.com for free) includes NIR spectra of 80 corn observations with corresponding on starch content. This dataset was recorded on instrument ‘m5’ in the wavelength range from 1100 to 2498nm with a step of 2nm. 40 and 20 observations are divided into training set and validation set respectively while test set contains the rest 20 samples.
IV. RESULTS AND DISCUSSIONS
The original standard MWPLS program is from iToolbox (http://www.models.life.ku.dk/algorithms) for use with
MATLAB 7.11 (The Math Works, Natick, USA) while PLS algorithm and iMWPLS are carried out by in-house-written program. The model performance is evaluated by application of 5 segments cross-validation method with an upper limit of 10 PLS components. Size of windows in MWPLS and the new method are set to 21.
A. Beer Dataset Analysis
Fig.1(a) shows the first 10 RMSECV lines in the wavelength range from 400 to 2250nm. It is easy to identify an obvious valley in the ranges of 800~1370nm which certainly contains informative regions according to MWPLS theory, therefore it is magnified in Fig.1(b). One can observe that spectra interval of 866~978nm reaches a relatively small error level, and increase of more LVs cannot improve the performance of the model significantly. The above two typical characteristics indicate that wavelength between 866~978nm is an informative region. In the same manner, intervals of 1032~1096nm, 1182~1250nm and 1294~1356nm are chose to be another three informative regions. It must be noted that the boundaries are determined depending on the individual subjectivity to a certain degree.
400 600 800 1000 1200 1400 1600 1800 2000 2200 0
2 4 6 8 10 12 14 16 18
wavelength (nm)
RM
S
E
CV
(a) wavelength range from 400nm to 2250nm
800 900 1000 1100 1200 1300 0
0.5 1 1.5 2 2.5 3 3.5
wavelength (nm)
RM
S
E
CV
400 600 800 1000 1200 1400 1600 1800 2000 2200 0.5
1 1.5 2 2.5 3
wavelength (nm)
in
d
ic
a
to
r
0 100 200 300 400 500 600 700 800 900 1000 0
0.2 0.4 0.6 0.8 1 1.2 1.4
wavelength number
RM
S
E
CV
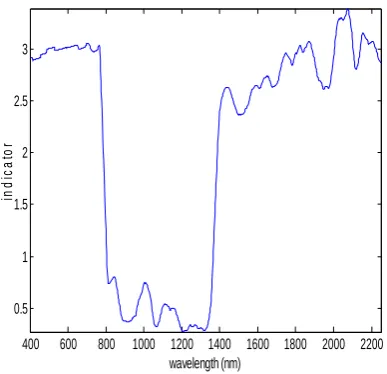
Fig.2 Wavelength indicator line of beer dataset Fig.3 RMSECV change line of beer dataset
Using iMWPLS method, wavelength indicator line is depicted in Fig.2, while Fig.3 shows the change of RMSECVs along with the introduction of wavelengths. In Fig.3, the RMSECV curve decreases sharply at first and subsequently reaches a minimum area, and then appears a slow ascendant trend. This phenomenon may be due to that a small number of informative wavelengths cannot fulfill the requirement for PLS calibration model in the beginning for lack of sufficient information, with increasing of wavelengths, a proper number of wavelengths is sought out and suited to construct an optimal model, at last, lots of wavelengths with low signal-to-noise ratios (SNR) are brought into models and result in the rising error level. In this beer data, 34 wavelengths are chosen to be informative finally.
Table I shows the prediction results of beer dataset. Firstly, the full-spectrum PLS model displays much worse performance than the models based on wavelength selection methods in terms of both R and RMSEP. Secondly, predictive ability of MWPLS models constructed with small
regions 866~978nm, 1032~1096nm and 1182~1250nm respectively expresses a better result than the model using combination of all four regions. These phenomena reconfirm the efficiency of wavelength selection in NIR spectral quantitative analysis. Another interesting situation is the former three MWPLS models adopting a less number of LVs than the one using intervals combination. This indicates that combination of regions lead into some nonlinear characteristic and thus the PLS model must employ more LVs to account for extra variability. Thirdly, iMWPLS gives the best prediction performance by making use of only 34 wavelengths in all PLS models. Moreover, three intervals obtained by iMWPLS are not totally located at the bottom of the valley in Fig.1(b). This illustrates that it is not proper to determine borders of informative regions depending on users' subjectivity and denoting the starting position of window with the window position. Finally, wavelength in the range 1286~1292nm selected by iMWPLS is neglected by MWPLS. The predicted vs. measured values based on two different models are shown in Fig.4.
TABLEI
PREDICTION RESULTS FOR BEER DATASET
Wavelength selection method Spectra ranges (nm) Variable number LVs R RMSEP
None 400~2250 926 5 0.9362 0.4745
MWPLS 866~978 57 7 0.9950 0.1368
MWPLS 1032~1096 33 4 0.9965 0.1466
MWPLS 1182~1250 35 4 0.9975 0.1176
MWPLS 1294~1356 32 4 0.9906 0.1881
MWPLS Combinationa 157 8 0.9957 0.1637
iMWPLS 1196~1232 1286~1292 1308~1328 34 5 0.9975 0.1011
10 11 12 13 14 15 16 10
11 12 13 14 15 16
measured value
p
redi
c
ted v
a
lue
10 11 12 13 14 15 16 10
11 12 13 14 15 16
measured value
p
redi
c
ted v
a
lue
(a) by the best MWPLS model with 1182~1250nm (b) by iMWPLS Fig.4 The predicted vs. measured values of beer dataset
B. Corn dataset Analysis
The natural logarithm of RMSECV calculated by MWPLS algorithm with varying PLS components are demonstrated in Fig.5. It is clearly seen that there exist total seven intervals (1138-1154nm, 1164~1220nm, 1644~1708nm, 1730~1782nm, 1980~1996nm, 2034~2080nm, 2160~2178nm) whose natural logarithm reach a low error level. However, three intervals (1138-1154nm, 1980~1996nm, 2160~2178nm) must be eliminated as uninformative regions because spectral intervals to be sought for must be larger than the predefined window size.
According to the new method, Fig.6 shows wavelength indicator line of corn dataset. Fig.7 depicts the RMSECV change line which displays a similar characteristic with Fig.3 in general terms, that is to say, RMSECV curve decreases in the beginning and then increases with the addition of variable number. However, RMSECV line in Fig.7 fluctuates much more markedly during the entire process other than Fig.3. After further study, it is found that this fluctuation is closely related to the continuous expansion of the selected intervals' boundary, i.e., after a PLS model constructed, even if adding one wavelength into this model, prediction accuracy of this model may become a lot more better or worse. This situation, from another aspect, implies that prediction performance can be influenced a lot by subjectivity of boundary of intervals, which is often encountered in MWPLS.
The predicted vs. measured values are given to show the significant performance differences between the best MWPLS model and iMWPLS in Fig.8. Table II shows the prediction results for corn dataset. As can be seen from Table
II, five of six informative intervals obtained by iMWPLS get smaller sizes than the preset window size. This phenomenon illustrates that introducing wavelengths in a stepwise manner can acquire smaller informative intervals which may be neglected by MWPLS, and moreover, the analysis process is completely objective. In Table II, iMWPLS model achieves the best prediction performance while almost all MWPLS models show worse result than full spectrum model. This visually demonstrates the effectiveness of iMWPLS and highlights the necessity of modification to MWPLS method.
1200 1400 1600 1800 2000 2200 2400 0.4
0.6 0.8 1 1.2 1.4 1.6 1.8
wavelength(nm)
RM
S
E
CV
1200 1400 1600 1800 2000 2200 2400 0.35
0.4 0.45 0.5 0.55 0.6 0.65 0.7 0.75 0.8 0.85
wavelength (nm)
indi
c
at
or
0 100 200 300 400 500 600 700 0
0.1 0.2 0.3 0.4 0.5 0.6 0.7 0.8
variable number
RM
S
E
CV
Fig.6 Wavelength indicator line by iMWPLS Fig.7 RMSECV line by iMWPLS along with wavelength number
63 63.5 64 64.5 65 65.5 66 63
63.5 64 64.5 65 65.5 66
measured value
pr
edi
c
ted v
al
ue
63 63.5 64 64.5 65 65.5 66 63
63.5 64 64.5 65 65.5 66
measured value
p
redi
c
ted v
a
lue
TABLE II
PREDICTION RESULTS FOR CORN DATASET
Wavelength selection method Spectra ranges (nm) Variable number LVs R RMSEP
None 1100~2498 700 17 0.9771 0.1908
MWPLS 1164~1220 29 7 0.9807 0.1566
MWPLS 1644~1708 33 7 0.8743 0.3853
MWPLS 1730~1782 27 6 0.9406 0.2799
MWPLS 2034~2080 24 3 0.8226 0.4704
MWPLS Combinationa 113 9 0.9701 0.2023
iMWPLS
1132~1232, 1658~1694 1740~1772, 1968~1994
2040~2078, 2162~2180 131 10 0.9919 0.1016
‘desired’ model complexity, using the window position to represent the starting point of the window, ignorance of the small size informative intervals. Under these situations, the newly proposed method completely compensate for these shortcomings by introducing an indicator to measure importance impact of each wavelength on calibration model. Two real datasets are used to test and verify the effectiveness and it is proved that iMWPLS has a potential application in near-infrared spectroscopy.
ACKNOWLEDGEMENT
This work was partially supported by the National Natural Science Foundation of China (NSFC) (No. 21076179), and the National Basic Research Program of China (973 Program: 2012CB720500).
REFERENCES
[1]. Watari M., Ozaki Y., Prediction of ethylene content in melt-state random and block polypropylene by near-infrared spectroscopy and chemometrics: comparison of a new calibration transfer method with a slope/bias correction method[J]. Applied spectroscopy, 2004. 58(10): p. 1210-1218. [2]. Liu F., He Y., Wang L., Determination of effective
wavelengths for discrimination of fruit vinegars using near-infrared spectroscopy and multivariate analysis[J].
Analytica chimica acta, 2008. 615(1): p. 10-17.
[3]. Zou X., Zhao J., Li Y., Selection of the efficient wavelength regions in FT-NIR spectroscopy for determination of SSC of ‘Fuji’apple based on BiPLS and FiPLS models[J]. Vibrational
spectroscopy, 2007. 44(2): p. 220-227.
[4]. Killner M. H. M., Rohwedder J. J. R., Pasquini C., A PLS regression model using NIR spectroscopy for on-line monitoring of the biodiesel production reaction[J]. Fuel, 2011.
90(11): p. 3268-3273.
[5]. Saerens L., Dierickx L., Quinten T., Adriaensens P., Carleer R., Vervaet C., et al., In-line NIR spectroscopy for the understanding of polymer-drug interaction during pharmaceutical hot-melt extrusion[J]. European Journal of
Pharmaceutics and Biopharmaceutics, 2012. 81: p. 230-237.
[6]. Moltgen C.V., Puchert T., Menezes J.C., Lochmann D., Reich G., A novel in-line NIR spectroscopy application for the monitoring of tablet film coating in an industrial scale process[J]. Talanta, 2012. 92: p. 26-37.
[7]. Lorber A., Kowalski B.R., The effect of interferences and calibration design on accuracy: Implications for sensor and sample selection[J]. Journal of chemometrics, 1988. 2(1): p.
67-79.
[8]. Jiang J., Berry R., Siesler H., Chen J., Lu Q., Wavelength interval selection in multicomponent spectral analysis by moving window partial least-squares regression with applications to mid-infrared and near-infrared spectroscopic data[J]. Analytical chemistry, 2002. 74(14): p. 3555-3565.
[9]. Nørgaard L., Saudland A., Wagner J., Nielsen J.P., Munck L., Engelsen S.B., Interval partial least-squares regression (iPLS): a comparative chemometric study with an example from near-infrared spectroscopy. Applied Spectroscopy, 2000. 54(3): p. 413-419.
[10].Leardi, R., Nørgaard L., Sequential application of backward interval partial least squares and genetic algorithms for the
selection of relevant spectral regions. Journal of
Chemometrics, 2004. 18(11): p. 486-497.
[11]. Centner, V., Massart D., Noord O.E.D., Jong S., Vandeginste B. M., Sterna C., Elimination of uninformative variables for multivariate calibration. Analytical chemistry, 1996. 68(21):
p. 3851-3858.
[12].Araújo M.C.U., Saldanha T.C.B., Galvao R.K.H., Yoneyama T., Chame H.C., Visani V., The successive projections algorithm for variable selection in spectroscopic
multicomponent analysis. Chemometrics and Intelligent
Laboratory Systems, 2001. 57(2): p. 65-73.
[13]. Jouan-Rimbaud D., Massart D., Leardi R., Noord O.E.D., Genetic algorithms as a tool for wavelength selection in multivariate calibration. Analytical Chemistry, 1995. 67(23): p. 4295-4301.
[14]. Kalivas J.H., Roberts N., Sutter J.M., Global optimization by simulated annealing with wavelength selection for ultraviolet-visible spectrophotometry. Analytical Chemistry,
1989. 61(18): p. 2024-2030.
[15].Ye S., Wang D., Min S., Successive projections algorithm combined with uninformative variable elimination for spectral
variable selection[J]. Chemometrics and Intelligent
Laboratory Systems, 2008. 91(2): p. 194-199.
[16].Zou X., Zhao J., Povey M.J.W., Holmes M., Mao H., Variables selection methods in near-infrared spectroscopy[J].
Analytica chimica acta, 2010. 667(1): p. 14-32.
[17].Kasemsumran S., Du Y., Murayama K., Huehne M., Ozaki Y.,
Simultaneous determination of human serum albumin, γ
-globulin, and glucose in a phosphate buffer solution by near-infrared spectroscopy with moving window partial least-squares regression[J]. Analyst, 2003. 128(12): p.
1471-1477.
[18].Chen H., Pan T., Chen J., Lu Q., Waveband selection for NIR spectroscopy analysis of soil organic matter based on SG
smoothing and MWPLS methods[J]. Chemometrics and
Intelligent Laboratory Systems, 2011. 107(1): p. 139-146.
Long Xu is currently a graduate student with the Department of
Control Science and Engineering, Zhejiang University. His research area is rapid detection based on near infrared spectroscopy inchemical process.
Jiangang Lu is currently a Full Professor with the State Key
Laboratory of Industrial Control Technology and the Department of Control Science and Engineering, Zhejiang University. His research interests include: modeling, control and optimization of complex engineering systems; scientific instruments and on-line process analyzers.
Qinmin Yang is currently an Associate Professor with the State
Key Laboratory of Industrial Control Technology and the Department of Control Science and Engineering, Zhejiang University. His research interests include: automatic micro-nano system, nano robotics, adaptive control theory and embedded control system.
Jinshui Chen is currently an Associate Professor with the
Department of Control Science and Engineering, Zhejiang University. His research interests include: industrial automation and embedded system.