Citation: Suleiman, Mohammed and Issac, Biju (2018) Performance Comparison of Intrusion
Detection Machine Learning Classifiers on Benchmark and New Datasets. In: 28th
International Conference on Computer Theory and Applications (ICCTA 2018), 30 October -
1 November 2018, Alexandria.
URL:
This version was downloaded from Northumbria Research Link:
http://nrl.northumbria.ac.uk/36411/
Northumbria University has developed Northumbria Research Link (NRL) to enable users to
access the University’s research output. Copyright
©and moral rights for items on NRL are
retained by the individual author(s) and/or other copyright owners. Single copies of full items
can be reproduced, displayed or performed, and given to third parties in any format or
medium for personal research or study, educational, or not-for-profit purposes without prior
permission or charge, provided the authors, title and full bibliographic details are given, as
well as a hyperlink and/or URL to the original metadata page. The content must not be
changed in any way. Full items must not be sold commercially in any format or medium
without formal permission of the copyright holder. The full policy is available online:
http://nrl.northumbria.ac.uk/policies.html
This document may differ from the final, published version of the research and has been
made available online in accordance with publisher policies. To read and/or cite from the
published version of the research, please visit the publisher’s website (a subscription may be
required.)
Performance Comparison of Intrusion Detection
Machine Learning Classifiers on Benchmark and
New Datasets
Mohammed F. Suleiman
School of Computing, Media and the ArtsTeesside University
Middlesbrough, United Kingdom [email protected]
Biju Issac
Dept. of Computer and Information Sciences Northumbria University
Newcastle, United Kingdom [email protected]
Abstract—With the tremendous growth of the Internet and the continuous increase in malicious attacks on corporate networks, Intrusion Detection Systems (IDS) have been designed and adopted by organizations to accurately detect intrusion and other malicious activities. But these IDSs still suffer from setbacks such as False Positives (FP), low detection accuracy and False Negatives (FN). To enhance the performance of IDSs, machine learning classifiers are used to aid detection accuracy and greatly reduce the false positive and false negative rate. In this research we have evaluated six classifiers such as Decision Tree (J48), Random Forest (RF), K-Nearest Neighbor (K-NN), Nave Bayes (NB), Support Vector Machine (SVM) and Artificial Neural Networks (ANN) on three different types of datasets such as NSL-KDD, UNSW-NB15 and Phishing dataset. Our results show that K-NN and J48 are the best performing classifiers when it comes to detection accuracy, testing time and false positive rate.
Index Terms—Intrusion detection, NSL-KDD, UNSW-NB15, K nearest neighbour (K-NN), Support vector machine (SVM), Machine learning, Weka, Nave Bayes (NB), Decision Tree (J48), Random forest (RF), Artificial Neural Networks (ANN)
I. INTRODUCTION
The continued occurrence of various network attacks such as; email spamming, spoofing attacks, document theft, Denial of Service (DoS) attacks etc., is still a major concern for net-work security experts and researchers. Despite the deployment of modern techniques and newly developed intrusion detection systems (IDSs) to combat network intrusions, attackers still find ways to develop sophisticated malicious programs that are able to bypass the IDSs and cause damage to organization’s resources. The recent adoption of machine learning classifiers in the design of intrusion detection systems is a key factor in improving the performance of IDSs as they enable intelligent learning, classification and differentiation between intrusive activity and normal activity [1].
The performance of intrusion detection systems is best evaluated on network datasets, but many of the current datasets suffer a lot of setbacks as the majority of the publicly available datasets are either heavily anonymized, do not reflect the current trend, or lack traffic variety and attack variety [2].
Eleven renowned datasets used from 1998 to date are mostly outdated, as they do not represent real-world traffic today [3]. Unfortunately, researchers continue to use existing datasets, mainly because they do not sufficiently understand the lim-itations of these datasets, which has led to most intrusion detection and prevention methodologies being evaluated using the wrong category of datasets [2].
The rest of this paper is organized as follows. Section II is the related works, section III is a discussion on datasets, section IV is the overview of machine learning classifiers, section V is the experimental analysis, section VI is on the results obtained, section VII is the discussion on results and section VIII is the conclusion.
II. RELATEDWORKS
In previous works, several classification algorithms have been evaluated on several datasets to measure performance of various Intrusion Detection Systems.
In [1], performance of forty-seven (47) classification algo-rithms were compared on the NSL-KDD dataset using the Gareth ranking techniques. K-NN, Rotation Forest and Ran-dom Tree were the best performing algorithms but Rotation Forest was ranked first, having the highest accuracy and lowest False Positive Rate (FPR).
In [5], the performance of data mining classification al-gorithms on two datasets was evaluated; KDD CUP’99 and HTTP Botnet trace using the Weka tool. K-NN produced very desirable accuracy with the lowest computation time when compared with SMO, MLP, J48 among other classification algorithms.
In [6], F-score and detection accuracy were the metrics used in evaluating ten classification algorithm on NSL-KDD dataset, Random Tree performed far better than RF, J48, SMO, Nave Bayes taking the shortest time to build the model with maximum detection rate.
Three datasets namely KDD99, NSL-KDD and Kyoto 2016 were tested with different classifiers and executed for 15 iter-ations to measure the performance of the classifier.
Instance-Based Knowledge (IBK) also known as K-NN had the shortest execution time and an accuracy of 99% [7].
In [8] they compare and evaluate normal and noisy NSL-KDD datasets using various classifiers to effectively estimate realistic performance in a noisy environment. The results show that Random Forest is noise tolerant and performs better than K-NN, Neural Network and Rotation Tree.
III. DATASETS
Three datasets were used in this experiment are namely NSL-KDD, UNSW-NB15 and Phishing datasets.
A. NSL-KDD Dataset
NSL-KDD Dataset is the reduced version of the KDD CUP’99 dataset. The dataset has the same features as the KDD99 which underwent pre-processing to reduce noise and inconsistency as well as remove the redundant and duplicate records of the KDD99 to ensure it is unbiased to frequent and redundant entries [9]. The NSL-KDD dataset has 25192 entries and 42 attributes, where 41 attributes are the same as the KDD dataset and the 42nd attribute contains data about the various 5 classes of network connection that are classified as one normal class and four attack classes: DoS, Probe, R2L and U2R [10].
B. UNSW-NB15 Network Dataset
The UNSW-NB15 Network Dataset represents nine major families of attacks by utilizing the IXIA perfect storm tools. There are 49 features that have been developed using Argus, Bro-IDS tools and twelve algorithms which cover character-istics of network packets. The final shape of the UNSW-NB15 dataset was converted from PCAP files to CSV files. It is a dataset that has a hybrid of real, modern, normal and contemporary synthesized attack activities as network traffic [11].
C. Machine Learning Phishing Dataset
The Phishing Dataset contains 10 attributes commonly asso-ciated with online transactions, e-commerce and e-businesses [12]. Different features related to legitimate and phishing websites from different sources were identified. 805 out of 1353 websites were collected a PHP script plugged with a web browser which is suspected to be either phishing attack or legitimate.
IV. OVERVIEW OFMACHINELEARNINGCLASSIFIERS
In this research, six main classification models were em-bedded into the recent Weka tools like Decision Tree, Neural Network, Random Forest, Nave Bayes, k-Nearest Neighbor and Support Vector Machine and are discussed below.
A. Decision Tree
Decision Tree (J48) is one of the three classification tech-niques in which a particular tree will be generated given nodes as attributes, leaves as classes and edges as testing results. Once the tree is built, it is applied to each record of the test dataset which results in the classification of that record [13].
B. Artificial Neural Network
Artificial Neural Networks (ANN) have distinctive character as a three-layered feedforward neural network: one input, one hidden, and one output layer. In order to link each node in each level, it may include an additional weight to properly adjust the path traversal selection process [6].
C. Naive Bayes
The Nave Bayes algorithm is a simple probabilistic classifier that calculates a set of probabilities by counting the frequency and combinations of values in a given data set. The algorithms use Bayes theorem and assume all attributes to be independent and give the value of the class variable [13].
D. K-Nearest Neighbor
K-Nearest Neighbor (K-NN) is used to perform the classi-fication considering k-sub-datasets, each of them has similar characteristics applying Euclidean Distance to figure out the group, and here, IBK is one of the most simplest k-Nearest-Neighbor classifiers [5].
E. Support Vector Machine
Support Vector Machines provide a simple geometrical interpretation in a high-dimensional feature space that is nonlinearly related to input space. SVMs provide a learning technique for Pattern Recognition and Regression Estimation. The solution provided by SVM is theoretically elegant, com-putationally efficient and very effective in many large practical problems [5].
F. Random Forest
Random Forest grows many classification trees. To classify a new object from an input vector, the input vector is added down each of the trees in the forest. One of the reasons for choosing this algorithm is because it runs efficiently on large databases, also learning is very fast in this algorithm [6].
V. EXPERIMENTALANALYSIS
In this work, we will be using Weka which is a collection of machine learning algorithms for data mining tasks to apply algorithms directly to the datasets. Weka has resources to en-able data pre-processing, classification, regression, clustering, association rules and visualization [14].
For dataset pre-processing, we are using KDD Train+20 percent.arff (Training data) for the NSL-KDD dataset, UNSW-NB15 training set.csv for the UNSW-UNSW-NB15 dataset and Phish-ingData.arff for the Phishing dataset. We test the performance of classifiers on these datasets using cross-validation tech-niques which is one of the standard ways of evaluating the performance of machine learning classifiers. Classifiers results were evaluated based on key performance metrics such as; detection accuracy, testing time, True Positive Rate, False positive rates, Precision, Recall and F-measure.
J48 Random Forest K-NN NB SVM ANN 0 20 40 60 80 100 120 99.55 99.76 99.44 88.59 97.32 98.24 89.39 90.14 86.31 50.1 86.8 81.91 90.76 89.95 88.32 84.11 86.03 88.77 NSL-KDD UNSB_NB15 PHISHING
Fig. 1. Detection accuracy of NSL-KDD, UNSW-NB15 and Phishing dataset
VI. RESULTS
Table I shows the result of classifiers performance on the three datasets. Detection accuracy for each classifier on the NSL-KDD dataset was very high. NB has the lowest accuracy of 88.59%, but good execution time of 0.14secs, SVM and ANN produce a very good accuracy of 97.32% and 98.24% and the worst execution time of 68.91 secs and 1987.86 secs respectively. J48 has an accuracy of 99.55percent and a time of 2.13 secs. K-NN have an accuracy of 99.44% and the best time of 0.01 sec. K-NN outperformed all other classifiers having the best time. Random Forest produced the highest accuracy of 99.76 percent with a time of 8.15 secs to build the model. For the UNSW-NB15 dataset, NB has the lowest accuracy with 50.1% and execution time of 0.71 secs, SVM and ANN produce a good accuracy of 86.80% and 81.91% and a high execution time 2120.46secs and 16025.36secs respectively. J48 have an accuracy of 89.39% and time of 15.37 secs. K-NN has an accuracy of 86.31 percent with the best time of 0.03 secs. RF produced the best accuracy of 90.14% with a time of 64.15 secs to build the model as shown in Figure 1.
The Phishing dataset, J48 has the highest accuracy of 90.76 percent and second-best time of 0.01sec. K-NN and NB took no time at all to execute with 0 secs each but differ in detection accuracy having both 88.32 percent and 84.11 percent. SVM has a detection accuracy of 86.03 percent and a time of 0.22 secs whereas ANN had a good accuracy of 88.77 percent and a time of 5.34 secs. RF has the second best accuracy and time with 89.95% and 0.025 secs respectively. Testing times for classifiers are shown in Figure 2.
Figure 3 also shows that on three datasets J48 had an overall best false positive rate and the best F-measure followed by RF and K-NN. ANN and SVM aslo had respectable false positive rates and F-measures. NB had the worst false positive rate and F-measure.
J48 Random Forest K-NN NB SVM ANN
0 2000 4000 6000 8000 10000 12000 14000 16000 18000 2.13 8.15 0.01 0.14 68.91 1987.86 15.37 64.14 0.03 0.71 2120.46 16025.36 0.01 0.025 0 0 0.22 5.34 NSL-KDD UNSB_NB15 PHISHING
Fig. 2. Time of NSL-KDD, UNSW-NB15 and Phishing Dataset
F-Me asure FP Rate TP Rate F-Me asure FP Rate TP Rate F-Me asure FP Rate TP Rate 0 0.2 0.4 0.6 0.8 1 1.2 ANN J48 KNN NB RF SVM NSL-KDD Phishing UNSB-NB15
Fig. 3. Other Performance metrics ofNSL-KDD, UNSW-NB15 and Phishing Dataset
VII. DISCUSSION
The detection accuracy and time was much better in NSL-KDD than UNSW NB15. This is because the UNSW NB15 dataset has more features and contains more attack classes than the NSL-KDD dataset. The performance of the classifiers decreased on the UNSW NB15 dataset and they also took a longer time to execute as shown in Figure 2. The phishing dataset had the shortest overall testing time across all classi-fiers because it had very few attack classes and fewer instances and attributes than NSL-KDD and UNSW NB15.
The results of the experiment show that SVM and ANN are more suitable for large datasets because they analyse and treat all instances equally in the dataset to ensure desirable accuracy and reduce the false positive rate and false negative. The downside is that SVM and ANN both require a lot of time for classification which is not ideal for intrusion detection. K-NN is perfect for a timely system as it produces good detection accuracy in no time irrespective of the size of the dataset.
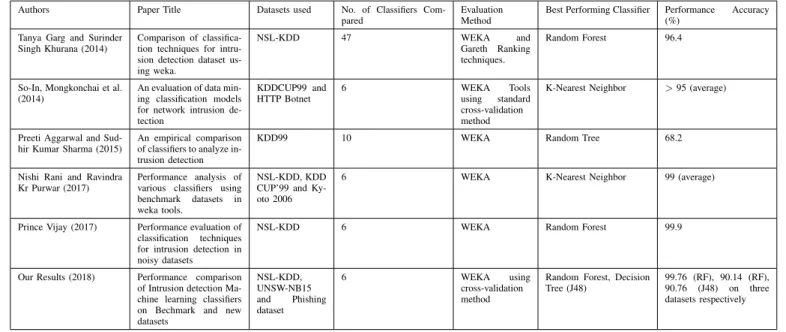
We further compared our results to related research in table II. The accuracy in percentage was 99.76 (RF), 90.14 (RF), 90.76 (J48) for NSL-KDD, UNSW-NB15 and Phishing dataset respectively. Our experiment results shows varied results with different datasets, with the accuracy results on new datasets
TABLE I
PERFORMANCERESULTS OFNSL-KDD, UNSW-NB15ANDPHISHING DATASET
Datasets Performance Metric J48 RF K-NN NB SVM ANN
Accuracy 99.55 99.76 99.44 88.59 97.32 98.24 Time (sec) 2.13 8.15 0.01 0.14 68.91 1987.86 TPR 0.995 0.996 0.993 0.877 0.959 0.973 FPR 0.005 0.001 0.004 0.088 0.014 0.009 Precision 0.995 0.999 0.995 0.897 0.983 0.989 Recall 0.995 0.996 0.993 0.877 0.959 0.973 NSL-KDD F-Measure 0.995 0.997 0.994 0.887 0.971 0.981 Accuracy 89.39 90.14 86.31 50.1 86.8 81.91 Time (sec) 15.37 64.15 0.03 0.71 2120.46 16025.36 TPR 0.982 0.978 0.972 0.627 0.963 0.965 FPR 0.003 0.001 0.006 0.015 0.001 0.019 Precision 0.991 0.998 0.981 0.927 0.996 0.938 Recall 0.982 0.978 0.972 0.627 0.963 0.965 UNSW NB15 F-Measure 0.986 0.987 0.976 0.748 0.979 0.952 Accuracy 90.76 89.95 88.32 84.11 86.03 88.77 Time (sec) 0.01 0.025 0 0 0.22 5.34 TPR 0.916 0.912 0.889 0.9 0.922 0.906 FPR 0.083 0.089 0.084 0.126 0.117 0.1 Precision 0.923 0.917 0.919 0.855 0.895 0.907 Recall 0.916 0.912 0.889 0.9 0.922 0.906 PHISHING F-Measure 0.919 0.914 0.904 0.893 0.908 0.907
like UNSW-NB15 and Phishing dataset lower than the bench-mark version like NSL-KDD.
When it comes to overall detection accuracy, RF outper-forms all other classifiers but requires much more time to classify for large datasets. J48 had a good accuracy and time. NB produces poor accuracy on large dataset but has a very fast execution time.
VIII. CONCLUSION
This work documents a hands-on experience in understand-ing the best machine learnunderstand-ing classifiers for intrusion detection datasets. Our experimental results show that K-NN and J48 are the best-performing machine learning classifiers in terms of detection accuracy, testing time and F-measure. Different classifiers had different advantages and disadvantages: K-NN had the best time, RF can produce the best accuracy and J48 had the best F-measure. We conclude that there is no perfect classifier for intrusion detection systems as classifiers have unique characteristics among them.
We recommend that future research should encourage the optimization of machine learning classifiers and also the use of hybrid classifiers or ensemble classifiers which is the combination of two or more classifiers together for better detection accuracy, producing lower training and testing times and lower false positive rates.
ACKNOWLEDGMENT
I am grateful to Teesside University for giving me the opportunity to study and conduct this research. Also my sincere appreciation goes to Dr Biju Issac and my colleagues Saul Johnson and Chidimma Opara for their friendly advice and assistance.
REFERENCES
[1] T. Garg and S.S. Khurana, ”Comparison of classification techniques for intrusion detection dataset using weka”, in Recent Advances and Innovations in Engineering (ICRAIE), IEEE, 2014, pp. 1–5.
[2] J.O. Nehinbe, ” A critical evaluation of datasets for investigating idss and ipss researches,” In Cybernetic Intelligent Systems (CIS), 2011 IEEE 10th International Conference on, IEEE, 2011. pp. 92–97.
[3] A. Shiravi, H. Shiravi, M. Tavallaee, and A. A. Ghorbani, ”Toward developing a systematic approach to generate benchmark datasets for intrusion detection,” computers security, 31(3):357-374, 2012. [4] A. Gharib, I. Sharafaldin, A. H. Lashkari, and A. A. Ghorbani,” An
evaluation framework for intrusion detection dataset,” In Information Science and Security (ICISS), 2016 International Conference on, IEEE, 2016. pp. 1-6.
[5] C. So-In, N. Mongkonchai, P. Aimtongkham, K. Wijitsopon, and K. Rujirakul,” An evaluation of data mining classification models for network intrusion detection,” In Digital Information and Communication Technology and its Applications (DICTAP), 2014 Fourth International Conference on, IEEE, 2014. pp. 90-94.
[6] P. Aggarwal and S. K. Sharma,” An empirical comparison of classifiers
to analyze intrusion detection,” In Advanced Computing
Commu-nication Technologies (ACCT), 2015 Fifth International Conference on,IEEE, 2015. pp. 446-450.
TABLE II
COMPARISON OF OUR RESULTS TO RELATED RESEARCH
Authors Paper Title Datasets used No. of Classifiers
Com-pared
Evaluation Method
Best Performing Classifier Performance Accuracy
(%) Tanya Garg and Surinder
Singh Khurana (2014)
Comparison of classifica-tion techniques for intru-sion detection dataset us-ing weka.
NSL-KDD 47 WEKA and
Gareth Ranking
techniques.
Random Forest 96.4
So-In, Mongkonchai et al. (2014)
An evaluation of data min-ing classification models for network intrusion de-tection KDDCUP99 and HTTP Botnet 6 WEKA Tools using standard cross-validation method
K-Nearest Neighbor >95 (average)
Preeti Aggarwal and Sud-hir Kumar Sharma (2015)
An empirical comparison of classifiers to analyze in-trusion detection
KDD99 10 WEKA Random Tree 68.2
Nishi Rani and Ravindra Kr Purwar (2017)
Performance analysis of various classifiers using
benchmark datasets in
weka tools.
NSL-KDD, KDD CUP’99 and Ky-oto 2006
6 WEKA K-Nearest Neighbor 99 (average)
Prince Vijay (2017) Performance evaluation of
classification techniques
for intrusion detection in noisy datasets
NSL-KDD 6 WEKA Random Forest 99.9
Our Results (2018) Performance comparison
of Intrusion detection Ma-chine learning classifiers on Bechmark and new datasets NSL-KDD, UNSW-NB15 and Phishing dataset 6 WEKA using cross-validation method
Random Forest, Decision Tree (J48)
99.76 (RF), 90.14 (RF),
90.76 (J48) on three
datasets respectively
[7] N. Rani and R. Kr. Purwar,” Performance analysis of various classi-fiers using benchmark datasets in weka tools,”International Journal of Engineering Trends and Technology (IJETT), 47(5), pp. 290–294. [8] P. Vijay,” Performance evaluation of classification techniques for
intru-sion detection in noisy datasets,” International Journal on Recent and Innovation Trends in Computing and Communication, 5(6):1011-1016, 2017.
[9] S. Duque and M. N. B. Omar,” Using data mining algorithms for developing a model for intrusion detection system (ids),” Procedia Computer Science, 61:46-51, 2015.
[10] L. Dhanabal and S.P. Shantharajah,” A study on nsl-kdd dataset for intrusion detection system based on classification algorithms,” Interna-tional Journal of Advanced Research in Computer and Communication Engineering, 4(6):446-452, 2015.
[11] N. Moustafa and J. Slay,” UNSW-NB15: A comprehensive data set for network intrusion detection systems (UNSW-NB15 network data set). In Military Communications and Information Systems Conference (MilCIS), 2015,IEEE, 2015. pp. 1-6.
[12] [12] N. Abdelhamid,” Website Phishing Data Set,” 2014. [Online]. Avail-able: https://archive.ics.uci.edu/ml/datasets/website+phishing [Accessed: Aug. 12, 2018].
[13] C. F. Tsai, Y. F. Hsu, C.Y. Lin, and W.Y. Lin,” Intrusion detection by machine learning: A review. Expert Systems with Applications,” 36(10):11994-12000, 2009
[14] M. N Mohammad, N. Sulaiman, and O. A.Muhsin,” A novel intrusion detection system by using intelligent data mining in weka environment,” Procedia Computer Science, 3:1237-1242, 2011.