P R O C E E D I N G S
Open Access
A LASSO penalized regression approach
for genome-wide association analyses
using related individuals: application to
the Genetic Analysis Workshop 19
simulated data
Charalampos Papachristou
1,2*, Carole Ober
3and Mark Abney
3FromGenetic Analysis Workshop 19 Vienna, Austria. 24-26 August 2014
Abstract
We propose a novel LASSO (least absolute shrinkage and selection operator) penalized regression method used to analyze samples consisting of (potentially) related individuals. Developed in the context of linear mixed models, our method models the relatedness of individuals in the sample through a random effect whose covariance structure is a linear function of known matrices with elements combinations of the condensed coefficients of identity between the individuals in the sample. We implement our method to analyze the simulated family data provided by the 19th Genetic Analysis Workshop in an effort to identify loci regulating the simulated trait of systolic blood pressure. The analyses were performed with full knowledge of the simulation model. Our findings demonstrate that we can significantly reduce the rate of false positive signals by incorporating the relatedness of the study participants.
Background
Current association methods for quantitative pheno-types are mostly designed for use with unrelated indi-viduals. However, often studies include information on families or related individuals. Also, many times sam-ples assumed to include only independent individuals may suffer from underlying cryptic relatedness among the participants. Using related individuals in statistical analyses has many advantages, such as increased ability for quality control and robustness of the results with respect to population stratification. Ignoring related-ness between study participants can have significant impact on the study results and increase false positive rates [1]. Linear mixed models (LMMs) have been
successfully used in genome-wide association studies (GWAS) to model effects shared by groups of individ-uals in the sample such as common genetic background or population stratification [1–4].
Because of the computational intensity involved in the estimation of the parameters of the LMM, most methods perform single marker analysis [5]. As GWAS typically in-clude a very large number of single-nucleotide polymor-phisms (SNPs), it is imperative to control for type I error. Typically, this is achieved through the use of some multi-plicity adjustment method such as Bonferonni’s. Lately, least absolute shrinkage and selection operator (LASSO) regression [6] has attracted attention as an alternative tool for selecting the most promising SNPs in GWAS [5, 7]. LASSO regression has the advantage that, by modelling multiple SNPs simultaneously, it can distinguish trait con-tributing loci from loci that are in high linkage disequilib-rium with those loci. Currently, all LASSO methods used in GWAS assume that the sample members are unrelated
* Correspondence:[email protected]
1
Department of Mathematics, Physics, and Statistics, University of the Sciences, 600 S. 43rd Street, Philadelphia, PA 19104, USA
2Department of Mathematics, Rowan University, 201 Mullica Hill Road, Glassboro, NJ 08028, USA
Full list of author information is available at the end of the article
to each other. However, this may not be true as often gen-etic studies recruit multiple members of families. As such, researchers usually restrict analyses to seemingly unrelated members of the samples. Alternatively, one can first run analyses based on LMM to remove the effects of related-ness among individuals and then use the residuals of these analyses to fit the LASSO models [7]. These approaches, however, can lead to loss of power as they make subopti-mal use of the data. Thus, a LASSO version that accounts for potential relatedness between study subjects is needed. We have developed a new association method that combines LMM and LASSO to capitalize on the bene-fits of both approaches. Our method handles multiple markers and models (potential) common genetic back-ground among individuals through the use of a random polygenic effect. It employs a LASSO algorithm [8] to estimate the model parameters and ultimately select loci potentially important in the regulation of a quanti-tative phenotype. We analyze all 200 replicates of the simulated family data available by the 19th Genetic Analysis Workshop (GAW19) [9] to study the proper-ties of the method with regards to its ability to yield true signals while maintaining low false positives.
Methods
Consider a sample of n (potentially) related individuals. Lety= (y1,…,yn) be the vector of the phenotypic values
of the quantitative trait of interest. We assume that for each person i the value of his/her phenotype is deter-mined (potentially) by a number, sayS, of (diallelic) loci/ SNPs, hereafter referred to as quantitative trait loci (QTLs). Furthermore, the trait is also influenced (poten-tially) byKknown covariates Xi,i = 1,…, K, (eg, age). In
addition, there is some environmental effect or residual, denoted as ei. Finally, we suppose the phenotype is
af-fected by a number of other loci whose collective (ran-dom) polygenic effect on the trait is denoted as ui.
Assuming additivity across all effects, the overall pheno-typic value of a person is
yi¼βXiþγZiþuiþei ð1Þ
whereβ=(β1,…,βK) is a vector of unknown coefficients
for the covariate fixed effects, γ=(γ1, …, γS) is a vector
of unknown coefficients of the fixed effect of the SNPs,
Zi=(z1,…,zL) a vector of 0, 1, or 2 s, denoting the
num-ber of copies of the disease (minor) allele carried by the individual at each of the loci. Note that, if a SNP does not contribute to the trait levels, we expect its
corre-sponding coefficient γs to be equal to zero. We assume
that the vector of random polygenic effectsu= (u1,…,un)
follows a multivariate normal distribution with mean 0
and covariance matrix Ω, while the errors eis are
inde-pendent and identically distributed coming from a normal
distribution with mean 0 and variance. Finally, the two
random effects, uiand ei, are considered independent of
each other and the covariates. Under these assumptions,
the joint distribution of the yi’s is a multivariate normal
distribution with mean equal toβX+γZand variance
co-variance matrix
Vy ¼Ωþσ2eI ð2Þ
whereXT= (X1,…,Xn),ZT= (Z1,…,Zn), andIis then×n
identity matrix. If there is minimal or no inbreeding
among the individuals in the sample, then the matrixΩis
approximately equal to
Ω¼2Φσ2apþΔσ2dp ð3Þ
whereΦ and Δare known matrices whose elements are
functions of the condensed coefficients of identity
be-tween the individuals in the sample, andσap2 andσdp2 are
the additive and dominance polygenic variance of the trait [4,10].
Estimation of the model parameters is done by maxi-mizing the corresponding multivariate normal likelihood. The fitting of the model, though, is computationally in-tense and plagued by many issues because of the high di-mensionality of the parameter space and the small available sample size. However, as mostγs are expected to be negligible, a LASSO method may be useful as it gener-ally forces most of the parameters in the model to shrink toward zero with only a small number of the parameters remaining significantly different from zero. In our case, the penalized likelihood function that needs to be maxi-mized to estimate the necessary parameters is given by the following equation:
) and λis a nonnegative penalty
par-ameter. Maximization of the above function can be achieved using an algorithm similar to that described by Schelldorfer et al. [8].
Results
and phenotypes. Note that the genotypes of all the indi-viduals were identical in all replicates. The only informa-tion varying from replicate to replicate was the simulated phenotypes.
We used the SBP at the last known appointment as the phenotype of interest and the imputed genotypes provided as those were used in the generation of the simulated phenotypes. Because of the large number of SNPs available, greater than 8,000,000, we preprocessed the genotypes to reduce the number of SNPs used in the analyses to reduce the computational burden. We excluded SNPs with minor allele count less than 10 copies in the entire data set (roughly minor allele fre-quency <0.01) to avoid potential problems with un-stable estimates of the model parameters in equation (1). We spaced the markers so that the minimum dis-tance between consecutive SNPs was at least 0.5 kbp. We did not consider filtering criteria that were based on the genotyping rate, call rate, or Hardy-Weinberg equilibrium as the data had already been cleaned with respect to those. The preprocessing of the genotypes resulted in a genetic map consisting of 952,366 SNPs. Not surprisingly, of the original 983 simulated QTLs, only 115 remained in the reduced map as the vast ma-jority of the QTLs under the simulation model had rare minor alleles.
The number of SNPs on the map was prohibitively large for directly implementing our approach. So, we im-plemented a 2-step scheme to reduce the number of SNPs used when fitting the penalized model. Two-step methods are routinely employed when the computa-tional intensity of a method prohibits direct use of the method on a GWAS [4]. In phase I, we performed a genome-wide scan using the association test for inde-pendent individuals as implemented in PLINK [11] to identify potentially“interesting” SNPs to be followed up
in phase II. We essentially used the same data on both phases of the analysis so results from the 2 analyses are dependent. However, the lack of independence does not pose a major issue in the validity of the results as the purpose of the 2-stage analysis is only to reduce the computational intensity and not for cross-validation. The phase I analysis was based only on data from the 295 unrelated individuals in the sample, while phase II used all 845 related individuals. In phase II, all SNPs that exceeded the set p value threshold (10E-04 or 10E-05) were used to fit the LASSO model. In all analyses in phase I or II, phenotypes were adjusted for gender, age, smoking status, and blood pressure medication.
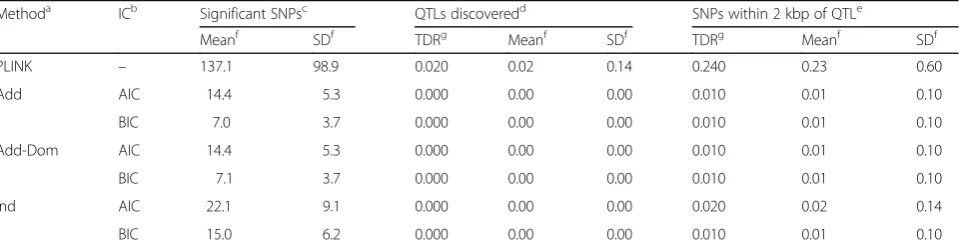
The results from the analyses of all replicates are sum-marized in Table 1. The threshold for declaring a SNP “significant” on phase I was set to a p <1E-05. A SNP was called as“significant”if its pvalue was less than the given threshold (for the PLINK analysis) or if its coeffi-cient was different from zero in the optimal LASSO model. We present the results for 3 LASSO analyses. The first, Add, represents an analysis in which the ran-dom polygenic effect was assumed to consist of only additive genetic variance, that is, the covariance struc-ture was assumed to be Ω= 2Φσa2. The second model,
Add-Dom, assumed that the trait had also a dominance effect and thus the matrix Ω was set to have the form Ω= 2Φσa2+Δσd2. Finally, for comparison, we also
imple-mented the standard LASSO method that assumes that all individuals in the study are unrelated, denoted as Ind. The standard LASSO approach is a subcase of our ap-proach where matrixΩis the 0 matrix.
The first group of columns in the table, “Significant SNPs,” summarizes the number of SNPs declared “ sig-nificant” by each method. The second section, “QTLs discovered,” summarizes the number of QTLs declared “significant” and is used to gauge the TDR of the
Table 1Results of the analyses of the 200 replicates of the simulated data for SBP
Methoda ICb Significant SNPsc QTLs discoveredd SNPs within 2 kbp of QTLe
Meanf SDf TDRg Meanf SDf TDRg Meanf SDf
PLINK – 137.1 98.9 0.020 0.02 0.14 0.240 0.23 0.60
Add AIC 14.4 5.3 0.000 0.00 0.00 0.010 0.01 0.10
BIC 7.0 3.7 0.000 0.00 0.00 0.010 0.01 0.10
Add-Dom AIC 14.4 5.3 0.000 0.00 0.00 0.010 0.01 0.10
BIC 7.1 3.7 0.000 0.00 0.00 0.010 0.01 0.10
Ind AIC 22.1 9.1 0.000 0.00 0.00 0.020 0.02 0.14
BIC 15.0 6.2 0.000 0.00 0.00 0.010 0.01 0.10
a
Method used/covariance structure of random polygenic effect (for LASSO):PLINKPLINK analysis results,Addassuming only additive genetic variance,Add-Dom
assuming both additive and dominance genetic effect,Indassuming members independent b
Information criterion used to select best model:AICAkaike,BICBayesian c
Number of SNPs with apvalue <1E-05 (PLINK) or nonzero coefficient on the optimal LASSO model d
Number of actual simulated QTLs with apvalue <1E-05 (PLINK) or nonzero coefficient on the optimal LASSO model e
Number of SNPs with apvalue <1E-05 (PLINK) or nonzero coefficient on the optimal LASSO model located within 2 kbps from a QTL f
Mean and standard deviation of the number of SNPs over the 200 replicates g
method. This column uses a very strict definition of what constitutes“true”hit. A more relaxed rule for what constitutes a true signal considered as a true hit any SNP that resided within (an arbitrary) 2 kbp from any QTL. There were 2248 SNPs on the map that were within 2 kbp from a simulated QTL. The results using this definition are summarized in the “SNPs within 2 kbp from QTL”section of the table.
From Table 1, we can see that, even though PLINK identified, on average, 137.1 SNPs as significant, in only 2 % of the replicates did these SNPs include any simu-lated QTL, while approximately 24 % of the replicates included at least 1 significant SNP within 2 kbp of a QTL. This result, along with the fact that of the 115 QTLs remaining after genotype cleaning PLINK was able to identify approximately 0.02 QTLs per replicate, suggests a poor performance of the method in phase I. This performance can be partially explained by the low contribution of each QTL on the phenotype and the small sample size, which resulted in low power to de-tect these QTLs.
The results from the LASSO analyses show that mod-eling the relatedness of the individuals in the sample pays off, regardless of whether we did (Add-Dom) or did not (Add) model the dominance effect. The LASSO method for related individuals, on average, reduced the number of SNPs with nonzero coefficients in the final model relatively to the corresponding number from the standard LASSO method (Ind). For example, when the Bayesian information criterion (BIC) was used to select the best model, the Ind model resulted in 15 significant SNPs, whereas both the Add and the Add-Dom models included, on average, approximately 7“significant”SNPs,, marking a reduction of approximately 53 % in the number of “significant” SNPs. For this particular data, it appears that using the more complex modeling of the covariance structure of the random effect had no significant effect on the performance of the method, as the results from both the additive (Add) and the additive-dominance (Add-Dom) models were almost identical. This was ex-pected as the particular phenotype (SBP) was generated using a model with only additive effects. The choice of
the information criterion was also not surprising. BIC being stricter resulted in models that, on average, in-cluded fewer SNPs with nonzero coefficients, 7.1 from 137.1, than when Akaike information criterion (AIC) was used. The actual TDR of the method, though, ap-pears very low (approximately 1 %). This is not surpris-ing as the TDR of the method was affected by the low discovery rate of the PLINK analysis.
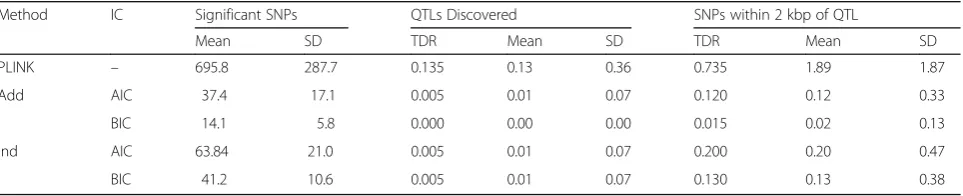
To further study the TDR of the LASSO method, we reanalyzed the data using a less-strict threshold, p <1E-04, for declaring significant SNPs with the PLINK analysis in hopes of increasing the number of actual simulated QTLs “identified” in the phase I analyses. For the LASSO model, we opted not to fit the Add-Dom model as it significantly increases the analysis time and, based on the analysis above, we did not an-ticipate the results of the 2 models to significantly differ. Table 2 presents the results. Even though the new threshold in the GWAS analysis resulted in an average of approximately 695.8 significant SNPs, it did not increase the number of true hits. The PLINK analysis uncovered at least 1 QTL in approximately 74 % of the replicates, with an average of 1.9 SNPs within 2 kbp from a simulated QTL. Consequently, the TDR of the LASSO methods was low, less than 20 %, with the models resulting from the BIC criter-ion having an even lower TDR. In contrast, the LASSO model with the additive component was able to significantly reduce the number of SNPs with non-zero coefficients in the optimal model from approxi-mately 695.8 SNPs to only 14.1, marking a 3-fold decrease from the corresponding number from the independent LASSO (41.2 SNPs on average).
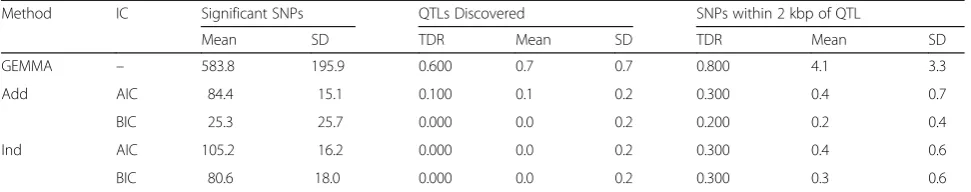
In an effort to increase the number of true QTLs iden-tified, we repeated the analyses, using the genome-wide efficient mixed-model analysis (GEMMA) software [3] in phase I to perform the GWAS. GEMMA performs single-marker analyses for multiple related individuals by modeling relatedness using a random polygenic effect whose covariance structure has the same form as the one we used in our LASSO method. Because the method can handle families of arbitrary size and
Table 2Results of the analyses usingpvalue threshold of 1E-04 for the PLINK analysesa
Method IC Significant SNPs QTLs Discovered SNPs within 2 kbp of QTL
Mean SD TDR Mean SD TDR Mean SD
PLINK – 695.8 287.7 0.135 0.13 0.36 0.735 1.89 1.87
Add AIC 37.4 17.1 0.005 0.01 0.07 0.120 0.12 0.33
BIC 14.1 5.8 0.000 0.00 0.00 0.015 0.02 0.13
Ind AIC 63.84 21.0 0.005 0.01 0.07 0.200 0.20 0.47
BIC 41.2 10.6 0.005 0.01 0.07 0.130 0.13 0.38
a
structure, we used all available data for both stages of the analyses (I and II). Table 3 summarizes the results for ap value threshold of 1E-04 for the GEMMA analyses.
Table 3 shows that use of all available data to identify potential QTLs in phase I of the analysis slightly in-creased the power of the method to identify at least 1 true simulated QTL to 80 % from 73.5 % when PLINK was used. Furthermore, GEMMA slightly increased the number of SNPs within 2 kbp of a true simulated gene from 1.89 using PLINK to approximately 4.1, on average, even though fewer SNPs advanced to phase II (583.8 vs. 695.8, on average). Similarly, the 2-step method using GEMMA resulted in a small increase in power to iden-tify at least 1 SNP within 2 kbp of a QTL to 20 % from 12 % when PLINK was used in phase I. However, the cost of the increase in the power was a significant in-crease in the number of SNPs with nonzero coefficients in the final model. The best model based on the BIC cri-terion on average resulted in 25.3“significant” SNPs, up from 14.1 when PLINK was used in phase I. This be-havior is not surprising. Our LASSO method and GEMMA model the quantitative phenotype in the same way; consequently, LASSO tends to overfit the data, resulting in a larger number of SNPs with nonzero co-efficients in the final model.
Discussion
We have presented a 2-stage approach that uses a LASSO method for analyzing quantitative phenotypes of (potentially) related individuals. We first perform a GWAS to uncover SNPs potentially associated with the regulation of the phenotype. Next, a multivariate LASSO approach that accounts for relevant covariates and relatedness among the study participants is used to further weed out additional SNPs. The method models relatedness of in-dividuals in the sample through inclusion of a random polygenic effect whose covariance structure reflects re-latedness of the individuals. We used the GAW19 sim-ulated family data to study the properties of the method and to compare its performance to the stand-ard LASSO for unrelated individuals.
In application to the GAW19 simulated data, our re-sults indicate that incorporating the relatedness of
individuals in the LASSO model can help significantly reduce the number of non–trait-regulating SNPs falsely inferred as associated with the trait relatively to the standard LASSO approach, which assumes unrelated in-dividuals. Furthermore, for these particular data, it ap-pears that including a dominance genetic effect in the model has no significant effect other than to increase the computational intensity of the method. This was ex-pected as the particular data were generated without dominance effects.
Conclusions
The power of the LASSO method appears to be small, mainly as a result of the inability of the initial GWAS scan to identify QTLs to take forward for further ana-lysis. In an attempt to increase the number of QTLs se-lected for the phase II analysis, we explored 2 methods for the GWAS: (a) using PLINK on only the founders of the pedigrees, and (b) using GEMMA to allow for re-lated individuals and use of all study participants. Unfor-tunately, even though the GEMMA analysis yielded a slightly larger number of true signals, neither of the 2 methods was able to advance to the next stage a signifi-cant number of true QTLs. This behavior could poten-tially be a result of the low contribution of the simulated QTLs to the phenotype. Perhaps using other methods in stage I, such as the transmission disequilibrium test or family-based association test, on an appropriate subset of the data, may increase the number of QTLs that are carried forward, thereby potentially increasing the TDR of the method.
Acknowledgements
This work was sponsored by grant R01HL085197 from NIH. Publication of this article was funded by the Department of Mathematics, Physics, and Statistics at the University of Sciences.
Declarations
This article has been published as part ofBMC ProceedingsVolume 10 Supplement 7, 2016: Genetic Analysis Workshop 19: Sequence, Blood Pressure and Expression Data. Summary articles. The full contents of the supplement are available online at http://bmcproc.biomedcentral.com/ articles/supplements/volume-10-supplement-7. Publication of the proceedings of Genetic Analysis Workshop 19 was supported by National Institutes of Health grant R01 GM031575.
Table 3Results of the analyses usingpvalue threshold of 1E-04 for the GEMMA analysesa
Method IC Significant SNPs QTLs Discovered SNPs within 2 kbp of QTL
Mean SD TDR Mean SD TDR Mean SD
GEMMA – 583.8 195.9 0.600 0.7 0.7 0.800 4.1 3.3
Authors’contributions
All authors contributed in the theoretical development of the method and the revision of the manuscript. CP performed the analyses and drafted the manuscript.
Competing interests
The authors declare that they have no competing interests.
Author details
1Department of Mathematics, Physics, and Statistics, University of the Sciences, 600 S. 43rd Street, Philadelphia, PA 19104, USA.2Department of Mathematics, Rowan University, 201 Mullica Hill Road, Glassboro, NJ 08028, USA.3Department of Human Genetics, University of Chicago, 920 E. 58th Street, CLSC 4th floor, Chicago, IL 60637, USA.
Published: 18 October 2016
References
1. Kang HM, Sul JH, Service SK, Zaitlen NA, Kong SY, Freimer NB, et al. Variance component model to account for sample structure in genome-wide association studies. Nat Genet. 2010;42(4):348–54.
2. Fusi N, Lippert C, Lawrence ND, Stegle O. Warped linear mixed models for the genetic analysis of transformed phenotypes. Nat Commun. 2014;5:4890. 3. Zhou X, Stephens M. Genome-wide efficient mixed-model analysis for
association studies. Nat Genet. 2012;44(7):821–4.
4. Papachristou C, Lin S. A confidence set inference method for identifying SNPs that regulate quantitative phenotypes. Hum Hered. 2012;73(3):174–83. 5. Waldmann P, Mészáros G, Gredler B, Fuerst C, Sölkner J. Evaluation of the
lasso and the elastic net in genome-wide association studies. Front Genet. 2013;4:270.
6. Tibshirani R. Regression shrinkage and selection via the lasso. J R Stat Soc Series B Stat Methodol. 1996;58(1):267–88.
7. Ding X, Su S, Nandakumar K, Wang X, Fardo DW. A 2-step penalized regression method for family-based next-generation sequencing association studies. BMC Proc. 2014;8 Suppl 1:S25.
8. Schelldorfer J, Bühlmann P, van de Geer S. Estimation for high-dimensional linear mixed-effects models using L1-penalization. Scand Stat Theory Appl. 2011;38(2):197–214.
9. Blangero J, Teslovich TM, Sim X, Almeida MA, Jun G, Dyer TD, Johnson M, Peralta JM, Manning AK, Wood AR, et al. Omics squared: human genomic, transcriptomic, and phenotypic data for Genetic Analysis Workshop 19. BMC Proc. 2015;9 Suppl 8:S2.
10. Abney M, McPeek MS, Ober C. Estimation of variance components of quantitative traits in inbred populations. Am J Hum Genet. 2000;66(2):629–50. 11. Purcell S, Neale B, Todd-Brown K, Thomas L, Ferreira MA, Bender D, et al.
PLINK: a toolset for whole-genome association and population-based linkage analysis. Am J Hum Genet. 2007;81(3):559–75.
• We accept pre-submission inquiries
• Our selector tool helps you to find the most relevant journal
• We provide round the clock customer support
• Convenient online submission
• Thorough peer review
• Inclusion in PubMed and all major indexing services
• Maximum visibility for your research
Submit your manuscript at www.biomedcentral.com/submit