LINKAGE DISEQUILIBRIUM, SELECTION AND
RECOMBINATION A T THREE LOCI
ALAN HASTINGS
Defartinent of Matheinntics, University of California, Davis, Calijornia 95616
Manuscript received May 20, 1983 Revised copy accepted September 26, 1983
ABSTRACT
Limits to the relationship among linkage disequilibrium, selection and re- combination at equilibrium in three-locus, two-allele, deterministic, discrete generation models are determined using linear programming techniques. These results show that the commonly used measures of linkage disequilibrium are not appropriate for a multilocus setting. Additionally, interactions among three loci are important in reducing the strength of selection necessary to maintain a given level of disequilibrium, relative to a two-locus model.
NE of the most important problems in theoretical population genetics
0
during the past decades has been determining the extent to which results for one or two loci carry over to larger numbers of loci (LEWONTIN 1974; EWENS 1979). A particular example of such a question is the extent to which the relationship between selection and disequilibrium in two-locus models de- scribes truly multilocus situations. Is the amount of selection necessary to main- tain disequilibrium at a large number of loci given (approximately) by the product of selection coefficients at pairs of loci, or is it determined additively in some sense or is some other process occurring? It is just this question that is the central one in this paper.In an earlier paper, I discussed the relationship among seiection, recombi- nation and linkage disequilibrium in the context of two-locus, two-allele models (HASTINGS 198 la). The goal of this paper is to consider similar questions within the context of three-locus models. Often, attempts are made to measure dise- quilibrium for pairs of loci. How do unseen loci affect inferences made from observations of linkage disequilibrium? The possibility that two-locus models do not necessarily give a good indication of the behavior of models with many more than two loci has been a theme of many papers in theoretical population genetics, notably FRANKLIN and LEWONTIN (1970). The questions I will ex- amine-are there new features found in three-locus models not found in two- locus models-are similar to those raised by FRANKLIN and LEWONTIN.
154 A. HASTINGS
recombination and D is the disequilibrium, I showed that at all equilibria of this model, rlDl
<
s/10. If, to maintain large amounts of disequilibrium at many loci, such strong selection would be required (in a multiplicative sense), then linkage disequilibrium (caused by selection) would likely be unimportant in the population genetics of natural populations.Before even considering the relationship between disequilibrium and selec- tion in a three-locus context, one must examine the measures of disequilibrium. These measures, which are unambiguous in a two-locus model, are not so in a three-locus context. Defining pairwise equilibria in a three-locus context is simply an application of the two-locus definitions. T h e three-locus disequilib- rium term also has a standard definition due to BENNETT (1954). What is unclear is whether an increase in (the absolute value of) one of these four numbers represents an increase in the total disequilibrium. In the two-locus case, the relationship between the disequilibrium D and deviations from linkage equilibrium is clear. That such a clear-cut relationship is not to be expected for three loci
i's
evident from the work of HILL (1974) on the expected value of the covariance among the linkage disequilibrium at three loci under a neu- tral model.METHODS AND MODEL
T h e model I will employ here is the standard three-locus, discrete generation deterministic population genetic model. I will employ the same mathematical techniques to analyze equilibria of this model as used in the paper by HASTINGS (198 la). I will first specify equilibria of the model. Such equilibria are specified either by eight chromosomal frequencies (constrained to add to one) or by three gene frequencies, three pairwise disequilibria and one three-way dise- quilibrium. For each such equilibrium I then determine the minimum strength of selection necessary to maintain such an equilibrium using linear program- ming techniques. T h e results reported are for this minimum strength of selec- tion which is defined as follows. All fitnesses (viabilities) are constrained to lie between 1
-
s and 1+
s. Then, the minimum value of s for which the specified equilibrium exists is found (for details see HASTINGS 1981a). Thus, the strengthof selection can be thought of as 2s.
T h e notation employed is the following. In all cases studied there are three loci, A, B, C, located in that order on the chromosome. T h e loci have alleles A , n , B,b, C,c respectively. Let
PA
be the frequency of the allele A at locus A;LAC
be the frequency of chromosomes with allele A at locus A and C at locusC. Other frequencies are defined similarly. T h e pairwise linkage disequilibrium between A and B is denoted DAB. It is defined as DAB = P A B p o b
-
P A b p n B . T h e two other pairwise disequilibria are denoted and defined similarly. T h e third order disequilibrium among A , B and C is denoted as D A B C and is defined as: DABC =PABC
-
PADBC-
PBDAC-
@(:DAB-
PAPBPc.
T h e recombination probability between loci A and B is denoted as ?-AB; that between B and C is denoted asre(;. I have assumed no interference, so TAC = TAB
+
rBC-
2 T A B T B C .the equilibria thus obtained. This was done by numerically calculating the modulus of the largest eigenvalue of the appropriate Jacobian matrix, evalu- ated at the equilibrium in question.
RESULTS
With the curse of dimensionality upon us, a fairly complete listing of equi- libria (disequilibrium values) with minimum strengths of selection is quite out of the question. Instead, I will report observations based on a fairly coarse survey of the equilibrium space, along with a more detailed analysis of some special cases. Most of the special cases reported have gene frequencies of 0.5
D
BETWEEN LOCI
A
RND C
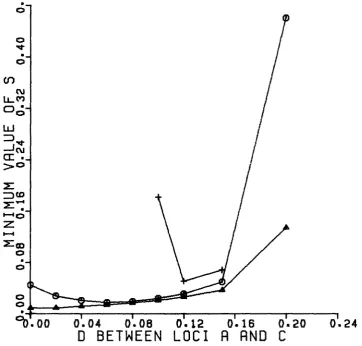
FIGURE l.-Minimum strength of selection required for an equilibrium as a function of DAC. Here, PA = PB =
PC
= 0.6, TAB = r K = 0.01. DAB = D E = 0.05; A. DAB = DBC = 0.10; 0. DAB =A. HASTINGS
0 0
d b i 0 0
0104
0108
01.12
01.16
01.20
01.24
D
BETWEEN
L O C I
A
AND
C
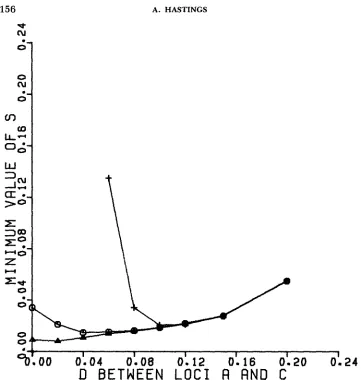
FIGURE 2.-Minimum strength of selection required for an equilibrium as a function of DAc.
Here, PA = PB = PC = 0.5, TAB = rBc = 0.01. DAB = Dm = 0.05; A. DAB = DBc = 0.10; 0. DAB = DBC = 0.15;
+.
The lines merely connect points at which the calculations were made.at all loci and TAB = rBC = 0.01. Unless specifically mentioned, similar results
are obtained for different gene frequencies and recombination rates.
Since I am particularly interested in two-locus marginal properties, the cases examined closely reflect this view. In most cases either one or two pairwise disequilibria are specified, and then either one or two disequilibria are varied and the minimum strength of selection is calculated.
A preliminary case has pairwise disequilibrium between only two of three loci and all three other disequilibria (pairwise and three-way) zero. Here, the minimum strength of selection required is the same as if only the two loci with disequilibria were present. Adding the third locus here has no effect.
%LOO
0’.04
0’.06
01.12
OLl6
01.20
01.24
D
BETWEEN
L O C I
R
AND
B
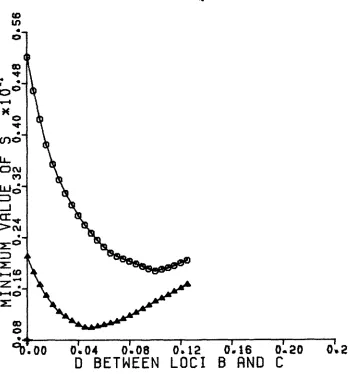
FIGURE 3.-Minimum strength of selection required for an equilibrium as a function of DAB. Here, p A = pB = pc = 0.5, TAB = rsc = 0.01. Dsc = DAc = 0.05; A. DK = DAc = 0.10; 0. The lines merely connect points at which the calculations were made.
disequilibrium is varied. The two pairwise disequilibria held fixed can either both be large or one can be large and the other small. The value DUC, likewise, can be small or large. The final variable is the position of the loci on the chromosome. The following observations include all of these possibilities.
Observation I: Let there be high pairwise linkage disequilibrium between ad- jacent loci, with D A B = DBC
>
0 . Then, the amount of selection required actually decreases when DAC increases away from zero. The minimum “mini- mum strength of selection” occurs for a value of D A G close to (but not equal to) DAB. See Figures 1 and2 .
Making D A C negative does require additional selection.158
r-
0
A. HASTINGS
\
""1
W\
$a00
01.01
0102
01.03
0104
0:05
0 ! 0 6
D
BETWEEN LOCI A AND
C
FIGURE 4.-Minimum strength of selection required for an equilibrium as a function of D A C .
= p B = p , = 0.5, DAB = LIB(: I= 0.10, TAB = TBC = 0.01. DMC = 0.0; A. DMc = 0.01 OR
Here,
-
0.01; 0. The lines merely connect points at which the calculations were made.Observation III: T h e minimum "minimum strength of selection" for the cases considered in I and I1 depends not only on the other pairwise disequilibria, but also on the three-way disequilibria (Figure
4)
and, more interestingly, on both the order of the loci and the recombination rates between them. See Figure 5 and compare it with Figure2.
Observation
N:
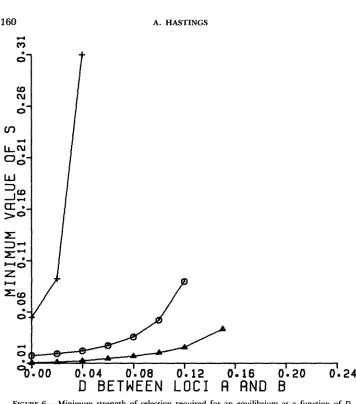
Let D A C be fixed, and let D A B C = 0. Add a third locus inbe- tween, but keep DBC = 0. Then, the minimum strength of selection required increases as D A B increases (Figure 6 ) . Also, a similar result obtains if D A C is decreased from zero. If, however, D A B C<
0, a different result obtains. LetPA
0.01. Then, with D A C = 0, the minimum value of s is close to 1, whereas with D A C = 0.03, the minimum value of s is 0.25.
(D
m
24
D
BETWEEN
L O C I
B
AND
C
FIGURE 5.-Minimum strength of selection required for an equilibrium as a function of DE.
Here, PA = f a = Pc = 0.5, D A B = DAc = 0.10, rM = 0.01. rsc; = 0.001; A. r x = 0.01; 0. The lines merely connect points at which the calculations were made.
Obseruation
V:
By combining the information available in the previous obser- vations, one can examine the case in which D A B is positive and a third locus is added outside these two. Then, varying DBC or DAC away from zero while holding the other fixed at zero increases the minimum strength of selection required.Next I will consider the effect of varying D A B C with all other values held constant.
Observation V I There are cases in which varying D A B c away from zero may decrease the minimum strength of selection required, as the following example
A. HASTINGS
24
D
BETWEEN
L O C I
A
AND B
FIGURE 6.-Minimum strength of selection required for an equilibrium as a function of DAB. Here, PA = PB =
PC
= 0.5, DBC = 0, rM = rK = 0.01. DAC = 0.05; A, DAC = 0.10; 0. D A C = 0.2;+.
The lines merely connect points at which the calculations were made.example is even more surprising. Let
PA
=p~
= pc = 0.5, DAB = 0.15, DBC =DAC = 0.0, TAB = rBc = 0.01. Then, with DABC = 0 , the minimum value of s is
0.01357, whereas with DMc = -0.01, the minimum value of s is 0.01240.
Here, the marginal observation of the quantity rD/s at loci A and B is increased from 0.1105 to 0.1209, by the interactions with the third locus. Note that the
0.1 105 value is the same as the one in the true two-locus model. Compare
these situations to Figure 4, in which increasing DABC does increase the mini- mum value of s.
Finally, I will consider the effect of adding a third locus and varying two pairwise disequilibria simultaneously.
P
24
D BETWEEN
LOCI
A
AND
C,
B AND
C
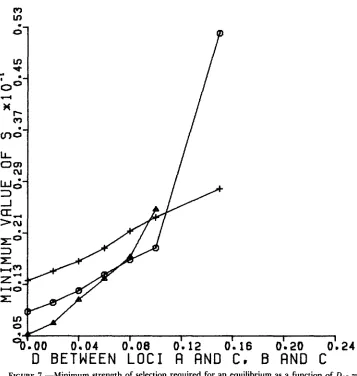
FIGURE 7.-Minimum strength of selection required for an equilibrium as a function of DAc =
Dw;. Here, p A = p~ = pc = 0.5, r A B = r x = 0.01. DM = 0.05; A. D M = 0.10; 0. D,Q = 0.15;
+.
The lines merely connect points at which the calculations were made.
of selection (Figure
7).
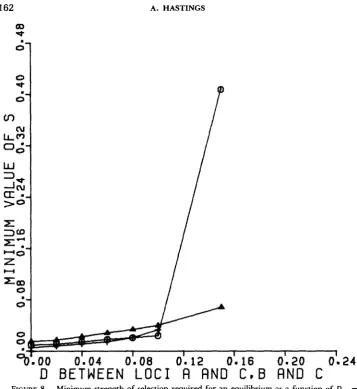
However, ifp
= 0.6, there is a range of values over which little additional selection is required (Figure 8).Observation VIII Let there be two loci with significant disequilibrium between them. Then, maintaining a third locus between these two with large pairwise disequilibria between the interior locus and the outer two requires essentially no additional selection (Figure 9).
A. HASTINGS
-
"b:OO 0:04 OL08 0:12
0 : l S
0:20
0
'
.
24
B
E T
W
E
E N
L O C I
-FIGURE 8.-Minimum strength o f selection required for an equilibrium as a function of DAC =
DEC. Here, PA = PB =
PC
= 0.6, TAB = rBC = 0.01. DAB = 0.05; A. DAB = 0.10; 0. DAB = 0.15;+.
The lines merely connect points at which the calculations were made.
reported here, although not exact limits for stable equilibria, likely provide a good guide to the limitations on stable equilibria.
DISCUSSION
There are two classes of conclusions possible from the conclusions presented. One deals with the measurement of linkage disequilibrium in a multilocus context. T h e second concerns the interaction among three loci, selection and recombination in the maintenance of linkage disequilibrium and evolutionary consequences.
* O
I
4
2
% a 0 0
0 - 0 4
0.08
0 . 1 2
0.16
0 . 2 0
0.24
D
BETWEEN LOCI
A
AND
B e
B
AND C
FIGURE 9.-Minimum strength of selection required for an equilibrium as a function of DAB =
= re(: = 0.01. DAC = 0.05; A. DAC = 0.10; 0. D A C = 0.20;
+.
DEC. Here, PA =
The lines merely connect points at which the calculations were made.
= PC = 0.5,
misleading. It is not the case that more disequilibrium between a pair of loci necessarily implies more selection (observations I, 11, IV and VI). Also, any attempt to modify the measure of linkage disequilibrium must include the recombination rates between the loci in question to be valid, as the minimum “minimum strength of selection” can depend on recombination, as in obser- vation 111. Thus, attempts to use log-linear-type models to study the interac- tions among loci, as in SMOUSE (1 974), have only suggestive value when selec- tion is operating.
164 A. HASTINGS
linkage disequilibrium may be an important feature of the population genetics of natural populations. This is a major difference between the results reported here and those for two loci reported by HASTINGS (1 98 la), which appeared to place strong limits on disequilibrium. It is tempting to say that the three-locus results reported here d o provide a good guide to situations with more loci. However, two-locus systems can exhibit surprising behavior not found in one- locus systems (HASTINGS 1981b,c, 1982), and the results here on three-locus systems differ from those on two-locus systems.
Even marginal two-locus observations of the quantity rD/s are affected by a third locus, as in observation VI. Here, this figure is increased beyond that possible in a truly two-locus model. Thus, the limits to the relationship among r ,
D
and s presented for two loci by HASTINGS (1981a) may not carry over simply to more loci. If, in fact, linkage disequilibrium may be important as suggested here, why have attempts to measure it been so unsuccessful? Perhaps the reason lies only with the statistical problems pointed out by BROWN (1975). Additionally, the results here are in qualitative agreement with the observation that linkage disequilibrium between an inversion and an allozyme locus is more common than between two allozyme loci (LANGLEY, TOBARI and KOJIMA 1974). Many questions concerning the role of linkage disequilibrium remain unanswered.I thank JOHN GILLFSPIE and JIM QUINN for helpful discussions. Supported by Public Health Service grant 1 R 0 1 GM32 130-01.
LITERATURE CITED
BENNETT, J. H., 1954 On the theory of random mating. Ann. Eugen. 184: 311-317. BROWN, A. H. D., 1975
EWENS, W. J., 1979 Mntheinnticnl Populntio11 Genetics. Springer-Verlag, Berlin. FRANKLIN, I. and R. LEWONTIN, 1970
HASTINGS, A., 1981a Disequilibrium, selection, and recombination: limits in two-locus, two allele
HASTINGS, A., 1981b Marginal underdominance at a stable equilibrium. Proc. Natl. Acad. Sci.
HASTINGS, A., 1981c Stable cycling in discrete-time genetic models. Proc. Natl. Acad. Sci. USA
HASTINGS, A., 1982 Unexpected behavior in two locus genetic systems: an analysis of marginal
Disequilibrium among several linked neutral genes in finite population. 11.
Linkage disequilibrium in natural p o p
The Geiietir Bnsis of Evolutioitary Change. Columbia University Press, New
Likelihood analysis of recombinational disequilibrium in Inultiple-locus gametic
Corresponding editor: W. J. EWENS Sample sizes required to detect linkage disequilibrium between two or three loci. Theor. Pop. Biol. 8 184-201.
Is the gene the unit of selection. Genetics 65: 707-734.
models. Genetics 98: 659-668.
USA 78: 6558-6559.
7 8 7224-7225.
underdominance at a stable equilibrium. Genetics 102: 129-1 38.
Variances and covariances of disequilibria. Theor. Pop. Biol. 6 184-198.
ulations of Drosophila ?nelanognsler. Genetics 78: 92 1-936.
York.
HILL, W. G., 1974
LANGLEY, C. H., Y. N. TOBARI and K. I. KOJIMA, 1974
LEWONTIN, R., 1974
SMOUSE, P., 1974