HIGHLIGHTED ARTICLE
| MULTIPARENTAL POPULATIONS
R/qtl2: Software for Mapping Quantitative Trait Loci
with High-Dimensional Data and
Multiparent Populations
Karl W. Broman,*,1Daniel M. Gatti,†Petr Simecek,†Nicholas A. Furlotte,‡Pjotr Prins,§,** ´Saunak Sen,†† Brian S. Yandell,‡‡,§§and Gary A. Churchill† *Departments of Biostatistics and Medical Informatics,‡‡Horticulture, and§§Statistics, University of Wisconsin–Madison, Wisconsin 53706,†The Jackson Laboratory, Bar Harbor, Maine 04609,‡23andMe, Mountain View, California 94043,§Departments of Genetics, Genomics, and Informatics and††Preventive Medicine, University of Tennessee Health Sciences Center, Memphis, Tennessee 38163, and **Center for Molecular Medicine, University Medical Center Utrecht, 3584CT, The Netherlands ORCID IDs: 0000-0002-4914-6671 (K.W.B.); 0000-0003-0667-9926 (D.M.G.); 0000-0002-2922-7183 (P.S.); 0000-0002-9096-6276 (N.A.F.); 0000-0002-8021-9162 (P.P.); 0000-0003-4519-6361 ( ´S.S.); 0000-0002-8774-9377 (B.S.Y.); 0000-0001-9190-9284 (G.A.C.)
ABSTRACTR/qtl2 is an interactive software environment for mapping quantitative trait loci (QTL) in experimental populations. The R/qtl2 software expands the scope of the widely used R/qtl software package to include multiparent populations derived from more than two founder strains, such as the Collaborative Cross and Diversity Outbred mice, heterogeneous stocks, and MAGIC plant populations. R/qtl2 is designed to handle modern high-density genotyping data and high-dimensional molecular phenotypes, including gene expression and proteomics. R/qtl2 includes the ability to perform genome scans using a linear mixed model to account for population structure, and also includes features to impute SNPs based on founder strain genomes and to carry out association mapping. The R/qtl2 software provides all of the basic features needed for QTL mapping, including graphical displays and summary reports, and it can be extended through the creation of add-on packages. R/qtl2, which is free and open source software written in the R and C++ programming languages, comes with a test framework.
KEYWORDS software; QTL; multiparent populations; MAGIC; Diversity Outbred mice; heterogeneous stock; Collaborative Cross; Multiparent Advanced Generation Inter-Cross (MAGIC); MPP
T
HERE has been a resurgence of interest in the mapping of quantitative trait loci (QTL) in experimental organisms, spurred in part by the use of gene expression phenotypes [eQTL mapping; see Albert and Kruglyak (2015)] to more rap-idly identify the underlying genes, and by the development of multiparent populations (de Koning and McIntyre 2017), in-cluding heterogeneous stocks (Mottet al.2000; Mott and Flint 2002), MAGIC lines (Cavanaghet al.2008; Koveret al.2009),the Collaborative Cross (Churchillet al.2004), and Diversity Outbred mice (Churchillet al.2012; Svensonet al.2012).
Multiparent populations (MPPs) are genetically mixed populations derived from a small set of known founders that are typically, but not necessarily, inbred strains. The presence of multiple founder alleles imparts unique features to MPPs
with significant advantages over traditional two-parent
crosses. Allelic series of linked functional variants produce information-rich patterns of effects that can help identify causal variants and distinguish pleiotropy from chance coloc-alization of multiple QTL (Kinget al.2012). MPPs provide high-resolution mapping, which results in fewer candidate genes and minimizes the confounding effects of linked loci. MPPs create new multi-locus allelic combinations by mixing founder genomes. The founder strain genomes of many MPPs have been, or will be, sequenced, and, using high-density genotyping, we can then accurately impute whole genomes of individuals (Oreperet al.2017).
Copyright © 2019 Bromanet al.
doi:https://doi.org/10.1534/genetics.118.301595
Manuscript received September 11, 2018; accepted for publication December 21, 2018.
Available freely online through the author-supported open access option.
This is an open-access article distributed under the terms of the Creative Commons Attribution 4.0 International License (http://creativecommons.org/licenses/by/ 4.0/), which permits unrestricted use, distribution, and reproduction in any medium, provided the original work is properly cited.
MPPs can be generated by many different breeding de-signs and have been developed in different model organisms including rats (Woods and Mott 2017), Drosophila (King et al.2012),Caenorhabditis elegans(Nobleet al.2017), as well as a variety of plant species (Koveret al.2009; Huang et al.2012a; Bandilloet al.2013; Dell’Acquaet al.2015). Different breeding designs of MPPs give rise to different population structures and thus will require a flexible and general framework for analysis. The key challenges that arise in the analysis of MPP data include the reconstruction of the founder haplotype mosaic, imputation of whole-genome genetic variants, and analysis methods that can handle the multiple founder alleles and account for population structure.
There are numerous software packages for QTL mapping in classical two-parent experimental populations, including Mapmaker/QTL (Lincoln and Lander 1990), QTL Cartographer
(Basten et al. 2002), R/qtl (Broman et al. 2003; Broman
and Sen 2009), and MapQTL (Van Ooijen 2009). There are a smaller number of packages for QTL analysis in multiparent
populations, including DOQTL (Gatti et al. 2014), HAPPY
(Mott et al. 2000), and mpMap (Huang and George 2011).
Our aim in developing R/qtl2 is to provide an open-source, extensible software environment for QTL mapping and asso-ciated data analysis tasks that applies to the full range of classical and MPP cross designs.
The original R/qtl (hereafter, R/qtl1) is widely used, and has a number of advantages compared to proprietary alter-natives. R/qtl1 includes a quite comprehensive set of QTL mapping methods, including multiple-QTL exploration and model selection (Broman and Speed 2002; Manichaikul et al.2009; Arendset al.2010), as well as extensive visu-alization and data diagnostics tools (Broman and Sen 2009). Further, users and developers both benefit by it be-ing an add-on package for the general statistical software, R (R Core Team 2018). A number of other R packages have been written to work in concert with R/qtl1, including ASMap (Taylor and Butler 2017), ctl (Arends et al.2016),
dlmap (Huang et al. 2012b), qtlcharts (Broman 2015),
vqtl (Corty and Valdar 2018), and wgaim (Taylor and Verbyla 2011).
R/qtl1 has a number of limitations (see Broman 2014), the most critical of which is that the central data structure gen-erally limits its use to biparental crosses. Also, R/qtl1 was designed at a time when a dataset with.100 genetic markers was considered large.
Rather than extend R/qtl1 for multiparent populations, we decided to start fresh. R/qtl2 is a completely rede-signed R package for QTL analysis that can handle a variety of multiparent populations and is suited for high-dimensional genotype and phenotype data. To handle population structure, QTL analysis may be performed with a linear mixed model that includes a residual poly-genic effect. The R/qtl2 software is available from its web site (https://kbroman.org/qtl2) as well as GitHub (https://github.com/rqtl/qtl2).
Features
QTL analysis in multiparent populations can be split into two parts: calculation of genotype probabilities using multipoint single nucleotide polymorphism (SNP) genotypes, and the genome scan to evaluate the association between genotype and phenotype, using those probabilities. We use a hidden Markov model [HMM; see Broman and Sen (2009), App. D] for the calculation of genotype probabilities. The HMM implemented in R/qtl2 is generalized from the implementa-tion in R/qtl1 to accommodate the MPP founder haplotype structure. As the source of genotype information, R/qtl2 con-siders array-based SNP genotypes. At present, we focus solely on marker genotypes rather than array intensities, as in DOQTL, or allele counts/dosages from genotyping-by-sequencing (GBS) assays.
R/qtl2 includes implementations of many classical way crosses (backcross, intercross, doubled haploids, two-way recombinant inbred lines by selfing or sibling mating, and two-way advanced intercross populations), and many differ-ent types of multipardiffer-ent populations [4- and 8-way recombi-nant inbred lines by sibling mating; 4-, 8-, and 16-way recombinant inbred lines by selfing; 3-way advanced inter-cross populations, Diversity Outbred mice, heterogeneous
stocks, 19-way MAGIC lines like the Kover et al. (2009)
Arabidopsis lines, and 6-way doubled haploids following a design of maize MAGIC lines being developed at the University of Wisconsin–Madison].
A key component of the HMM is the transition matrix (or “step”probabilities), which are specific to the cross design. Transitions represent locations where the ancestry of chro-mosomal segments change from one founder strain haplo-type to another. The transition probabilities for multi-way recombinant inbred lines are taken from Broman (2005). The transition probabilities for heterogeneous stocks and Di-versity Outbred mice are taken from Broman (2012b), which uses the results of Broman (2012a).
The output of the HMM is a list of three-dimensional arrays, one per chromosome, with dimensions corresponding to individuals3genotypes3marker loci. Array elements rep-resent genotype probabilities that can reflect both the uncer-tainty of haplotype inference and the heterozygosity. The size and structure of the genotype dimension determine the form of the regression model that will be used in the genome scanning step. Thus, once the genotype probabilities are
de-fined, there is no need to reference the breeding scheme that gave rise to the cross population. For breeding schemes that are not currently implemented in the R/qtl2 HMM, the user can precompute and import a custom genotype probability data structure.
model (Yuet al.2006; Kanget al.2008; Lippertet al.2011) that includes a residual polygenic effect to account for pop-ulation structure. The latter may also be performed using kinship matrices derived using the“ leave-one-chromosome-out”(LOCO) method (see Yanget al.2014).
To establish statistical significance of evidence for QTL, accounting for a genome scan, R/qtl2 facilitates the use of permutation tests (Churchill and Doerge 1994). For multi-parent populations with analysis via a linear mixed model, we permute the rows of the haplotype reconstructions as considered in Cheng and Palmer (2013). R packages such
as qvalue (Storey et al. 2018) can be used to implement
multiple-test corrections for high-dimensional data analysis (Storey 2002, 2003) such as gene expression QTL (eQTL) mapping.
R/qtl2 includes a variety of data diagnostic tools, which can be particularly helpful for data on multiparent populations where the SNP genotypes are incompletely informative (i.e., SNP genotypes do not fully define the corresponding founder haplotype). These include SNP genotyping error LOD scores (Lincoln and Lander 1992) and estimated crossover counts.
Examples
R/qtl2 reproduces the functionality of DOQTL (Gatti et al. 2014) but targets a broader set of multiparent populations, in addition to Diversity Outbred (DO) mice. (DOQTL will ultimately be deprecated and replaced with R/qtl2.) Figure 1 contains a reproduction, using R/qtl2, of Figure 5 from Gattiet al.(2014). This is a QTL analysis of constitutive neu-trophil counts in 742 Diversity Outbred mice (from
genera-tions three to five) that were genotyped with the first
generation Mouse Universal Genotyping Array (MUGA)
(Morgan et al. 2016), which contained 7851 markers, of
which we are using 6413.
The regression model that R/qtl2 applies in a genome scan is determined by the HMM output in the genotype probabil-ities data structure. For an eight-parent MPP such as the DO mice, there are 36 possible diplotypes (44 on the X chromo-some) and the genome scan will be based on a regression model with 35 degrees of freedom. With so many degrees of freedom, the model typically lacks power to detect QTL. An alternative representation collapses the 36 states to eight founder “dosages”and uses a regression model with seven degrees of freedom, assuming that the founder effects are additive at any given locus. R/qtl2 has the ability to incorpo-rate SNP (and other variant) data from founder strains and to impute biallelic genotypes for every SNP. The genome scan on imputed SNPs is equivalent to an association mapping scan, and can employ an additive (one degree of freedom) or general (two degrees of freedom) regression model.
Figure 1A contains the LOD curves from a genome scan using a full model comparing all 36 possible genotypes with log neutrophil count as the phenotype, and with sex and log white blood cell count as covariates. The horizontal dashed line indicates the 5% genome-wide significance level, derived
from a permutation test, with separate thresholds for the autosomes and the X chromosome, using the technique of
Broman et al.(2006). Figure 1B contains the LOD curves
from a genome scan using an additive allele model (corre-sponding to a test with seven degrees of freedom), and Figure 1C contains a SNP association scan, using a test with two degrees of freedom. All of these analyses use a linear mixed model with kinship matrices derived using the LOCO method.
Figure 1D shows the estimated QTL effects, assuming a single QTL with additive allele effects on chromosome (chr) 1, and sliding the position of the QTL across the chro-mosome. This is analogous to the estimated effects in Figure 5D of Gatti et al.(2014), but here we present Best Linear Unbiased Predictors (BLUPs), taking the QTL effects to be random effects. This results in estimated effects that have
been shrunk toward 0, which helps to clean up the figure
and focus attention on the region of interest.
Figure 1E shows individual SNP association results, for the 6 Mbp region on chr 1 that contains the QTL. As with the DOQTL software, we use all available SNPs for which geno-type data are available in the eight founder lines, and impute the SNP genotypes in the DO mice, using the individuals’ genotype probabilities along with the founder strains’SNP genotypes.
Figure 1 shows a number of differences from the results reported in Gattiet al.(2014), including that we see nearly significant loci on chr 5 and 17 in the full model (Figure 1A), and we see a second significant QTL on chr 7 with the additive allele model (Figure 1B). Also, in Figure 1E, we see associated SNPs not just at128.6 Mbp near theCxcr4 gene (as in Gattiet al.2014), but also a group of associated
SNPs at132.4 Mbp, nearTmcc2. The differences between
these results and those of Gatti et al. (2014) are due to differences in genotype probability calculations; R/qtl2 appears to be more tolerant of SNP genotyping errors (data not shown).
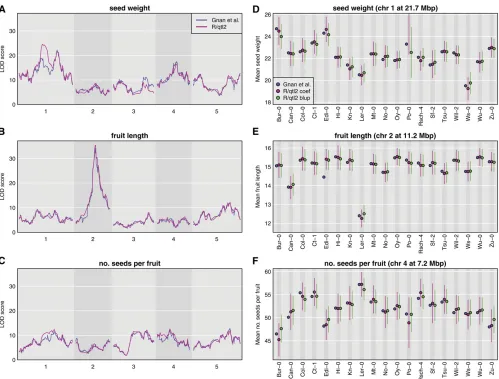
To further illustrate the broad applicability of R/qtl2, we reanalyzed the data of Gnan et al.(2014) on seed weight, seed number, and fruit length in 677 19-way Arabidopsis MAGIC lines from Koveret al.(2009). In Figure 2, we show LOD scores for three traits and effect estimates for a selected QTL for each trait, as derived from the logP-values provided by Gnanet al.(2014) and as calculated with R/qtl2.
The genome scan results are largely concordant except for an important difference in the LOD curve on chr 1 for seed weight (Figure 2A). There are also smaller differences on chr 3 for seed weight (Figure 2A) and chr 1 for number of seeds per fruit (Figure 2C). These differences are likely due to differences in the calculated genotype probabilities, and de-serve further study.
677 MAGIC lines all have small probabilities for carrying the Po-0 allele. The only other large difference is in Figure 1E for fruit length, where the value reported in Gnanet al. (2014) for the Edi-0 allele is much smaller than that obtained with R/qtl2. Finally, note that, throughout, the BLUPs are all shifted toward the mean, and that this shift is
much larger for seed number (Figure 1F) vs.fruit length
(Figure 1E).
Data and software availability
The data for Figure 1 are available at the Mouse Phenotype Database (https://phenome.jax.org/projects/Gatti2). The data for Figure 2 are available as supplementalfiles for Gnanet al. (2014) (https://doi.org/10.1534/genetics.114.170746). R/qtl2 inputfiles for both datasets are available at GitHub (https:// github.com/rqtl/qtl2data).
The R/qtl2 software is available from its web site (https:// kbroman.org/qtl2) as well as GitHub (https://github.com/ rqtl/qtl2). The software is licensed under the GNU General Public License version 3.0.
The code to create Figure 1 and Figure 2 is available at
GitHub athttps://github.com/kbroman/Paper_Rqtl2.
Implementation
data in memory. We use roxygen2 (Wickhamet al.2017) to develop the R package documentation.
Linear algebra calculations, such as matrix decomposition and linear regression, are a central part of QTL analysis. We use RcppEigen (Bates and Eddelbuettel 2013) and the Eigen C++ library (Guennebaudet al.2010) for these calculations. For thefit of linear mixed models, to account for population structure with a residual polygenic effect, we closely followed code from PyLMM (Furlotte 2015). In particular, we use the basic technique described in Kanget al.(2008), of taking the eigen decomposition of the kinship matrix.
In contrast to R/qtl1, which includes almost no formal software tests, R/qtl2 includes extensive unit tests to ensure correctness. We use the R package“testthat”(Wickham 2011) for this purpose. The use of unit tests helps us to catch bugs earlier, and revealed several bugs in R/qtl1.
Discussion
We have completed the core of the R/qtl2 software package, which is a reimplementation of the widely used software
R/qtl, to better handle high-dimensional genotypes and phenotypes, and modern cross designs including MPPs. This software forms a key computational platform for QTL anal-ysis in MPPs, and includes genotype reconstruction for a variety of MPP designs (including MAGIC lines, the Collab-orative Cross, Diversity Outbreds, and heterogeneous stock), numerous facilities for quality-control assessments, QTL genome scans by Haley-Knott regression (Haley and Knott 1992) and linear mixed models to account for population structure, and BLUP-based estimates of QTL effects. Most procedures in R/qtl2 can make use of the multiple CPU cores on a given machine, to speed computations by parallel processing.
involved can be tedious. We would like to have a more general approach for genotype reconstruction in multiparent
popula-tions, along the lines of RABBIT (Zheng et al. 2015) or
STITCH (Davies et al. 2016). Plant researchers have been
particularly creative in developing unusual sets of MAGIC populations, and, by our current approach, each design re-quires the development of design-specific code, which is
dif-ficult to sustain. In addition, we will provide facilities for importing data in more general formats, including genotype probabilities/reconstructions and kinship matrices that were derived from other software packages. This will further ex-pand the scope for R/qtl2 by making its QTL analysis facilities usable beyond the set of MPP designs that can be handled by our genotype reconstruction code.
Another important area of development is the handling of GBS data. We are currently focusing solely on called geno-types. With low-coverage GBS data, it is difficult to get quality genotype calls at individual SNPs, and there will be consider-able advantage to using the pairs of allele counts and com-bining information across SNPs. Extending the current HMM implementation in R/qtl2 to handle pairs of allele counts for GBS data appears straightforward.
At present, QTL analysis in R/qtl2 is solely by genome scans with single-QTL models. Consideration of multiple-QTL mod-els will be particularly important for exploring the possibility of multiple causal SNPs in a QTL region, along the lines of the CAVIAR software (Hormozdiariet al.2014).
We have currently focused solely on Haley-Knott regres-sion (Haley and Knott 1992) for QTL analysis. This has a big advantage in terms of computational speed, but it does not fully account for the uncertainty in genotype reconstructions. But the QTL analysis literature has a long history of methods for dealing with this genotype uncertainty, including interval mapping (Lander and Botstein 1989) and multiple imputa-tion (Sen and Churchill 2001). While this has not been a high priority in the development of R/qtl2, ultimately we will in-clude implementations of these sorts of approaches, to better handle regions with reduced genotype information.
We will continue to focus on lean implementations offitting algorithms, such as simple linear mixed models with a single random effect for kinship, that will be widely used for genome-wide scans. But we will also seek to simplify the use of external packages, for genome scans with more complex models.
R/qtl2 is an important update to the popular R/qtl soft-ware, expanding the scope to include multiparent popula-tions, providing improved handling of high-dimensional data, and enabling genome scans with a linear mixed model to account for population structure. R/qtl1 served as an impor-tant hub upon which other developers could build; we hope that R/qtl2 can serve a similar role for the genetic analysis of multiparent populations.
Acknowledgments
This work was supported in part by National Institutes of Health grants R01GM074244 (to K.W.B.), R01GM070683
(to K.W.B. and G.A.C.), and R01GM123489 (to ´S.S.). The
authors thank Paula Kover for assistance with the data from Gnanet al.(2014).
Literature Cited
Albert, F. W., and L. Kruglyak, 2015 The role of regulatory vari-ation in complex traits and disease. Nat. Rev. Genet. 16: 197– 212.https://doi.org/10.1038/nrg3891
Arends, D., P. Prins, R. C. Jansen, and K. W. Broman, 2010 R/qtl: high-throughput multiple QTL mapping. Bioinformatics 26: 2990–2992.https://doi.org/10.1093/bioinformatics/btq565
Arends, D., Y. Li, G. A. Brockmann, R. C. Jansen, R. W. Williams
et al., 2016 Correlation trait loci (CTL) mapping: phenotype network inference subject to genotype. J. Open Source Softw. 1: 87.https://doi.org/10.21105/joss.00087
Bandillo, N., C. Raghavan, P. A. Muyco, M. A. Sevilla, I. T. Lobina
et al., 2013 Multi-parent advanced generation inter-cross (MAGIC) populations in rice: progress and potential for genetics research and breeding. Rice (N. Y.) 6: 11. https://doi.org/ 10.1186/1939-8433-6-11
Basten, C. J., B. S. Weir, and Z.-B. Zeng, 2002 QTL Cartographer,
Version 1.16. Department of Statistics, North Carolina State Uni-versity, Raleigh, NC.
Bates, D., and D. Eddelbuettel, 2013 Fast and elegant numerical linear algebra using the RcppEigen package. J. Stat. Softw. 52: 1–24.https://doi.org/10.18637/jss.v052.i05
Broman, K. W., 2005 The genomes of recombinant inbred lines. Genetics 169: 1133–1146. https://doi.org/10.1534/genetics. 104.035212
Broman, K. W., 2012a Genotype probabilities at intermediate generations in the construction of recombinant inbred lines. Genetics 190: 403–412. https://doi.org/10.1534/genetics. 111.132647
Broman, K. W., 2012b Haplotype probabilities in advanced inter-cross populations. G3 (Bethesda) 2: 199–202.https://doi.org/ 10.1534/g3.111.001818
Broman, K. W., 2014 Fourteen years of R/qtl: just barely sus-tainable. J. Open Res. Softw. 2: e11.https://doi.org/10.5334/ jors.at
Broman, K. W., 2015 R/qtlcharts: interactive graphics for quanti-tative trait locus mapping. Genetics 199: 359–361.https://doi. org/10.1534/genetics.114.172742
Broman, K. W., and S. Sen, 2009 A Guide to QTL Mapping with R/ qtl. Springer, New York. https://doi.org/10.1007/978-0-387-92125-9
Broman, K. W., and T. P. Speed, 2002 A model selection approach for the identification of quantitative trait loci in experimental crosses. J. R. Stat. Soc. B 64: 641–656. https://doi.org/ 10.1111/1467-9868.00354
Broman, K. W., H. Wu, S. Sen, and G. A. Churchill, 2003 R/qtl: QTL mapping in experimental crosses. Bioinformatics 19: 889– 890.https://doi.org/10.1093/bioinformatics/btg112
Broman, K. W., S. Sen, S. E. Owens, A. Manichaikul, E. Southard-Smith et al., 2006 The X chromosome in quantitative trait locus mapping. Genetics 174: 2151–2158. https://doi.org/ 10.1534/genetics.106.061176
Cavanagh, C., M. Morell, I. Mackay, and W. Powell, 2008 From mutations to MAGIC: resources for gene discovery, validation and delivery in crop plants. Curr. Opin. Plant Biol. 11: 215– 221.https://doi.org/10.1016/j.pbi.2008.01.002
Churchill, G. A., and R. W. Doerge, 1994 Empirical threshold values for quantitative trait mapping. Genetics 138: 963–971. Churchill, G. A., D. C. Airey, H. Allayee, J. M. Angel, A. D. Attie
et al., 2004 The Collaborative Cross, a community resource for the genetic analysis of complex traits. Nat. Genet. 36: 1133– 1137.https://doi.org/10.1038/ng1104-1133
Churchill, G. A., D. M. Gatti, S. C. Munger, and K. L. Svenson, 2012 The diversity outbred mouse population. Mamm. Ge-nome 23: 713–718.https://doi.org/10.1007/s00335-012-9414-2
Corty, R. W., and W. Valdar, 2018 vqtl: an R package for mean-variance QTL mapping. G3 (Bethesda) 8: 3757–3766.https:// doi.org/10.1534/g3.118.200642
Davies, R. W., J. Flint, S. Myers, and R. Mott, 2016 Rapid geno-type imputation from sequence without reference panels. Nat. Genet. 48: 965–969.https://doi.org/10.1038/ng.3594
de Koning, D. J., and L. M. McIntyre, 2017 Back to the future: multiparent populations provide the key to unlocking the genetic basis of complex traits. G3 (Bethesda) 7: 1617–1618.https://doi. org/10.1534/g3.117.042846
Dell’Acqua, M., D. M. Gatti, G. Pea, F. Cattonaro, F. Coppenset al., 2015 Genetic properties of the MAGIC maize population: a new platform for high definition qtl mapping in Zea mays. Ge-nome Biol. 16: 167.https://doi.org/10.1186/s13059-015-0716-z
Eddelbuettel, D., 2013 Seamless R and C++ Integration with Rcpp. Springer, New York.https://doi.org/10.1007/978-1-4614-6868-4
Eddelbuettel, D., and R. François, 2011 Rcpp: seamless R and C++ integration. J. Stat. Softw. 40: 1–18.https://doi.org/10.18637/ jss.v040.i08
Furlotte, N., 2015 Pylmm, a lightweight linear mixed-model solver.https://github.com/nickFurlotte/pylmm.
Gatti, D., K. Svenson, A. Shabalin, L.-Y. Wu, W. Valdar et al., 2014 Quantitative trait locus mapping methods for Diversity Outbred mice. G3 (Bethesda) 4: 1623–1633. https://doi.org/ 10.1534/g3.114.013748
Gnan, S., A. Priest, and P. X. Kover, 2014 The genetic basis of natural variation in seed size and seed number and their trade-off using Arabidopsis thaliana MAGIC lines. Genetics 198: 1751– 1758.https://doi.org/10.1534/genetics.114.170746
Guennebaud, G., B. Jacobet al., 2010 Eigen, version 3.http:// eigen.tuxfamily.org.
Haley, C. S., and S. A. Knott, 1992 A simple regression method for mapping quantitative trait loci in line crosses using flanking markers. Heredity 69: 315–324. https://doi.org/10.1038/ hdy.1992.131
Hormozdiari, F., E. Kostem, E. Y. Kang, B. Pasaniuc, and E. Eskin, 2014 Identifying causal variants at loci with multiple signals of association. Genetics 198: 497–508. https://doi.org/10.1534/ genetics.114.167908
Huang, B. E., and A. W. George, 2011 R/mpMap: a computational platform for the genetic analysis of multiparent recombinant inbred lines. Bioinformatics 27: 727–729. https://doi.org/10. 1093/bioinformatics/btq719
Huang, B. E., A. W. George, K. L. Forrest, A. Kilian, M. J. Hayden
et al., 2012a A multiparent advanced generation inter-cross population for genetic analysis in wheat. Plant Biotechnol. J. 10: 826–839.https://doi.org/10.1111/j.1467-7652.2012.00702.x
Huang, B. E., R. Shah, and A. W. George, 2012b dlmap: an R package for mixed model QTL and association analysis. J. Stat. Softw. 50: 1–22.https://doi.org/10.18637/jss.v050.i06
Kang, H. M., C. Ye, and E. Eskin, 2008 Accurate discovery of expression quantitative trait loci under confounding from spu-rious and genuine regulatory hotspots. Genetics 180: 1909– 1925.https://doi.org/10.1534/genetics.108.094201
King, E. G., C. M. Merkes, C. L. McNeil, S. R. Hoofer, S. Senet al., 2012 Genetic dissection of a model complex trait using the Drosophila synthetic population resource. Genome Res. 22: 1558–1566.https://doi.org/10.1101/gr.134031.111
Kover, P. X., W. V. Valdar, J. Trakalo, N. Scarcelli, I. M. Ehrenreich
et al., 2009 A multiparent advanced generation inter-cross to fine-map quantitative traits inArabidopsis thaliana. PLoS Genet. 5: e1000551.https://doi.org/10.1371/journal.pgen.1000551
Lander, E. S., and D. Botstein, 1989 Mapping Mendelian factors underlying quantitative traits using RFLP linkage maps. Genet-ics 121: 185–199.
Lincoln, S. E., and E. S. Lander, 1990 Mapping genes for quanti-tative traits using MAPMAKER/QTL. A Whitehead Institute for Biomedical Research Technical Report. Whitehead Institute, Cambridge, MA.
Lincoln, S. E., and E. S. Lander, 1992 Systematic detection of errors in genetic linkage data. Genomics 14: 604–610.
https://doi.org/10.1016/S0888-7543(05)80158-2
Lippert, C., J. Listgarten, Y. Liu, C. M. Kadie, R. I. Davidsonet al., 2011 FaST linear mixed models for genome-wide association studies. Nat. Methods 8: 833–835. https://doi.org/10.1038/ nmeth.1681
Manichaikul, A., J. Y. Moon, S. Sen, B. S. Yandell, and K. W. Broman, 2009 A model selection approach for the identification of quantitative trait loci in experimental crosses, allowing epistasis. Genetics 181: 1077–1086.https://doi.org/10.1534/genetics.108. 094565
Morgan, A. P., C. P. Fu, C. Y. Kao, C. E. Welsh, J. P. Didionet al., 2016 The mouse universal genotyping array: from substrains to subspecies. G3 (Bethesda) 6: 263–279. https://doi.org/ 10.1534/g3.115.022087
Mott, R., and J. Flint, 2002 Simultaneous detection andfine map-ping of quantitative trait loci in mice using heterogeneous stocks. Genetics 160: 1609–1618.
Mott, R., C. J. Talbot, M. G. Turri, A. C. Collins, and J. Flint, 2000 A method forfine mapping quantitative trait loci in out-bred animal stocks. Proc. Natl. Acad. Sci. USA 97: 12649– 12654.https://doi.org/10.1073/pnas.230304397
Noble, L. M., I. Chelo, T. Guzella, B. Afonso, D. D. Riccardiet al., 2017 Polygenicity and epistasis underliefitness-proximal traits in the Caenorhabditis elegans multiparental experimental evo-lution (CeMEE) panel. Genetics 207: 1663–1685. https://doi. org/10.1534/genetics.117.300406
Oreper, D., Y. Cai, L. M. Tarantino, F. P.-M. de Villena, and W. Valdar, 2017 Inbred strain variant database (ISVdb): a repos-itory for probabilistically informed sequence differences among the Collaborative Cross strains and their founders. G3 (Bethesda) 7: 1623–1630.https://doi.org/10.1534/g3.117. 041491
R Core Team, 2018 R: A Language and Environment for Statistical Computing. R Foundation for Statistical Computing, Vienna. Sen, ´S., and G. A. Churchill, 2001 A statistical framework for
quantitative trait mapping. Genetics 159: 371–387.
Storey, J. D., 2002 A direct approach to false discovery rates. J. R. Stat. Soc. B 64: 479–498.https://doi.org/10.1111/1467-9868.00346
Storey, J. D., 2003 The positive false discovery rate: a Bayesian interpretation and the q-value. Ann. Stat. 31: 2013–2035.
https://doi.org/10.1214/aos/1074290335
Storey, J. D., A. J. Bass, A. Dabney, and D. Robinson, 2018 qvalue: Q-value estimation for false discovery rate control. R package version 2.14.0.https://github.com/jdstorey/qvalue.
Svenson, K. L., D. M. Gatti, W. Valdar, C. E. Welsh, R. Chenget al., 2012 High-resolution genetic mapping using the mouse diver-sity outbred population. Genetics 190: 437–447. https://doi. org/10.1534/genetics.111.132597
Taylor, J., and D. Butler, 2017 R package ASMap: efficient genetic linkage map construction and diagnosis. J. Stat. Softw. 79: 1–29.
https://doi.org/10.18637/jss.v079.i06
Van Ooijen, J. W., 2009 MapQTL 6: Software for the Mapping of Quantitative Trait Loci in Experimental Populations of Diploid Species. Kyazma BV, Wageningen, The Netherlands.
Wickham, H., 2011 testthat: get started with testing. R J. 3: 5–10. Wickham, H., P. Danenberg, and M. Eugster, 2017 roxygen2: in-line documentation for R. R package version 6.0.1.https:// CRAN.R-Project.org/package=roxygen2
Woods, L. C., and R. Mott, 2017 Heterogeneous stock populations for analysis of complex traits.Methods Mol. Biol.1488: 31–44.
https://doi.org/10.1007/978-1-4939-6427-7_2
Yang, J., N. A. Zaitlen, M. E. Goddard, P. M. Visscher, and A. L. Price, 2014 Advantages and pitfalls in the application of
mixed-model association methods. Nat. Genet. 46: 100–106.
https://doi.org/10.1038/ng.2876
Yu, J., G. Pressoir, W. H. Briggs, I. V. Bi, M. Yamasaki et al., 2006 A unified mixed-model method for association mapping that accounts for multiple levels of relatedness. Nat. Genet. 38: 203–208.https://doi.org/10.1038/ng1702
Zheng, C., M. P. Boer, and F. A. van Eeuwijk, 2015 Reconstruction of genome ancestry blocks in multiparental populations. Genet-ics 200: 1073–1087. https://doi.org/10.1534/genetics.115. 177873