University of Kentucky
UKnowledge
Computer Science Faculty Publications
Computer Science
9-10-2014
Piecing the Puzzle Together: A Revisit to Transcript
Reconstruction Problem in RNA-Seq
Yan Huang
University of Kentucky, [email protected]
Yin Hu
University of Kentucky, [email protected]
Jinze Liu
University of Kentucky, [email protected]
Right click to open a feedback form in a new tab to let us know how this document benefits you.
Follow this and additional works at:
https://uknowledge.uky.edu/cs_facpub
Part of the
Computer Sciences Commons
This Conference Proceeding is brought to you for free and open access by the Computer Science at UKnowledge. It has been accepted for inclusion in Computer Science Faculty Publications by an authorized administrator of UKnowledge. For more information, please contact
Repository Citation
Huang, Yan; Hu, Yin; and Liu, Jinze, "Piecing the Puzzle Together: A Revisit to Transcript Reconstruction Problem in RNA-Seq" (2014).Computer Science Faculty Publications. 6.
© 2014 Huang and Hu; licensee BioMed Central Ltd.
This is an Open Access article distributed under the terms of the Creative Commons Attribution License
(
http://creativecommons.org/licenses/by/4.0
), which permits unrestricted use, distribution, and
reproduction in any medium, provided the original work is properly cited. The Creative Commons Public
Domain Dedication waiver (
http://creativecommons.org/publicdomain/zero/1.0/
) applies to the data made
available in this article, unless otherwise stated.
Digital Object Identifier (DOI)
http://dx.doi.org/10.1186/1471-2105-15-S9-S3
P R O C E E D I N G S
Open Access
Piecing the puzzle together: a revisit to transcript
reconstruction problem in RNA-seq
Yan Huang, Yin Hu, Jinze Liu
*From
RECOMB-Seq: Fourth Annual RECOMB Satellite Workshop on Massively Parallel Sequencing
Pittsburgh, PA, USA. 31 March - 05 April 2014
Abstract
The advancement of RNA sequencing (RNA-seq) has provided an unprecedented opportunity to assess both the diversity and quantity of transcript isoforms in an mRNA transcriptome. In this paper, we revisit the computational problem of transcript reconstruction and quantification. Unlike existing methods which focus on how to explain the exons and splice variants detected by the reads with a set of isoforms, we aim at reconstructing transcripts by piecing the reads into individualeffectivetranscript copies. Simultaneously, the quantity of each isoform is explicitly measured by the number of assembled effective copies, instead of estimated solely based on the collective read count. We have developed a novel method namedAstroidthat solves the problem of effective copy reconstruction on the basis of a flow network. The RNA-seq reads are represented as vertices in the flow network and are connected by weighted edges that evaluate the likelihood of two reads originating from the same effective copy. A maximum likelihood set of transcript copies is then reconstructed by solving a minimum-cost flow problem on the flow network. Simulation studies on the human transcriptome have demonstrated the superior sensitivity and specificity of Astroid in transcript reconstruction as well as improved accuracy in transcript quantification over several existing approaches. The application of Astroid on two real RNA-seq datasets has further demonstrated its accuracy through high correlation between the estimated isoform abundance and the qRT-PCR validations.
Transcript reconstruction Transcript quantification, Transcriptome, RNA-seq
Background
The advent of RNA-seq technologies has made it possible to characterize the mRNA transcriptome of a cell through massively parallel sequencing. A typical RNA-seq protocol works by randomly fragmenting the mRNA transcripts followed by sequencing a sample of the total fragments. The central problem of RNA-seq analysis is to recapitulate the variety and the abundance of the transcript isoforms from the sequenced short reads.
Many methods have been developed for transcript reconstruction and/or quantification recently. These methods include but are not limited to Cufflinks [1], Scripture [2], IsoLasso [3], RSEM [4], SLIDE [5], iReckon [6], MITIE [7], MultiSplice [8],etc. As pointed out by
Behr et al. [7], it is important to perform isoform
reconstruction and quantification simultaneously in order to maximize the performance of both steps. Although some of the existing methods claimed to con-duct transcript reconstruction and quantification simul-taneously [6-8], they still follow a two-step approach: 1) construct a set of candidate isoforms; 2) estimate the abundance of these isoforms by assigning reads probabil-istically to each isoform through an optimization process. The relative abundance is calculated as FPKM, i.e., Fragments Per Kilobase of transcript per Million mapped reads, where the total number of fragments aligned to a transcript is averaged by the length of the transcript, regardless whether the reads are distributed evenly along the transcript.
In this paper, we revisit the problem of transcript reconstruction. Instead of assigning reads probabilistically
* Correspondence: [email protected]
Department of Computer Science, University of Kentucky, Lexington, KY, USA
Huanget al.BMC Bioinformatics2014,15(Suppl 9):S3 http://www.biomedcentral.com/1471-2105/15/S9/S3
© 2014 Huang and Hu; licensee BioMed Central Ltd. This is an Open Access article distributed under the terms of the Creative Commons Attribution License (http://creativecommons.org/licenses/by/4.0), which permits unrestricted use, distribution, and reproduction in any medium, provided the original work is properly cited. The Creative Commons Public Domain Dedication waiver (http://creativecommons.org/publicdomain/zero/1.0/) applies to the data made available in this article, unless otherwise stated.
to a set of isoforms, we go one step further by answering how well individual reads may be pieced together to build copies of individual transcripts. We directly reconstruct
effectivetranscript copies, each of which corresponds to a
chain of non-overlapping transcript fragments (Figure 1). The contribution of each effective copy to the abundance of the corresponding isoform does not solely depend on the number of reads observed, but also on how consistent the distribution of the observed fragments is as compared to the expected process of mRNA fragmentation and sam-pling. This procedure allows us to explicitly take into account of the positional relationships among reads, which were generally ignored by existing methods. In the mean-time, the total number of transcript copies constructed can be used to assess the transcript abundance. Therefore, we introduce a new measure for transcript quantification,
namelyeTPM, effective Transcripts Per Million. The eTPM of an isoformiis calculated as:
eTPMi=
eTi×106
jeTj
(1) where eTiis the number of effective copies of isoformi andΣjeTjaccounts for the total number of transcripts in the transcriptome. With our approach, not only do the constructed effective copies convey the information of the exon composition of the transcript, but the number of copies also delivers an estimation of the relative abun-dance of each isoform. It is therefore trulysimultaneous
in terms of transcript identification and quantification. To this end, we have developed a novel computational algorithmAstroid (Transcript reconstruction through
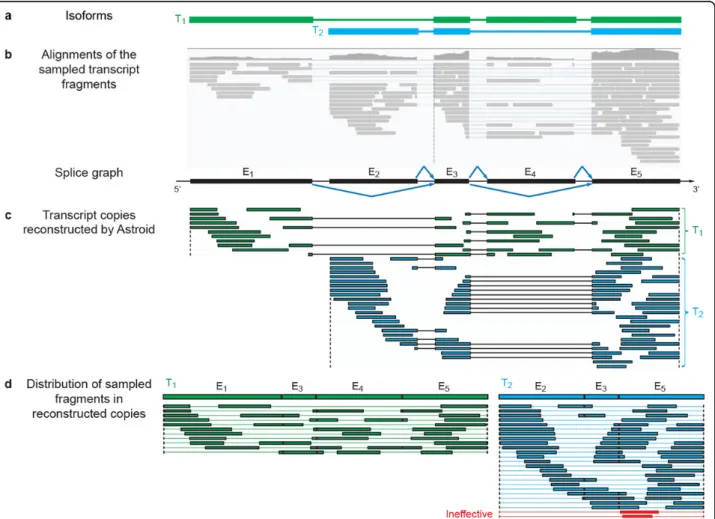
Figure 1Reconstruction of effective transcript copies by Astroid.(a)The two isoforms from which transcript fragments are randomly sampled.(b)The alignments of the sampled fragments, plotted with IGV [36]. A splice graph can be built based upon the exons and splice junctions identified from the fragment alignments.(c)Effective transcript copies assembled by Astroid. Astroid successfully reconstructs the two expressed isoforms with no false positive.(d)The distribution of fragments in the effective copies. The likelihood of each copy is assessed according to the sizes of the fragments in the copy together with the between-fragment distances. Effective transcript copies will be identified and used to measure the abundance of each isoform. Note that this example shows only transcript fragments rather than the RNA-seq reads for simplified illustration. However, our method does take paired-end reads as input.
assembly of effective transcript copies guided by the fragment distance.). We model the relation of all observed reads using a directed flow network, with reads connected by edges whose weight represents the likelihood that two reads may coexist in a transcript. The most likely set of transcript copies is reached by solving a min-cost flow problem given the flow network. A compression scheme is developed to speed up the performance for genes with high read coverage. The model is further consolidated by adding Multi-Splice features [8], reads that span multiple alternative splicing events, to avoid the identification of spurious transcripts. We have compared the performance of our method with a number of state-of-the-art methods including Cufflinks [1], Scripture [2], IsoLasso [3] and Trinity [9]. Simulation studies on the human transcriptome datasets have demonstrated Astroid’s superior sensitivity and precision on transcript discovery. The eTPM estimate calculated from the number of effective transcript copies assembled by Astroid has exhibited an improved corre-lation with true transcript abundance than FPKM esti-mates. The evaluations on the MAQC human brain dataset and the Alexa-seq dataset further demonstrated the effectiveness of our method in real applications, in which Astroid provided slightly more consistent esti-mates for transcript abundance with qRT-PCR valida-tions than other methods.
Effective transcripts
We propose to construct a set of effective transcript
copieswhich simultaneously explain the observed reads
and estimate the transcript abundance.
The sampled fragments typically do not immediately follow each other and fragments may not be sampled immediately at the start/end of a transcript. We model the positional relationship among the fragments by con-sidering thesize distributionof 1) the fragments, 2) the gap between two adjacent fragments, and 3) the gap from the transcription start site to the first fragment and from the last fragment to the transcription termina-tion site. We use Rfr
t to denote the set of transcript
frag-ments in a copyt. Each fragment can be identified by a mate pair of reads. The set of betweenfragment gaps in
tis denoted asRgapt .
The likelihood of the transcripttis then interpreted as the joint likelihood of all its fragments together with the gaps according to their sizes. To simplify the model, we assume that the sizes of the fragments and the gaps fol-low the same distribution, whose density function is denoted asd(·).
Let isoform i be the isoform that t is copied from, denoted ast∈i. Because different copies may have dif-ferent number of component fragments, we use the
geometric mean of the probabilities of all fragments and gaps intto evaluate the likelihood oft,
L(t) = ⎛ ⎜ ⎝ r∈Rgapt d(len(r)) r∈Rfrt d(len(r)) ⎞ ⎟ ⎠ 1 |Rgapt |+|R fr t |(2)
Generally, L(t) represents a central tendency of the probability of the fragments and gaps contained in t. It is possible to model the size distribution of the gaps dif-ferently, with more complex distributions. However, as the experimental results have suggested, the approxima-tion in our simplified model is sufficient. The distribu-tion ofd(·) will be discussed later in this section.
We further determine the effectiveness of a copy tby assessing the probability of observing a copy with likeli-hood no greater than L(t).
DefinitionFor a transcriptt, let I(t) denote the sub-domain of the size density d(·) such that ∀x ∈ I(t),
d(x) ≤ L(t). Thentiseffectiveif the cumulative den-sity integrated over all x ∈ I(t) is no greater than a significance levelτ, i.e.,
It
d(x)dx ≤ τ, whereτ con-trols the probability of falsely consideringtas ineffective.
As a convention in hypothesis testing, τ is often set as 0.05. For a given τ, the set of all effective transcript copies of isoform i is denoted as:
Si={t:
It
d(x)dx ≤ τ}. Then the abundance of iso-formiis measured by the number of its effective copies, calledeffective transcripts(eT), eTi=|Si|.
Under the assumption of a uniformly random frag-mentation process, the size distribution of the fragments generated from isoform i can be approximated as a characterized Weibull distribution [10,11] with two parameters δi and h. The isoform-specific shape para-meter δi depends on the logarithm of the molecule length ofi, and the scale parameter hreflects the frag-mentation intensity which is constant across all tran-scripts in one experiment [10]. In this paper, the distribution of d(·) is approximated using the Weibull distribution,d(·) =PW(·|δi,h).
Effective transcripts per million (eTPM)
We define the relative expression estimateeffective
tran-scripts per million of isoform i by normalizing eTi by
the total effective transcript copies in the transcriptome (Equation 1).
There exist two other measurements focusing on quantifying the relative isoform expression levels. They are both based on the number of reads on the isoform. One is FPKM [1]. For an isoformi, it approximates the
Huanget al.BMC Bioinformatics2014,15(Suppl 9):S3 http://www.biomedcentral.com/1471-2105/15/S9/S3
transcript abundance by normalizing the number of fragments on the isoform Niby the isoform length len (i), and uses the total number of fragments per million as a measure of total transcripts in the transcriptome (Equation 3). However, when comparing the isoform abundance among samples, the latter approximation is not accurate due to the variant size distribution of the transcripts among different samples [12].
FPKMi= Ni len(i) 103 · N 106 = Ni·10 9 len(i) (3)
Another measure TPM [4,12],i.e., Transcripts Per Mil-lion, resolves the inconsistency problem. It approximates the transcript number by normalizing the cumulative per base read coverage by the isoform length. TPM of an iso-formiis then calculated as in Equation 4 with summing up the estimated abundance of all isoforms accounting for the total number of transcripts in the transcriptome.
TPMi= Nilen(r) len(i) ·10 6 j Njlen(r) len(j) = Nilen(r)·10 6 len(i)·jNjlen(r) len(j) (4)
Herelen(r) refers to the expected fragment length. However, it is unclear how well Ni × 103/len(i) in FPKM andNilen(r)/len(i) in TPM can approximate the true abundance of one isoform because it is impossible that all observed fragments can be tightly arranged one after the other (Figure 1b) making every single base of the isoform covered by the read.
Unlike FPKM or TPM, eTPM explicitly considers the possible gaps between two adjacent fragments on the same transcript copy. Since eTPM is normalized by the total number of transcripts in a sample, it can be invariant across samples [12]. While both FPKM and TPM treat each read independently and consider them as the same, the effective transcripts used in eTPM is assessed according to the distribution of their fragments. In real experiments, the position distribution of sampled fragments may not be uniform due to PCR amplification error [13] or sampling biases [14-16]. The affected reads will form ill transcripts copies with only small fractions sampled. These ill transcripts will be recognized during the eTPM calculation, which allows for a more robust abundance measure (Figure 1d).
Although this measurement relies on the quantity of assembled effective copies rather than the number of reads, it is derived based on the same assumption as the other measurements regarding the abundance. Longer transcripts require more reads to construct an effective copy. Hence eTPM of different transcripts can be
compared directly without the normalization by transcript length.
Method
The assembly of effective transcript copies with RNA-seq reads is achieved by solving a minimum-cost flow blem. In this section, we detail the modeling of the pro-blem, its solution and various improvements over the basic approach. The input to our method is the genomic alignments of the paired-end reads to the reference gen-ome [17,18]. Another important data structure we used is the splice graph [19-22] (Figure 1b). The splice graph is constructed directly from the read alignments using the method described by Huet al. [20], and will be used to infer potential transcripts where a pair of reads come from. In general, the exons are identified as the genomic regions covered by abundant reads. These exons consti-tute the vertices of the splice graph. The spliced read alignments contain splice junctions, each of which spans a pair of exons. The splice junctions make the edges in the splice graph, whose directions can be defined by the direction of the transcription. In addition, the donor and acceptor sites of a splice junction also determine the boundaries of an exon. A path in the splice graph corre-sponds to (part of) a possible isoform.
Read flow network
We model the relationships among reads using a flow network, namely the Read Flow NetworkRF N=〈V, E,
W, source, sink〉. The vertex set V corresponds to the
union of the set of reads and the set of transcription start/termination sites (The transcription start sites and termination sites can be either inferred as the genomic positions that exhibit certain characteristic signatures [23,24] or provided from existing transcript annotation). There are two types of edges between two read vertices,
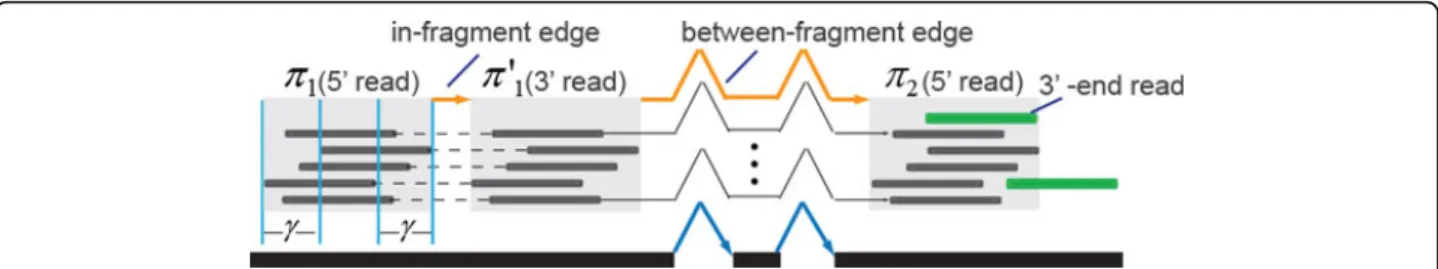
thein-fragment edges and thebetween fragmentedges.
The in-fragment edges (denoted as Ein) refer to edges between reads generated from the same fragment. In the case of paired-end reads, the edge is between the two mates of a paired read. The between-fragment edges (denoted asEbtwn) refer to the edges that connect one fragment with its downstream fragment. In this case, an edge usually connects the 3’end read of a frag-ment (or a transcription start site) to the 5’ end of a downstream fragment (or a transcription termination site). Let j(v) be the exon in the splice graph where a read vis aligned to. For two vertices v1, v2 ∈V, There
exists an edge between v1 and v2 for each unique path
ri(j(v1), j(v2)) between exon j(v1) and exon j(v2) in
the splice graph. In presence of alternative splicing, there may exist more than one paths in the splice graph fromj(v1) to j(v2). In this case, multiple edges may be
The weight of an edge e, e ∈ E corresponding to a path ri(j(v1), j(v2)) between two reads v1 and v2,
reflects the likelihood of the two reads coming consecu-tively from the same transcript copy. It is evaluated by the probability of observing a portion betweenv1andv2
on pathri(j(v1),j(v2)). Fore∈Einand e∈Ebtwn, len(e)
denotes the size of the observed fragment and size of the between-fragment gap, respectively. Assuming both sizes follow a Weibull distribution, then the probability ofeis calculated asP (e) = PW(len(e)). The weight ofe
inRF Nis defined as the negative logarithm of its likeli-hood,w(e) =−log P(e).
Lastly, the networkRF N is augmented by adding a virtualsourceand a virtualsink to initiate and terminate all transcript copies. Directed edges will be built from
source to all vertices that correspond to transcription
start sites and from all vertices that correspond to tran-scription termination sites to sink. Moreover, one edge is added to connectsourcetosink. The weights on these edges are always set as 0. Because every read may only originate from one transcript copy, the capacity con-straint on every vertex that represents a read is set as 1. The capacities onsource, sinkand vertices that represent transcription start/termination sites all equal to the number of vertices that represent the reads.
In this way, each transcript copy can be represented as
asource to sinkpath (flow) (Figure 2b). Let T denote
one set of transcript copies inRF N. For every copyt∈
T, the likelihood oftcan be evaluated as the product of the probabilities of its reads (vertices included int), the probabilities of its distances connecting paired-end reads
(in-fragmentedges int) and the probabilities of its
dis-tances connecting transcript fragments (
between-fragment edges in t). The transcript copies in T are
considered mutually independent because the vertices and edges included in one copy are exclusive. Hence, the likelihood of T can be written as the joint probabil-ity of all the transcript copies in T,
P(T) = t∈T P(t) = t∈T v∈t∩V P(v) e∈t∩Ein P(e) e∈t∩Ebtwn P(e) (5)
The probability of a read P(v) can be calculated by considering the quality of its alignment quality [4]. The probability of an edgeP(e) has been defined as PW (len (e) =l|e). Then the maximum likelihood set of transcript copies can be written as,
T= arg max
T logP(T) = arg maxT t∈T ⎛ ⎝ v∈t∩V logP(v) + e∈t∩Ein logP(e) + e∈t∩Ebtwn logP(e) ⎞ ⎠ = arg min T t∈T ⎛ ⎝ v∈t∩V −logP(v) + e∈t∩Ein −logP(e) + e∈t∩Ebtwn −logP(e) ⎞ ⎠. (6)
Therefore, the problem of solving the maximum likelihood set of transcript copies is equivalent to a
minimum-cost flowproblem [25,26] on the flow network
RF N, T = arg min f(·) e∈E w(e)·f(e), (7)
wheref(e) is the amount of flow on every edgee. Generally, solving a minimum-cost flow problem requires the pre-knowledge of the amount of flow send-ing from source to sink, denoted ask. Herekis set as a comparably large value (e.g. the total number of reads), the edge connecting source to sinkwill consume the extra amount of flow beyond the number of transcript copies which flow through the read vertices.
Acceleration with compressed flow network
The time complexity of the algorithms solving the minimum-cost flow problem isO(|V |3) [27,27,28],|V |is the number of vertices. Given the size of reads, which could be in the order of millions, the problem can be intractable. Here we introduce a heuristic to compress the read flow network into a much smaller network with minimal loss of accuracy. The idea is to remove highly repetitive reads in high coverage region by clustering these reads into groups while still retaining the relation-ships among them. Given a compression parameterg, the vertex setVof the flow network can be partitioned into a set of clustersΠ= {π1,π2, · · ·,πc} of V, such that the reads within each cluster contain consistent splice junc-tions; have homogenous outgoing edges and differ at mostgbases at both boundaries (Figure 3).
1 Vertex homogeneity.∀v1, v2 ∈πi, πi ∈Π, v1 and v2
are either both the 5’end reads of one fragment or both the 3’ end, and v1 and v2 either have the same set of
splice junctions in their alignments or have no splice junctions;
2 Edge homogeneity.∀v1, v1∈πi ∀v2, v2∈πj,πi,πj∈
Π, there exists no edge between v1 and v1 or between v2 and v2, and the edges between v1 and v2 represent
the same set of paths in the splice graph as the edges between v1and v2;
3 Alignment adjacency. ∀v1, v2 ∈ πi, πi ∈ Π, the 5’
-most base of v1 is at most gbases away from that of v2
on the genome, and the same for their 3’-most bases. In this way, the vertex setVcan be reduced to the set of vertex clustersΠ, and the duplicated edges between vertices of two clusters can be removed if they represent the same path in the splice graph. The distances of duplicated edges may differ by at most 2gbases, but the minimum weight of all the duplicated edges will be assigned to the only edge kept in the compressed flow network. The capacity of each vertex changes to the size
Huanget al.BMC Bioinformatics2014,15(Suppl 9):S3 http://www.biomedcentral.com/1471-2105/15/S9/S3
of the cluster, and the capacity of an edge is the number of duplicated edges in the original flow network. There-fore, gadjusts the degree of heterogeneity of reads in each clusters. Whenggoes larger, generally more reads
on the same exon can be grouped into one cluster and more reads containing the same splice junctions can also be clustered together. As a result, the compressed flow network has less vertices and edges and its size will
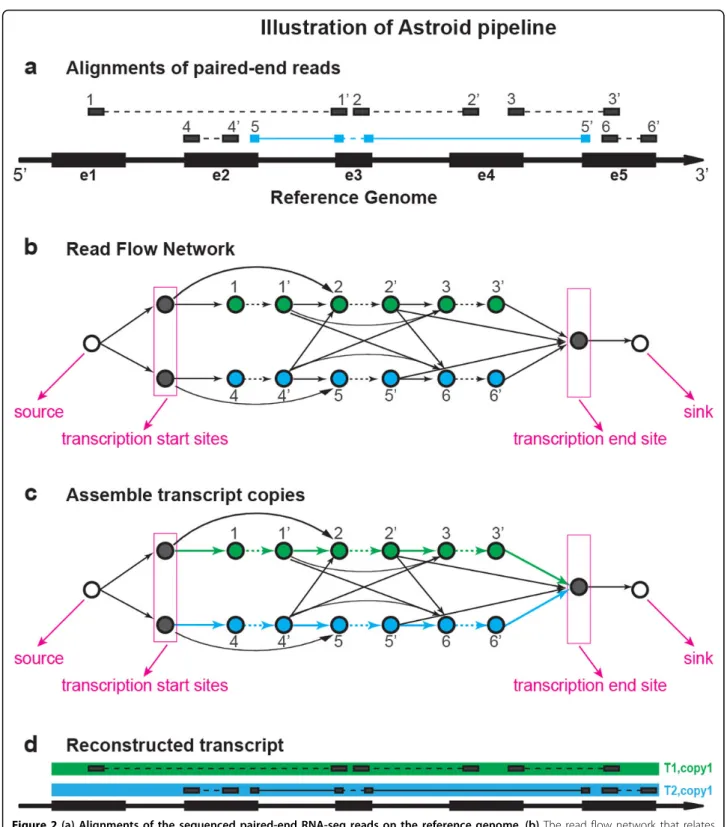
Figure 2(a) Alignments of the sequenced paired-end RNA-seq reads on the reference genome.(b)The read flow network that relates reads with in-fragment edges (dashed arrows) and between-fragment edges (solid arrows).(c)Solve a minimum flow (colored) on the read flow network.(d)The assembled effective transcript copies with maximized likelihood.
become closer to that of the splice graph. In practice,g is set to half the expected fragment length,g=len(r)/2, which improves speed by significantly reducing the size of the flow graph while retaining high accuracy by allowing sufficient overlaps among reads in a cluster.
The calculation of partition can finish inO(|V |) time. Our simulation studies have demonstrated that the com-pression may greatly reduce the time cost while main-taining a satisfactory accuracy of the assembled transcript copies.
Consolidating transcript reconstruction across alternative splicing events
The alternative splicing events (ASEs) happening between two cluster vertices will lead to more than one ways to connect them. In presence of multiple ASEs, it is important to avoid a simple enumeration of all possi-ble isoforms from the combinations of variants in the ASEs. Therefore, we leverage the reads that span multi-ple ASEs to help evaluate the likelihood of existence of a possible isoform, using the MultiSplice features devel-oped in our previous work [8]. Formally, a MultiSplice is a sequence of adjacent exons on a path of the splice graph, such that reads longer than a particular length may span all these exons. These features are calculated and incorporated here to reduce the possibility of link-ing the vertices into false transcripts.
Letedenote an edge in the compressed flow network. Letbdenote the MultiSplice feature that consists of the same set of exons as the path indicated by e. Letψ(b) denote the size of the sampling window ofb[8], which is the number of positions that a read could fall on in order to cover all exons ofb(Figure 4). If no read is observed spanningb, the existence of edgeecannot be confirmed. In this case we assign a penalty to the weight ofeby cal-culating the probability of observing no spanning read,
P(enot confirmed) =
1− ψ(b) len(e)
|ce|
whereceis the capacity one. If ψ(b) = 0, no read may spanbat the given read length,P(enot confirmed) =
1. Thereafter, we adjust the weight of e by adding– logP (enot confirmed) tow(e).
Experimental results
We compared the performance of our methodAstroid
with four other state-of-the-art approaches for transcript reconstruction, including two“genome-guided”methods [29] with different heuristics, Cufflinks [1] and Scripture [2] (Cufflinks 2.0.2 and Scripture beta version 2 were downloaded, Cufflinks was run in the mode that carries out both reconstruction and quantification and without -g/-G option), one representative method for Lasso-based
Figure 3An example of the compressed flow network. Reads colored black are grouped into 3 clusters (light gray). Edges connecting the reads in the original RFN are collapsed into two edges (colored orange) in the compressed network. The two reads colored green cannot be clustered intoπ2because they violate the vertex homogeneity and alignment adjacency, respectively.
Figure 4An example of a MultiSplice feature. Two ASEs (both are exon-skipping) reside between the clustersπ1 andπ2. The feature b consists of 5 exons on the path indicated by edge e. Two possible alignments of read r are shown in order for r to span b and confirm the existence of edge e. The possible positions of such alignments then give a sampling window of b (the window bounded by the two light blue lines).
Huanget al.BMC Bioinformatics2014,15(Suppl 9):S3 http://www.biomedcentral.com/1471-2105/15/S9/S3
“genome-guided” assembly IsoLasso [3] (IsoLasso version 2.6.0) and one“genomeindependent”approach Trinity [9] (Trinity version 2012-10-05). The assembled transcripts from Trinity were generated in fasta format and were mapped to the reference genome using BLAT [30] with default parameters. Only hits with complete match were considered in the comparisons. To understand the sensitivity and specificity of the transcript reconstruc-tion as well as the accuracy of transcript quantificareconstruc-tion, we first did comparison on all five approaches using simulated datasets of varying sampling depths. We then compared the genome-guided assembly methods (Trinity excluded) on two real RNA-seq datasets, MAQC data[31] and Alexa-seq data[32], where qPCR of a subset of transcripts are available to assess the accuracy of quantification using RNA-seq.
Simulation study
Data simulation. We developed a simulator that mimics a real RNA-seq experiment and generates frag-ments from provided transcript copies. The simulation process consists of three steps: (1) Build a synthetic transcriptome by randomly assign copy numbers to all the genes and isoforms in the annotation database and set this as the true profiles. (2) Randomly cut the tran-scripts in the synthetic transcriptome into small frag-ments and dynamically check the lengths of the generated fragments. Fragments with lengths in a cer-tain range (e.g. [150bp, 350bp]) are selected with prob-ability to construct the sequencing library. This step stops when the number of fragments in the library exceeds the pre-specified sequencing depth. (3) 2×75bp
paired-end reads are sampled from both ends of these selected fragments.
Matching criteria. We evaluate the assembly results using similar criteria proposed in IsoLasso [3]. The assembled transcripts are compared with all the expressed transcripts in the profile (referred as “ refer-ence transcripts”). Two multi-exon transcripts are con-sidered matched if they satisfy that (1) they contain the same set of exons; (2) all the exon boundary coordinates are identical except the start of the first exon and the end of the last exon. Also, two single-exon transcripts match if and only if at least 50% of the exons are over-lapped. We adopted sensitivity and precision to measure the accuracy of the assembly results. LetM denote the number of reference transcripts.Nout ofM′ assembled transcripts can be matched to the reference transcripts. Hence, sensitivity= N
M, and precision= N M.
Quantification accuracy criteria. Both Cufflinks and IsoLasso quantify transcript expression in the unit of FPKM. In Astroid, we use eTPM. However, these mea-surements cannot be directly compared. Therefore, we
evaluate the quantification accuracy by the correlation between the transcript abundances estimated by each method and the true profiles. Pearson correlation [33] is adopted for this assessment. LetYdenote the true copy numbers of the transcripts andŶdenote the estimated abundance. The correlation is calculated asr(Y,Ŷ) =cov
(Y,Ŷ)/(sY·sŶ), giving a value between−1 and +1. Higher
correlation indicates more accurate estimation results.
Results. We conduct our first experiment to compare the performance of different methods on the transcrip-tome level. 30 million 2×75 bp paired-end reads (insert size around 250 bp) were simulated from the human transcriptome using RefSeq transcripts annotation. According to the profile, 18,374 transcripts from 13,030 genes were expressed. The reconstructed full-length transcripts of each method were matched against the ground truth, then the sensitivity and precision were assessed against different gene expression quantiles.
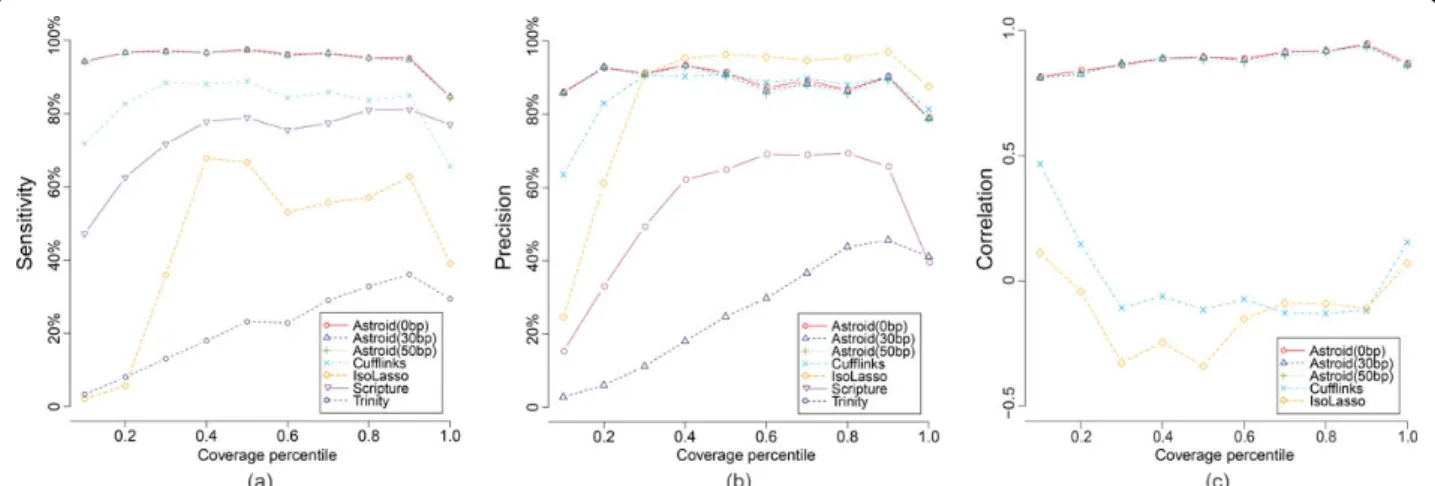
As shown in Figure 5(a), Astroid consistently acquired highest sensitivity with increasing gene coverage. Even for the lowly expressed genes (bottom 10%), Astroid successfully recovered around 95% of these transcripts which is more than at least 20% of all the other meth-ods. The precision of Astroid also outperformed the others on the bottom genes (shown in Figure 5(b)). As gene expression climbs, the precisions became compar-able between Astroid and Cufflinks, but were smaller than that of IsoLasso. This is probably related to the shrinkage strategy taken by IsoLasso which eliminates a large portion of transcripts through Lasso [34].
Figure 5(c) illustrates the quantification accuracy of each method. Astroid achieved highest correlation across different gene expression and demonstrated its ability of highly precise quantification through directly assembling transcript copies. However, both Cufflinks and IsoLasso showed very poor estimation. A further investigation on Cufflinks and IsoLasso abundance esti-mation results revealed that they both provided extre-mely high FPKM for short transcripts (less than 300 bp) which is quite inconsistent with the profile. Similar observation was also reported by Li,et al. [4]. Excluding the abnormal results on these short transcripts, the cor-relation increases for both methods, but still falls behind Astroid. Astroid, however, was not heavily affected by the length of transcripts because of its capability to explicitly model the distance between reads and tran-scription start and termination sites.
We also look into the effect of the compression para-meter on Astroid. According to the results shown in Figure 5, we do observe that Astroid baseline (g= 0bp) performs better than the other two with positiveg, but the difference is not that significant. Meanwhile, as shown in Supplementary Table 4, the time cost improves from 1 day to 1 hour as gincreases from 0 bp
to 50 bp. This suggests that significant improved in effi-ciency can be achieved without much degradation of its performance. Therefore, in real practice, we may set the compression parameters at a comparably larger value (g = len(r)/2). We use this setting in real data experiments.
We next evaluate how the sampling depth may affect the performance of each method. To do this, we first sample 10M and 20M 2×75 bp paired-end reads by ran-dom selection out of the 30M dataset. Table 1 shows the overall sensitivity, precision and correlation on these three datasets. From the statistics, we see that both the sensitivity and precision improve for all methods as more reads are sequenced. Apparently, higher sampling depth is more conducive for inferring transcript struc-tures. Similar with previous observation, Astroid showed best performance against various sampling depths, which indicates that eTPM computed from the effective transcripts, is a robust measure for estimating the rela-tive transcript abundance.
MAQC data study
For evaluation on real RNA-seq experiments, we first compared the four genome-guided transcript recon-struction approaches Astroid, Cufflinks, Scripture and IsoLasso using the RNA-seq dataset from Microarray Quality Control (MAQC) project Human Brain Refer-ence (HBR) sample [31] (NCBI Short Read Archive accession number SRA012427). This dataset contained 23 million 2 ȕ 50 bp paired-end reads generated from three lanes. Besides RNA-seq data, 907 transcripts were analyzed with TaqMan qRT-PCR for their expression, including 893 that could be matched to RefSeq tran-script annotation [35] (accession number GSE5350). We focused our analysis on this subset of validated transcripts.
Among the 893 qPCR-validated transcripts, Astroid correctly reconstructed 227, with a sensitivity of 25.42% (227 out of 893). This sensitivity is higher than those of Cufflinks (20.04% or 179 of 893) and IsoLasso (15.79% or 141 of 893). This demonstrates Astroid’s good ability
Table 1 Summary statistics of each method with various sampling depths.
Methods sensitivity precision correlation (long transcripts only)
10M 20M 30M 10M 20M 30M 10M 20M 30M Astroid(g= 0) 79.28% 91.71% 94.30% 51.44% 80.23% 86.61% .805 (.801) .870(.868) .922(.919) Astroid(g= 30) 79.20% 91.76% 94.22% 51.31% 80.01% 86.28% .808(.805) .872(.869) .918(.914) Astroid(g= 50) 79.08% 91.64% 93.87% 51.18% 79.47% 85.78% .808(.806) .874(.870) .912(.919) Cufflinks 49.43% 74.48% 81.50% 51.31% 75.75% 79.55% .106(.631) -.033 (.773) -.018(.808) IsoLasso 2.86% 23.97% 45.83% 19.83% 75.26% 85.81% -.027 (.356) 0.116 (.559) .011 (.755)
Scripture 38.51% 62.13% 74.04% 12.46% 26.34% 39.74% N/A N/A N/A
Trinity 3.36% 13.01% 23.04% 1.74% 6.13% 12.32% N/A N/A N/A
Correlation values in parentheses are calculated on only long transcripts (length>300 bp, detailed counts in Supplementary Table 1.
Figure 5Performance comparison of Astroid with 3 different compression parameters (0 bp, 30 bp and 50 bp), Cufflinks, IsoLasso, Scripture and Trinity on 30M 2×75 bp (insert size around 250 bp) paired-end dataset. Evaluation measurements were plotted against different gene expression quantile (in 10% increments). (a) Each point in the plot represents the sensitivity of one method which is the ratio between the number of matched transcripts and the reference transcripts within one quantile. (b) Each point represents the precision of one method which is the number of matched transcripts and the total assembled transcripts within one quantile. (c) The correlation of transcript expression is computed on the set of matched transcripts for each method.
Huanget al.BMC Bioinformatics2014,15(Suppl 9):S3 http://www.biomedcentral.com/1471-2105/15/S9/S3
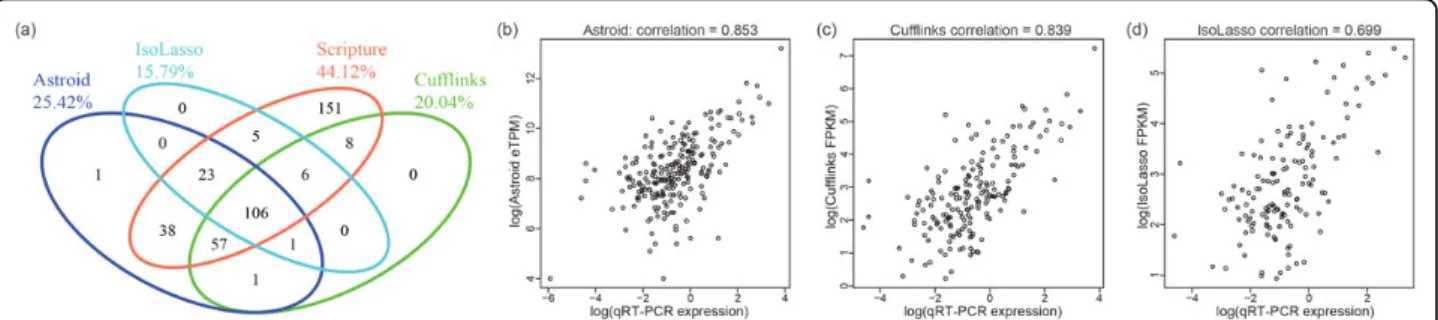
to reconstruct full-length transcripts. The venn diagram shown in Figure 6(a) illustrated a good consistency of their assembly results. We notice that Scripture recon-structed the most number of validated transcripts (44.12% or 394 of 893). This is due to the strategy of Scripture which tries to enumerate all possible tran-scripts given the exons and junctions observed from RNA-seq data. This strategy may highly increase the sensitivity but it also introduces large amount of false positives, especially on the genes with high coverage. In fact, the total number of assembled transcripts is 92,977 for Scripture which corresponds to a precision of 0.42% (394 of 92,977) and it is only half of Astroid (0.87% or 227 of 26,119). However, it is surprisingly that both Cufflinks and IsoLasso showed lower precision than Scripture on the identification of validated transcripts: 0.26% (179 of 69,011) and 0.10% (141 of 135,085). A close examination revealed that majority of their reconstructed transcripts are very short single-exon transcripts with low coverage, which are probably just background noises due to sequencing or mapping biases. Next, we examined the transcript expression measured by qRT-PCR experiments and the expression estimated by each method (excluding Scripture) on the set of tran-scripts that were validated and correctly reconstructed: scatter plots are shown in Figure 6(b)(d). Transcript abundance inferred by Astroid reached a Pearson corre-lation as high as 0.853 on all the transcripts it correctly assembled, slightly higher than Cufflinks (0.839) and much higher than IsoLasso (0.699).
This result demonstrated that Astroid is competitive for transcript quantification. We further ran Cufflinks in its quantification-only mode by providing the RefSeq transcript annotation. The estimated transcript abun-dance by Cufflinks on all 893 validated transcripts had a Pearson correlation of 0.866, consistent with its previous reports on MAQC dataset for transcript quantification [15]. The difference between Cufflinks without transcript annotation and with annotation suggests that down-stream analysis such as transcript quantification can be
significantly altered by transcript reconstruction results. On the other hand, Astroid shows the prominent ability of discovering the underlying transcripts and providing reliable expression estimates simultaneously.
Alexa-seq data study
We further applied Astroid and other methods to a real RNA-seq dataset used by Alexa-seq [32], an alternative expression/transcription analysis method. Total 262 mil-lion Illumina paired-end RNA-seq reads (36 bp or 42 bp) were generated from two cell lines: fluorouracil (5-FU)-resistant and -non(5-FU)-resistant human colorectal cancer cell lines, MIP101 and MIP/5-FU. The raw RNA-seq reads were downloaded from Alexa-seq website (http://www. alexaplatform.org/alexa_seq/). 167 million paired-end reads were generated from MIP101 sample and 89.82% of them were successfully mapped by MapSplice using human hg18 reference genome. The rest 95 million reads came from sample MIP/5-FU, among which 90.26% were mapped by MapSplice. Alexa-seq also provided qRT-PCR validation on 192 alternatively expressed exons. We focus the comparison of all the methods on identification of all the validated exons. One exon is considered recon-structed by one method if: (1) at least one assembled transcript contains this exon; (2) both boundaries of the identified exon have to match the hg18 annotation unless this exon is transcription start/end; (3) if the exon is tran-scription start/end, only downstream/upstream boundary of this exon is required to match the annotation, respec-tively. The estimated abundance on this exon is collected as the cumulative estimated abundance on the exon of all the transcripts assembled covering it.
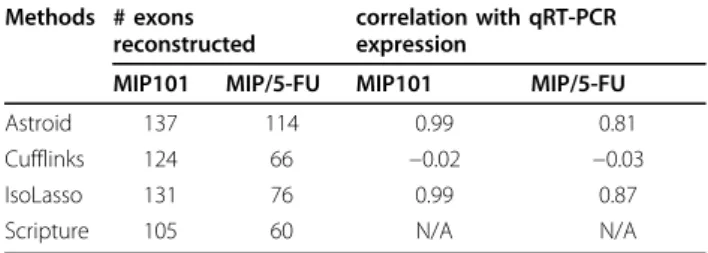
Table 2 shows the number of validated exons success-fully reconstructed and the correlation between the esti-mation and the qRT-PCR expression by each method. From the results, we observe that Astroid reconstructed the highest number of exons in both samples among all the assembly tools. This suggests that Astroid success-fully reconstructed the transcripts containing these tar-get exons. Meanwhile, correlation between estimated
Figure 6(a). Venn Diagram of qRT-PCR validated transcripts reconstructed by Astroid, Cufflinks, Scripture and IsoLasso. (b)-(d) Scatter plots (on
logescale) of transcript abundance estimated by Astroid, Cufflinks and IsoLasso, respectively, against qRT-PCR expression on the set of qRT-PCR validated transcripts that are reconstructed in full length by each method.
abundance and qRT-PCR expression was computed on the set of reconstructed exons by each method. Astroid and IsoLasso acquired the highest correlation (0.99) on sample MIP101, much higher than Cufflinks (−0.02). The correlation by Astroid dropped on MIP/5FU sam-ple, but was still comparable to IsoLasso, which also outperformed Cufflinks.
Although Astroid consistently performs better than the other methods on the two real RNA-seq datasets, it is noticed that its improvement is not as significant as that in simulation experiments. After further investigation, we found that: (1) for real datasets, we only have access to a very small set of validated transcripts or exons supported by abundant read alignments. But for simulation, we sampled reads from the whole transcriptome containing genes with a large dynamic range in their expression. The splice junctions with relatively low read support tend to be filtered out by methods like Cufflinks and Iso-Lasso, which lead to their failure in reconstructing the correct set of full-length transcripts; (2) for MAQC data-set, the transcripts with PCR validation are mainly from single-isoform genes. As we know, it is easier to recon-struct and quantify single-isoform genes than multi-isoform genes. As a result, the differences among these methods are minimal.
Discussion
In this article, we have proposed a novel method Astroid for simultaneous transcript reconstruction and quantification. Compared with existing methods which typically reconstruct isoforms in a splice graph, our approach provides a unique solution by piecing indivi-dual reads into a set of effective transcript copies. A novel measure for transcript abundance eTPM has also been defined based on the assembled effective copies, rather than indirect estimators that fully depend on the read count. The problem of the reconstruction of effective transcript copy has been modeled as a mini-mum-cost flow problem, which allows the solution of a maximumlikelihood set of copies.
We evaluated Astroid as well as four existing methods using both simulated data and real data. In general, the eTPM measure generated by Astroid has a better overall correlation with the ground truth or qRT-PCR
measurement than FPKM output from Cufflinks and Isolasso. However, further validations using real datasets are still necessary in checking out the relationships among eTPM, TPM and FPKM in terms of their accu-racy in inferring the abundance of alternative transcripts in multi-isoform genes as well as reconstructing iso-forms of genes with relatively low expression. We are also interested in validating whether eTPM or TPM would be able to effectively normalize transcript abun-dance by the size of transcript library that is sample-spe-cific, alleviating the risk of comparing transcriptoms with drastically different transcript composition.
We use the Weibull distribution to characterize the distribution of the fragment and between-fragment gap sizes. It was shown as an approximation of the fragment size distribution before size selection [10]. However, how to characterize the exact size distribution in real data needs further investigation. We are interested in answering the following questions: (1) would the Wei-bull distribution family fully capture the complexity of RNA-seq? (2) accordingly how would different distribu-tions affect the assembly results?
Our approach is built on the assumption that short read sequencing may only capture a fraction of each mRNA molecule. Hence, the sampling “gaps” on tran-scripts that we have modeled has the potential to handle uneven read distribution due to various biases, such as positional bias and sequence bias. Ill-formed copies which contain only a proportion of the expected tran-script may indicate an aberrant distribution of the observed reads and suggest possible biases. For example, if 3’end positional bias is observed, we may compensate the less sequenced 5’ end by allowing a larger gap between 5’ end and one fragment. We are currently working on potential methods to correct these biases within the existing framework.
Availability
The software package can be accessed at http://www. netlab.uky.edu/p/bioinfo/Astroid. The program takes read alignment as input in SAM format, and provides reconstructed transcripts in the standard GTF format. The estimated abundance for each gene or isoform will be given in the units of eTPM.
Additional material
Additional file 1: Supplemental material. List of notations used in the main manuscript and additional results on the simulated datasets from the whole human transcriptome.
Competing interests
The authors declare that they have no competing interests.
Table 2 Summary statistics on the validated set of exons.
Methods # exons reconstructed
correlation with qRT-PCR expression
MIP101 MIP/5-FU MIP101 MIP/5-FU
Astroid 137 114 0.99 0.81
Cufflinks 124 66 −0.02 −0.03
IsoLasso 131 76 0.99 0.87
Scripture 105 60 N/A N/A
Huanget al.BMC Bioinformatics2014,15(Suppl 9):S3 http://www.biomedcentral.com/1471-2105/15/S9/S3
Authors’contributions
All authors developed the methodology and wrote the manuscript. Yan Huang developed the Astroid software package and carried out the experiments. All authors read and approved the final manuscript. Declarations
This work was supported by The National Science Foundation [CAREER award grant number 1054631 to J.L. and ABI/EF grant number 0850237 to J. L.]; National Institutes of Health [grant number P30CA177558 and
5R01HG006272-03 to J.L.].
This article has been published as part of BMC Bioinformatics Volume 15 Supplement 9, 2014: Proceedings of the Fourth Annual RECOMB Satellite Workshop on Massively Parallel Sequencing (RECOMB-Seq 2014). The full contents of the supplement are available online at http://www. biomedcentral.com/bmcbioinformatics/supplements/15/S9.
Published: 10 September 2014
References
1. Trapnell C, Williams BA, Pertea G, Mortazavi A, Kwan G, van Baren MJ, Salzberg SL, Wold BJ, Pachter L:Transcript assembly and quantification by RNA-Seq reveals unannotated transcripts and isoform switching during cell differentiation.Nature Biotechnology2010,28:511-515, doi:10.1038/ nbt.1621.
2. Guttman M, Garber M, Levin JZ, Donaghey J, Robinson J, Adiconis X, Fan L, Koziol MJ, Gnirke A, Nusbaum C, Rinn JL, Lander ES, Regev A:Ab initio
reconstruction of cell type-specific transcriptomes in mouse reveals the conserved multi-exonic structure of lincRNAs.Nature Biotechnology2010,
28:503-510, doi:10.1038/nbt.1633.
3. Li W, Feng J, Jiang T:IsoLasso: A LASSO Regression Approach to RNA-Seq Based Transcriptome Assembly.J Comput Biol.2011,18(11):1693-1707. 4. Li B, Dewey CN:RSEM: accurate transcript quantification from RNA-Seq
data with or without a reference genome.BMC Bioinformatics2011,
12(323).
5. Li JJ, Jiang CR, Brown JB, Huang H, Bickel PJ:Sparse linear modeling of next-generation mRNA sequencing (RNA-Seq) data for isoform discovery and abundance estimation.Proc Natl Acad Sci USA2011,108(50):19867-72. 6. Mezlini AM, Smith EJ, Fiume M, Buske O, Savich G, Shah S, Aparicion S,
Chiang D, Goldenberg A, Brudno M:iReckon: Simultaneous isoform discovery and abundance estimation from RNA-seq data.Genome Research2012,23:519-529, doi:10.1101/gr.142232.112.
7. Behr J, Kahles A, Zhong Y, Sreedharan VT, Drewe P, Rätsch G:MITIE: Simultaneous RNA-Seq-based transcript identification and quantification in multiple samples.Bioinformatics2013,29(20):2529-2538.
8. Huang Y, Hu Y, Jones CD, MacLeod JN, Chiang DY, Liu Y, Prins JF, Liu J:
A Robust Method for Transcript Quantification with RNA-seq Data.16th Annual International Conference on Research in Computational Molecular Biology (RECOMB)2012.
9. Grabherr MG, Haas BJ, Yassour M, Levin JZ, Thompson DA, Amit I, Adiconis X, Fan L, Raychowdhury R, Zeng Q, Chen Z, Mauceli E, Hacohen N, Gnirke A, Rhind N, di Palma F, Birren BW, Nusbaum C, Lindblad-Toh K, Friedman N, Regev A:Full-length transcriptome assembly from RNA-Seq data without a reference genome.Nature biotechnology2011,29:644-652, doi:10.1038/nature07509.
10. Griebel T, Zacher B, Ribeca P, Raineri E, Lacroix V, Guig R, Sammeth M:
Modelling and simulating generic RNA-Seq experiments with the flux simulator.Nucleic Acids Research2012,40(20):10073-10083.
11. Tenchov BG, Yanev TK, Tihova MG, Koynova RD:A probability concept about size distributions of sonicated lipid vesicles.Biochimica et Biophysica Acta (BBA) Biomembranes1985,816(Issue 1):122-130. 12. Wagner GP, Kin K, Lynch VJ:Measurement of mRNA abundance using
RNA-seq data: RPKM measure is inconsistent among samples.Theory Biosci2012,131(4):281-5, doi:10.1007/s12064-012-0162-3.
13. Aird D, Ross MG, Chen WS, Danielsson M, Fennell T, Russ C, Jaffe DB, Nusbaum1 C, Gnirke A:Analyzing and minimizing PCR amplification bias in Illumina sequencing libraries.Genome Biology2011,12(2):R18. 14. Li J, Jiang H, Wong WH:Modeling non-uniformity in short-read rates in
RNA-Seq data.Genome Biology2010,11(5):R50.
15. Roberts A, Trapnell C, Donaghey J, Rinn JL, Pachter L:Improving RNA-Seq expression estimates by correcting for fragment bias.Genome Biology
2011,12(3):R22.
16. Turro E, Su SY, Goncalves A, Coin LJ, Richardson S, Lewin A:Haplotype and isoform specific expression estimation using multi-mapping RNA-seq reads.Genome Biology2011,12(2):R13.
17. Trapnell C, Pachter L, Salzberg SL:TopHat: discovering splice junctions with RNA-Seq.Bioinformatics2009,25:1105-1111.
18. Wang K, Singh D, Zeng Z, Huang Y, Coleman S, Savich GL, He X, Mieczkowski P, Grimm SA, Perou CM, MacLeod JN, Chiang DY, Prins JF, Liu J:MapSplice: Accurate mapping of RNA-seq reads for splice junction discovery.Nucleic Acids Research2010,38(18):178.
19. Heber S, Alekseyev M, Sze SH, Tang H, Pevzner PA:Splicing graphs and EST assembly problem.Bioinformatics2002,18(suppl 1):181-188. 20. Hu Y, Huang Y, Du Y, Orellana C, Singh D, Johnson A, Monroy A, Kuan PF,
Hammond S, Makowski L, Randell S, Chiang D, Hayes D, Jones C, Liu Y, Prins J, Liu J:DiffSplice: the Genome-Wide Detection of Differential Splicing Events with RNA-seq.Nucleic Acids Research2012,41(2):e39. 21. Rogers MF, Thomas J, Reddy AS, Ben-Hur A:SpliceGrapher: detecting patterns of alternative splicing from RNA-Seq data in the context of gene models and EST data.Genome Biology2012,13(1):R4.
22. Xia Z, Wen J, Chang CC, Zhou X:NSMAP: a method for spliced isoforms identification and quantification from RNA-Seq.BMC Bioinformatics2011,
12:162.
23. Kapranov P:From transcription start site to cell biology.Genome Biology
2009,10(4):217, doi:10.1186/gb-2009-10-4-217.
24. Yamashita R, Sathira NP, Kanai A, Tanimoto K, Arauchi T, Tanaka Y, Hashimoto Si, Sugano S, Nakai K, Suzuki Y:Genome-wide characterization of transcriptional start sites in humans by integrative transcriptome analysis.Genome Research2011,21(5):775-789, doi:10.1101/gr.110254.110. 25. Ahuja RK, Magnanti TL, Orlin JB:Network Flows: Theory, Algorithms, and
Applications.Prentice Hall1993.
26. Edmonds J, Karp RM:Theoretical improvements in algorithmic efficiency for network flow problems.Journal of the ACM1972,19(2):248-264. 27. Goldberg AV, Tarjan RE:Finding minimum-cost circulations by canceling
negative cycles.Journal of the ACM1989,33(4):873-886. 28. Orlin JB:A polynomial time primal network simplex algorithm for
minimum cost flows.Mathematical Programming1997,78:109-129. 29. Garber M, Grabherr MG, Guttman M, Trapnell C:Computational methods
for transcriptome annotation and quantification using RNA-seq.Nature Methods2011,8:469-477, doi:10.1038/nmeth.1613.
30. Kent WJ:BLAT-the BLAST-like alignment tool.Genome Research2002,
12(4):656-664, doi:10.1101/gr.229202.
31. Shi L, LH R, WD J, R S,et al:The MicroArray Quality Control (MAQC) project shows interand intraplatform reproducibility of gene expression measurements.Nature Biotechnology2006,24:1151-1161.
32. Griffith M, Griffith OL, Mwenifumbo J, Goya R, Morrissy AS, Morin RD, Corbett R, Tang MJ, Hou YC, Pugh TJ, Robertson G, Chittaranjan S, Ally A, Asano JK, Chan SY, Li HI, McDonald H, Teague K, Zhao Y, Zeng T, Delaney A, Hirst M, Morin GB, Jones SJM, Tai IT, Marra MA:Alternative expression analysis by RNA sequencing.Nature Methods2010,7(10):843-7, doi:10.1038/nmeth.1503.
33. Bohnert R, Rätsch G:rQuant.web: a tool for RNA-Seq-based transcript quantitation.Nucleic Acids Research2010,38(Suppl 2):W348-W351. 34. Tibshirani R:Regression shrinkage and selection via the lasso.Journal of
Royal Statistical Society Series B1996,58:267-288.
35. Pruitt KD, Tatusova T, Brown GR, Maglott DR:NCBI reference sequences: current status, policy and new initiatives.Nucleic Acids Research2008,
37:32-36, doi:10.1093/bioinformatics/bts260.
36. Thorvaldsdóttir H, Robinson JT, Mesirov JP:Integrative Genomics Viewer (IGV): high-performance genomics data visualization and exploration.
Briefings in Bioinformatics2013,14(2):178-192, doi:10.1093/bib/bbs017.
doi:10.1186/1471-2105-15-S9-S3
Cite this article as:Huanget al.:Piecing the puzzle together: a revisit to transcript reconstruction problem in RNA-seq.BMC Bioinformatics2014