RETINAL VESSEL SEGMENTATION
USING TEXTONS
LEI ZHANG
A thesis submitted to the University Of East Anglia School Of
Computing Sciences in fulfilment of the requirements for the degree
of Doctor of Philosophy.
© This copy of the thesis has been supplied on condition that anyone who
consults it is understood to recognise that its copyright rests with the author and
that no quotation from the thesis, nor any information derived therefrom, may
be published without the author's prior written consent.
i
Abstract
Segmenting vessels from retinal images, like segmentation in many other medical image domains, is a challenging task, as there is no unified way that can be adopted to extract the vessels accurately. However, it is the most critical stage in automatic assessment of various forms of diseases (e.g. Glaucoma, Age-related macular degeneration, diabetic retinopathy and cardiovascular diseases etc.). Our research aims to investigate retinal image segmentation approaches based on textons as they provide a compact description of texture that can be learnt from a training set. This thesis presents a brief review of those diseases and also includes their current situations, future trends and techniques used for their automatic diagnosis in routine clinical applications. The importance of retinal vessel segmentation is particularly emphasized in such applications. An extensive review of previous work on retinal vessel segmentation and salient texture analysis methods is presented. Five automatic retinal vessel segmentation methods are proposed in this thesis. The first method focuses on addressing the problem of removing pathological anomalies (Drusen, exudates) for retinal vessel segmentation, which have been identified by other researchers as a problem and a common source of error. The results show that the modified method shows some improvement compared to a previously published method. The second novel supervised segmentation method employs textons. We propose a new filter bank (MR11) that includes bar detectors for vascular feature extraction and other kernels to detect edges and photometric variations in the image. The k-means clustering algorithm is adopted for texton generation based on the vessel and non-vessel elements which are identified by ground truth. The third improved supervised method is developed based on the second one, in which textons are generated by k-means clustering and texton maps representing vessels are derived by back-projecting pixel clusters onto hand labelled ground truth. A further step is implemented to ensure that the best combinations of textons are represented in the map and subsequently used to identify vessels in the test set. The experimental results on two benchmark datasets show that our proposed method performs well compared to other published work and the results of human experts. A further test of our system on an independent set of optical fundus images verified its consistent performance. The statistical analysis on experimental results also reveals that it is possible to train unified textons for retinal vessel segmentation. In the fourth method a novel scheme using Gabor filter bank for vessel feature extraction is proposed. The
ii method is inspired by the human visual system. Machine learning is used to optimize the Gabor filter parameters. The experimental results demonstrate that our method significantly enhances the true positive rate while maintaining a level of specificity that is comparable with other approaches. Finally, we proposed a new unsupervised texton based retinal vessel segmentation method using derivative of SIFT and multi-scale Gabor filers. The lack of sufficient quantities of hand labelled ground truth and the high level of variability in ground truth labels amongst experts provides the motivation for this approach. The evaluation results reveal that our unsupervised segmentation method is comparable with the best other supervised methods and other best state-of-the-art methods.
iii
Acknowledgements
First and foremost, I wish to express my deepest gratitude to my supervisor Dr Mark Fisher who has been a tremendous mentor for me. You gave me the encouragement, motivation and understanding to start my Ph.D. research and undertake this challenging task.
I would like to thank and express my big gratitude to my co-supervisor Dr Wenjia Wang for his patient guidance and valuable support. I appreciate all his contributions of time, and advices to make my research experience substantial and efficient.
I would like to thank Dr Tim Morris, Manchester University and colleagues at Manchester Royal Eye Hospital for allowing us to use the MREH fundus image data set.
I would also like to thanks my best friend Zhi for the memorable moments shared with me.
Finally, but not the least, I would like to express my special thanks to my parents, father-in-law and mother-in father-in-law for all their love and encouragement. No words can express how grateful I am to my parents for all of the sacrifices that you’ve made on my pursuits. And most of all for my loving, supportive wife Yuan whose constant support during the period of my study is so appreciated.
Lei Zhang
University of East Anglia
iv
Publications
[1] M. Fisher, L. Zhang, An improved method of blood vessel segmentation in retinal images, International Journal of Computer Assisted Radiology and Surgery, vol. 7, pp. s361-s362, 2012.
[2] L. Zhang, M. Fisher and W. J. Wang, Compensating for Drusen in Retinal Vessel Segmentation, In 16th Conf. on Medical Image Understanding and Analysis, pp.185-190, 2012.
[3] L. Zhang, M. Fisher, W. J. Wang, Locating blood vessels in retinal images using unified Textons, In 17th Conf. on Medical Image Understanding and Analysis, pp. 213-218, 2013. [4] L. Zhang, M. Fisher and W. J. Wang, Retinal vessel segmentation using Gabor filter and textons, In 18th Conf. on Medical Image Understanding and Analysis, pp.155-160, 2014. [5] L. Zhang, M. Fisher and W. J. Wang, Comparative performance of texton based vascular tree segmentation in retinal images, in IEEE international conference on image processing, pp.952-956, 2014.
[6] L. Zhang, M. Fisher and W. J. Wang, A new texton based retinal vessel segmentation method using Gabor filter and Derivative of SIFT, computerized medical imaging and graphics, 2014. Submitted
v
Glossary
A/V ratio: vein/artery ratio
AMD: Age-related Macular Degeneration AUC: The Area Under the Curve
C/D ratio: Optical Cup/Disc ratio CAD: Computer-Assisted Diagnostic CCD: Charge-Coupled Device CMF: Classic Matched Filter
DHHS: The U.S. Department of Health and Human Services DMD: Dry Macular Degeneration
DME: Diabetic Macular Edema DoG: Difference of Gaussian DR: Diabetic Retinopathy FPF: False Positive Fractions
GLCM: Grey Level Co-occurrence Matrix IOP: Intraocular Pressure
IRMA: Intra-Retinal Microvascular Abnormality LBP: Local Binary Pattern
MA: Microaneurysms MRF: Markov random fields MRI: Magnetic resonance imaging OD: Optic Disc
ONH: Optic Nerve Head
ROC: Receiver Operating Characteristic curves SIFT: Scale Invariant Feature Transform SLO: Scanning Laser Ophthalmoscopy TPF: True Positive Fractions
WHO: World Health Organization WMD: Wet Macular Degeneration
vi
Contents
RETINAL VESSEL SEGMENTATION USING TEXTONS ... i
Abstract ... i Acknowledgements ... iii Publications ... iv Glossary ... v Contents ... vi List of Figures ... ix
List of Tables ... xiv
CHAPTER 1 ... 1 1. Introduction ... 1 1.1 Overview ... 1 1.2 Retinal images ... 3 1.2.1 Eye Anatomy ... 3 1.2.2 Fundus imaging ... 4
1.2.3 Landmarks of fundus photography ... 9
1.2.4 Review of common diseases using analysis of retinal fundus images... 11
1.3 Automated detection of retinal disease using fundus images ... 18
1.3.1 Automated detection of Glaucoma ... 19
1.3.2 Automated detection of AMD ... 20
1.3.3 Automated measurement of vascular disorders ... 22
1.3.4 Automated detection of DR ... 23
1.4 The thesis contributions ... 25
1.5 Organization of thesis ... 26
CHAPTER 2 ... 28
2. Review of retinal vessel segmentation and evaluation ... 28
2.1 Evaluation method ... 31
2.1.1 Sensitivity, Specificity and Accuracy ... 31
2.1.2 Receiver operating characteristic (ROC) curves ... 32
2.2 Available Materials ... 33
2.2.1 DRIVE database... 33
vii
2.3 Retinal vessel segmentation methods ... 34
2.3.1 Methods using matched filters ... 35
2.3.2 Methods tracing vessel structures ... 39
2.3.3 Classifier based methods... 43
2.3.4 Model based methods ... 50
2.4 Chapter conclusion and discussion ... 54
CHAPTER 3 ... 62
3. Texture measure for segmentation ... 62
3.1 Texture analysis methods ... 63
3.1.1 Statistical methods ... 64
3.1.2 Structural methods, Textons ... 65
3.1.3 Model based methods ... 67
3.2 Texture feature extraction and description ... 67
3.2.1 First order statistic based feature ... 68
3.2.2 Co-occurrence matrix (GLCM) ... 69
3.2.3 Markov random fields (MRF) ... 71
3.2.4 Spatial domain filter bank (MR8, LM, Berkley) ... 73
3.2.5 Joint spatial/frequency domain filters ... 76
3.3 Local invariant texture feature descriptor ... 78
3.3.1 Local Binary Pattern (LBP) ... 79
3.3.2 Scale invariant feature transform (SIFT) ... 81
3.4 Chapter conclusion and discussion ... 82
CHAPTER 4 ... 85
4. Retinal vessel segmentation on pathological fundus image ... 85
4.1 The influence of abnormalities on vessel segmentation ... 86
4.2 Drusen detection using local energy ... 87
4.3 Retinal vessel segmentation using Matched filter ... 89
4.3.1 Matched filter ... 89
4.3.2 Segmentation method... 91
4.4 Experimental results and evaluation ... 92
4.5 Chapter conclusion and discussion ... 94
Chapter 5 ... 96
viii
5.1 Supervised texton based retinal vessel segmentation ... 96
5.1.1 Feature extraction using the MR11 Filter bank ... 98
5.1.2 Textons generation and segmentation ... 102
5.1.3 Experimental results and evaluation ... 104
5.2 An improved supervised texton based retinal vessel segmentation ... 106
5.2.1 The improved scheme of texton generation ... 107
5.2.2 Experimental results and evaluation ... 108
5.3 Retinal vessel segmentation using general textons ... 113
5.3.1 Experimental setup... 113
5.3.2 Comparative study of retinal vessel segmentation using general textons... 114
5.4 Chapter conclusion and discussion ... 119
Chapter 6 ... 121
6. Texton based retinal vessel segmentation using Gabor filters and derivative of SIFT .. 121
6.1 Retinal vessel segmentation using Gabor filter and Textons ... 122
6.1.1 Optimization of Gabor filter parameters ... 122
6.1.2 Generating the textons ... 127
6.1.3 Experimental results and evaluation ... 127
6.2 Unsupervised texton based retinal vessel segmentation using DSIFT and the multi-scale Gabor filter ... 129
6.2.1 Derivative of SIFT ... 131
6.2.2 Textons generation and segmentation ... 135
6.2.3 Experimental results and evaluation ... 138
6.3 Chapter conclusion and discussion ... 141
Chapter 7 ... 143
7. Conclusion and future work ... 143
ix
List of Figures
Figure 1.1 Cross sectional illustration of eye structures. [4] ... 3
Figure 1.2 Fundus photographs of normal eyes. (a) A red-free fundus image (left eye) [12]; (b) A colour fundus image (right eye) [11]. ... 5
Figure 1.3 Stereo Optic Nerve Head (ONH) image [15] ... 6
Figure 1.4 Normal Fluorescein Angiogram [18] ... 7
Figure 1.5 (a) Image at the retinal nerve fibre layer obtained by Heidelberg Retinal
Tomogroph II (b) The Heidelberg Retinal Tomogroph III. ... 8
Figure 1.6 An example retinal image (fundus photography) showing anatomic structures. ... 10
Figure 1.7 A fundus image of glaucoma patient. Diagnostic: focal nerve fibre loss. [27] ... 12
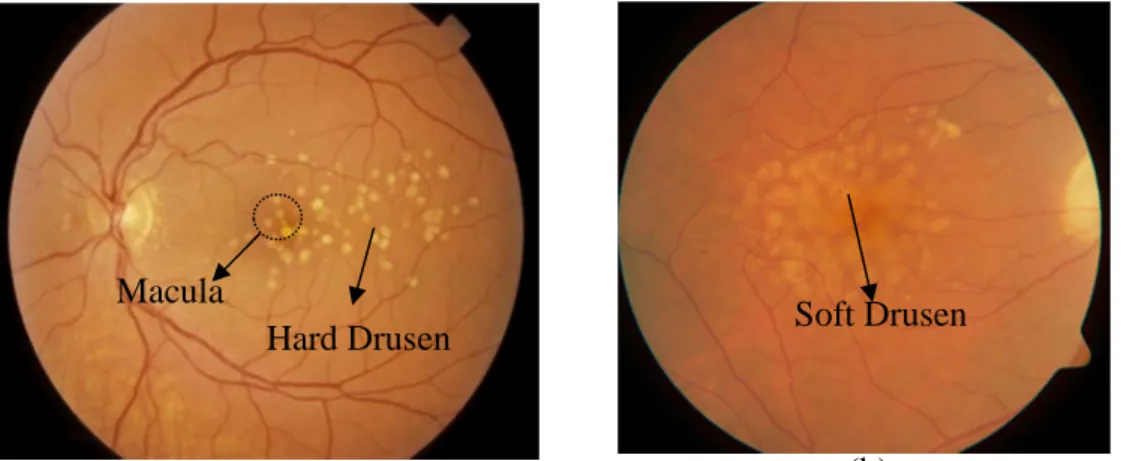
Figure 1.8 Two forms of age-related macular degeneration (AMD). The bright spots in (a) are hard drusen; (b) is wet AMD with soft drusen... 14
Figure 1.9 Manifestations of hypertensive retinopathy in fundus images. (a) A decrease A/V ratio; (b) nipping characteristic; (c) example of flame haemorrhages; (d) pale cotton-wool spots [42]. ... 15
Figure 1.10 Different stages of diabetic retinopathy in (a) background retinopathy; (b)
macular exudates; (c) pre-proliferative retinopathy and (d) proliferative retinopathy. ... 18
Figure 2.1 A series of factors influence the automatic retina vessel segmentation. (a)
illustrates the large and tiny vessel width; (b) demonstrates the exudates, the boundary of the OD in (c) exhibits an extremely large intensity gradient change, vessel cross and vessel reflection are shown in (a) and (c). ... 30
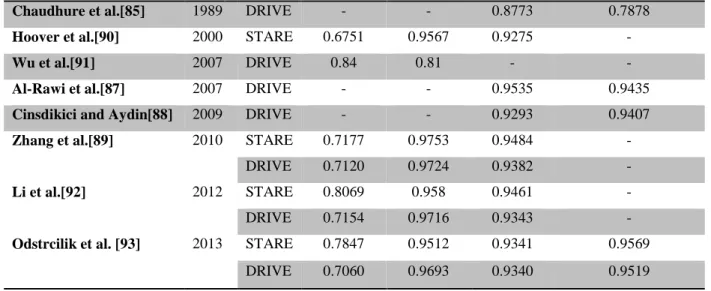
Figure 2.2 Histograms of terms: Accuracy (Blue), sensitivity (Red) and specificity (Green) on the DRIVE database ... 60
x Figure 2.3 Histogram of terms: Accuracy (Blue), sensitivity (Red) and specificity (Green) on the STARE database ... 61
Figure 3.1 Two texture patterns with identical second-order statistics. Left pattern (a) is composed of a pair of units which have the same textons (terminators) and right pattern (b) is composed of a pair of units which have different number of terminators. ... 66
Figure 3.2 GLCM calculation with matrix function parameters d=1, = {0o, 45o, 90o, 135o}. (a) is an 4x4 image example with grey levels {0,1,2,3}; (b) is the construction of GLCM; (c)(d)(e)(f) are the different forms of GLCM which are generated on four orientations. ... 70
Figure 3.3 The LM filter bank with 48 filter kernels, which composes of (a) 18
even-symmetric filters, (b) 18 odd-even-symmetric filters, (c) 8 DoG filters and (d) 4 Gaussian filters . 74
Figure 3.4 MR8 filter bank with 38 filter kernels, which composes of (a) 18 odd-symmetric filters, (b) 18 even-symmetric filters, (c) LoG filter and Gaussian filter ... 75
Figure 3.5 Berkley Martin filter bank with 13 filter kernels... 76
Figure 3.6 Schmid filter bank with 13 filter kernels ... 78
Figure 3.7 An example of LBP computation, (a) a simple image of 3×3 size with corresponding grey level values of each pixel, (b) illustrates the grey level differences between the centre pixel and neighbouring pixels, (c) illustrates 8 binary numbers
surrounding the centre pixel... 79
Figure 3.8 SIFT descriptor computation, (a) illustrates the image gradient magnitudes and orientations in the region around the key point at the selected scale, the descriptor (b) is formed as a vector which contains values of the orientations and corresponding lengths. ... 82
Figure 4.1 The segmentation problem for fundus image contains pathological changes. (a) a grey level fundus image contains numerous drusens; (b) illustrates retinal vessel
segmentation result using the matched filter based method proposed by Chanwimaluang [192] ... 86
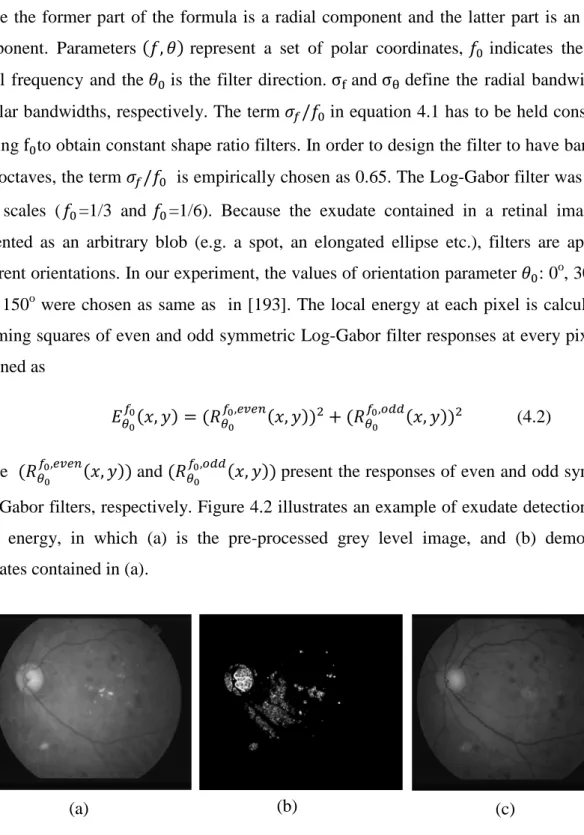
Figure 4.2 Local energy example of detecting exudate. (a) is the pre-processed grey level image, and (b) demonstrates exudates contained in (a); (c) is the result image where the exudates are removed. ... 88
xi Figure 4.3 Vessel’s cross-sectional intensity profile and matched filter kernels (d) and
examples of filtering results. (a) is a patch of original fundus image; (b) is a cross-sectional intensity profile of a vessel; (c) is the cross-sectional intensity profile of the matched filter kernel with orientations = 0°; (e) show examples that result from the filtering using Match Filter, where the gray scale images are illustrated in left column of (e) and the right column illustrates the corresponding filter responses. ... 90
Figure 4.4 The comparison of vessel segmentation results using our and Chanwimaluang method. (a) is pre-processed image; (b) is its ground truth; (c) is the segmentation result using Chanwimaluang method; and (d) is the segmentation result using our method. ... 93
Figure 4.5 ROC curves for the first image of STARE ... 94
Figure 5.1 The framework of a supervised texton based retinal vessel segmentation method. ... 97
Figure 5.2 Filter bank MR11 for vascular feature extraction ... 101
Figure 5.3 Comparisons of responses to filters in MR11 filter banks. (a) is an example image; (a1) is the (a) filter response to second order derivative of Gaussian at scale ( , )=(1.5, 4.5); (a2) is the matched filter response at scale σ=1.5; (b) illustrates ROC plots for both second order derivative of Gaussian an Matched filter. (c) is an amplified vessel reflection presented in (a); (c1) is the filtering result using the second order derivative of Gaussian; and (c2) is the filtering result using difference of Gaussian. ... 102
Figure 5.4 Flowchart of texton generation algorithm ... 103
Figure 5.5 Examples of segmentation results using two textons (the third row a2, b2) and four textons (the fourth row a3, b3); (a)(b) are original images and (a1)(b1) are their
corresponding ground truths. ... 105
Figure 5.6 The framework of improved supervised texton based retinal vessel segmentation method... 107
Figure 5.7 Textons dictionaries of STARE and DRIVE database. (a) is the STARE textons dictionary, IDs (1, 2, 5) are indicated as vessel related textons and IDs (3, 4) are non-vessel
xii textons; (b) is the DRIVE textons dictionary, IDs (2, 3, 4) are vessel textons and IDs (1, 5)
are non-vessel textons. ... 108
Figure 5.8 Examples of segmentation results using improved supervised texton based method. The first row (a) (b) (c) (d) shows original colour fundus images; The second row (a1) (b1) (c1) (d1) illustrates corresponding ground truths; the bottom row (a2) (b2) (c2) (d2) are vessel segmentation using our improved scheme. ... 109
Figure 5.9 The segmentation results with the least sensitivity for both STARE and DRIVE databases. (a) (b) are test images of STARE and DRIVE databases; (a1) and (b2) are the ground truths and (a2), (b2) are the segmentation results ... 111
Figure 5.10 The box plots of accuracy, sensitivity and specificity for Marín, human and our* methods ... 115
Figure 5.11 The examples of segmentation on a MREH image using different training regimes. (a) is an original test image; (b) demonstrates the ground truth; (c) is the segmentation result using STARE textons and (d) is the segmentation result using textons trained from subset of MREH database. ... 118
Figure 5.12 (a) The box plots of measurements of two classifiers trained on MREH (MREH) and STARE (MREH*); (b) Comparative performance of two experts. ... 118
Figure 6.1 Showing the characteristics of vessel boundaries, the symmetric Gabor kernel and the optimal Gabor filter bank; (a) is a panel cropped from a grey-level retinal image; (b) a grey level profile from the red line crossing the vessel in (a); (c) Gabor kernel with parameter φ=0; (d) Gabor kernel with parameter φ= π; (e) is optimized Gabor filter bank for retinal vessel feature extraction. ... 123
Figure 6.2 The ROC curves obtained by different lambda values. ... 125
Figure 6.3 The AUCs of ROCs with different lambdas... 125
Figure 6.4 Comparative ROCs between Gabor filter and Matched filter ... 126
Figure 6.5 An example of optimal Gabor filter response, (a) is an original fundus image and (b) is the filter response to optimized Gabor filter. ... 126
xiii Figure 6.6 Examples of segmentation on a DRIVE image using optimized Gabor filter. (a) is an original image, (b) is its ground truth and (c) is the vessel segmentation ... 128
Figure 6.7 The framework of an unsupervised retinal vessel segmentation on fundus image using multi-scale Gabor filters and DSIFT ... 130
Figure 6.8 Vessel features extraction and key points selection in DSIFT ... 132
Figure 6.9 Examples of detected key points of vessels and corresponding descriptors. (a) illustrates the key points and (b) illustrates corresponding descriptors. One of the descriptors is zoomed in and presented in (b1); one of the orientation histograms presented in (b1) is illustrated in (b2). ... 133
Figure 6.10 More accurate diameters of veins, arteries and capillaries in segmentation results using multi-scale Gabor filter. (a) is an original fundus image, (b) is its ground truth (c) is the vessel segmentation using our method and (d) is the segmentation using Cinsdikici [88] method... 137
Figure 6.11 Unsupervised texton based vessel segmentation results using multi-scale Gabor filter. (a)(b) are original fundus images, their ground truths are shown in (a1)(b1), and (a2)(b2) are corresponding vessel segmentations using our method. ... 138
xiv
List of Tables
Table 2-1 The confusion matrix of measures properties ... 32
Table 2-2 Performances of matched filtering based retinal vessel segmentation approaches . 38
Table 2-3 Performances of tracing based retinal vessel segmentation approaches ... 43
Table 2-4 Performances of supervised classifier-based retinal vessel segmentation approaches ... 48
Table 2-5 Performance of unsupervised classification based retinal vessel segmentation approaches... 50
Table 2-6 Performances of model based retinal vessel segmentation approaches ... 53
Table 2-7 Performances of other retinal vessel segmentation approaches ... 54
Table 2-8 Performance of previous retinal vessel segmentation methods on the DRIVE
database ... 59
Table 2-9 Performance of previous retinal vessel segmentation methods on the STARE database ... 60
Table 4-1 Comparative results on STARE data using our method and the method in [192]. . 93
Table 5-1 Performance results on DRIVE database using 2 texons and 4 textons ... 106
Table 5-2 Performance results on STARE and DRIVE databases using improved supervised retinal vessel segmentation on fundus images ... 110
Table 5-3 Comparison between our method with five other methods on STARE and DRIVE databases ... 112
Table 5-4 Measurement results on DRIVE database using STARE textons ... 116
Table 5-5 Performance results on MREH database using two training regimes ... 117
xv Table 6-2 Comparative results on the DRIVE database ... 129
Table 6-3 A schematic diagram of the meta-texton trained from the DRIVE database ... 136
Table 6-4 Performance results on DRIVE database using multi-scale Gabor filter and DSIFT ... 139
Table 6-5 Comparative results between our unsupervised retinal vessel segmentation method and other state-of-the-art methods on the DRIVE database ... 140
1
CHAPTER 1
1.
Introduction
1.1
Overview
In recent decades, the assessment of retinal images has become increasingly important in early medical diagnosis of several diseases such as diabetes, hypertension and cardiovascular disease etc. [2]. Images of the ocular fundus are now routinely captured during retinal examinations as they allow pathological changes of retinal vasculatures such as diameter, length, and branching angle to be measured as these features, together with other anomalies enable clinical experts to diagnose and assess the progression of a range of diseases [2]. Because of this, the routine screening of these images is viewed as particularly important but human assessment of retinal vessels and the detection of anomalies is a skilled time consuming task [1]. For instance, diabetic retinopathy (DR) is a serious eye disease that affects the vision of patients with diabetes and even causes adult blindness by affecting and damaging the retinal vasculature structures inside the eye. However, it’s hard to detect DR in its early stage until vision loss occurs. Imaging and analysing the optic fundus of patients at regular intervals, is one solution that could prevent this by detecting the changes of retinal vessels and treating the disease at an early stage. Computer based assessment of retinal vessels is seen as an important tool in undertaking population-based diagnoses of DR and this has motivated research into automatic assessment techniques.
Many automatic assessment procedures initially require the segmentation of the vessels from the background and this task plays a very important role in the success of the subsequent computer assisted diagnosis stages. It is a crucial stage which produces basic material that can be analysed and assessed. The completeness and accuracy of vessel segmentation determines the practicality of automated detection of relative diseases (see sub-section 1.2.4). However, in practice, automatic accurate retinal vessel segmentation is still a great challenge because of the complex nature of fundus images and effects such as noise,
2 low contrast between vessels (capillaries) and background, some abnormal regions (pathologies), illumination (vessel reflection), the variety of vessel structures (different width, length, cross) etc. All of these factors may influence the accuracy of segmentation. For instance, low contrast between the capillaries and the background could result in a failure to detect smaller capillaries or some abnormal non-vessel objects (exudates) to be segmented as vessels.
Our research aims to design and develop accurate retinal vessel automatic segmentation approaches based upon investigating texture analysis techniques. The motivation of our research focuses on structural texture analysis techniques using textons as we have found this approach to be under represented in the retinal vessel segmentation methods published within this research specialism. Work elsewhere in computer vision has demonstrated the advantages of using texture in providing significant information to distinguish the various patterns that present different visual features. For example, texture based segmentation methods in natural image segmentation and feature analysis has been widely studied and researchers have achieved some successes on problems of content based image retrieval. With this in mind, we believe that this research makes a significant contribution in filling a gap in the retinal vessel segmentation research field by investigating structure based texture analysis techniques (textons) to achieve accurate retinal vessel segmentation. This thesis particularly focuses on investigating texton-based approaches which have been a significant branch of texture analysis process since the term texton was introduced by Julesz in the 1980’s [3].
In the following sections, we introduce the background relating to retinal vessel segmentation and include knowledge of the optical fundus image and descriptions of elements in retinal images relevant to vessel network segmentation. We also describe the diagnosis of common diseases using analysis of retinal fundus images followed by corresponding reviews of automated disease detection techniques using fundus images in recent years emphasizing the importance of retinal vessel segmentation in automated computer aided diagnosis system. Finally the corresponding contributions of the research are summarized and the overall outline of the thesis is described.
3
1.2
Retinal images
1.2.1
Eye Anatomy
This thesis focuses on the retina. Firstly, we describe eye anatomy related background knowledge. Figure 1.1 illustrates a brief review of eye structure. The visible parts of eye have a number of components which include cornea, sclera, iris, pupil, lens, vitreous body, retina, optic nerve and choroid. The cornea looks like a clear window at the front of the eye which allows light to transmit into the eye. The sclera is normally known as the ‘white of the eye’ and forms a part of the supporting wall of the eyeball. The iris is a colored circular muscle. It regulates the amount of light that is allowed to enter the eye by controlling the size of pupil, depending on the intensity of incoming light.
The lens is a transparent structure that converges and focuses light waves onto the retina. The vitreous body fills the middle of eye between the lens and retina. It is filled with a viscous substance. The retina is the nerve layer that lines the back of eye. Here, light impulses are sensed and changed into electrical signals that are sent though the optic nerve to the brain. In the center of the retina, there is a small and highly light-sensitive yellow spot, which is known as the macula. It’s a critical part of retina responsible for transforming the light into a nerve signal. The fovea is located near the center of the macula and responsible for detailed central and high resolution vision. The optic nerve transfers the electrical signals generated by the retina to the visual cortex of the brain. All of these components form three
4 different layers: the external layer is formed by the sclera and cornea, the intermediate layer is formed by the iris, ciliary body and choroid, the internal layer is the retina [5].
The process of vision is described as follows. Light waves enter the eye first through the cornea (external layer), the light then focus through the pupil, the size of it is controlled by the iris (intermediate layer). The light is directed by the pupil to the lens, which focuses the light and projects it on the retina (internal layer); the retina forms the light into electrical signals sent to cortex of the brain though the optic nerve.
Many prevalent diseases can be studied by analyzing pathological information extracted from the internal layer (retina), such as diabetic, diabetic retinopathy, glaucoma, and cardiovascular disease [2]. Hence visualisation of the retina has attracted great interest for a long time. Due to the availability of digital fundus cameras retinal imaging techniques have developed rapidly during the past several decades.
1.2.2
Fundus imaging
Since the appearance of features on the retina allows detection of diseases that may cause visual loss, such as diabetic retinopathy, and because records of their structural change over time provides objective evidence on the progression of the disease and response to treatment techniques for capturing and analysing images of the retina fundus have attracted great interest amongst scientists and researches during the past years. Today, techniques for imaging the eye are based upon the achievement of Gullstrand who first developed the fundus camera in 1910 [7]. The concept of fundus photography is still used to guide development of recent fundus imaging techniques. Fundus imaging is the procedure for capturing the components (such as retina, optic disc, macula, fovea et.al.) on the internal surface of eyeball [8]. Technically speaking, fundus imaging is the process whereby the 3D internal surface of eyeball is represented as a 2D object projected onto the imaging plane using reflected light [9]. Because of its cost-efficiency, fundus imaging is now commonly adopted in ophthalmology departments as a primary method of retinal imaging [10]. The following modes or techniques are representative categories of fundus imaging.
• Fundus photography: Images are obtained by a fundus camera which is equipped with a specialized low power microscope and an attached camera [22]. The basis of using fundus camera is that the imaging light and the corresponding reflectance of the retina can pass
5 through the pupil in both directions, thus an image of the inside of the eye can be obtained. Images captured by fundus cameras depend on the optical angle of acceptance of the lens. The normal angle of view is 30° which results in an image magnification of approximately 2.5 times. For wider optical angles between 45°-140° the magnification is less [22]. Traditionally, fundus cameras were used for mydriatic photography, so-called because the patient’s pupil needs to be dilated using mydriatic eye drops before the retina is photographed. But recently, non-mydriatic fundus cameras have been developed. These cameras enable high quality images to be obtained and are particularly useful for imaging some diabetic patients whose pupils cannot be fully dilated using mydriatic eye drops.
Two modalities of fundus photography denoted colour and grey modes (also known as red free) are available. Conventional, red-free fundus photography uses 35 mm film which is subject to special colour filter operations to improve contrast between vessels and other structures. Recently, superior digital images can be obtained using a charge-coupled device (CCD) as the imaging sensor. Colour fundus photography senses three channels; red, green and blue (R G B) of reflected light which are determined by the spectral sensitivity of the sensor [9]. Figure 1.2 (a) illustrates a red-free fundus image of a normal left eye, (b) is an example of a colour fundus image of the right eye obtained from a healthy 25-year old male volunteer.
Figure 1.2 Fundus photographs of normal eyes. (a) A red-free fundus image (left eye) [12]; (b) A colour fundus image (right eye) [11].
6
• Stereo fundus photography: stereo-imaging techniques use two or more images captured at different angles to generate depth information of the object’s surface, represented using 3-dimensional coordinates (x, y, z). The images can either be captured simultaneously using a specialised fundus camera, or can be collected sequentially by using a standard retinal fundus camera [13]. Stereo fundus imaging is particularly useful for diagnosing and monitoring the pathology of glaucoma (see section 1.2.4). Its clinical use has been guided by both the European Glaucoma Society and the American Academy of ophthalmology [14]. Figure 1.3 illustrates an example stereo fundus image. Both images (left and right) were captured at different angles simultaneously by NAVIS-Lite [15].
• Fluorescein angiography/Indocyanine green angiography: Fluorescein angiography is an important invention for examining vascular structures on the retina. The principle was first proposed by Maclean and Maumenee [16] and later developed by Novotny and Alvis [17]. The technique is based upon the characteristic of fluorescein which is capable of absorbing light in the blue wavelengths and emitting it in the green wavelengths. Initially, fluorescein dye is injected into vessels and this defuses into the surrounding tissue. Then a fundus camera equipped with excitation and barrier filters is used to capture an image that registers the amount of injected fluorescein dye remaining within the retinal blood flow. The excitation filter allows a blue light to be projected into the eye, thus a green light is emitted from fluorescein. The barrier filter (yellow) blocks any reflected blue light
7 but allows green light through. A range of different pathologies can be diagnosed by analysing a sequence of images captured during the fluorescein angiography procedure. Figure 1.4 illustrates a fluorescein angiogram image of a normal eye in which we can see that the contrast between vessel and background (other structures) is enhanced.
A similar technique known as Indocyanine green angiography uses indocyanine green dye (a tricarbocyanine dye) which is sensitive to infrared rays. Consequently the fundus camera is equipped with different filters.
The utilities of Fluorescein angiography/Indocyanine green angiography are common in recent clinical applications because they provide significantly functional information about the retinal circulation.
• Scanning laser ophthalmoscopy (SLO): SLO is a confocal optical system used to obtain a three-dimensional image having plane coordinates (x-axis, y-axis) that are vertical to the optic axis (the z-axis is along the optic axis). Unlike conventional photography, SLO uses a laser beam instead of a bright light to scan each point across the fundus, then the reflections of light at each point are captured on imaging plane (e.g. CCD) through a narrow aperture (a confocal pinhole). The confocal pinhole can minimize image blur and hence a more clearly defined image can be obtained [20]. Recently, Heidelberg Retinal tomography II (HRT II) [19] has been used in a clinical application for diagnosis and monitoring of glaucomatous optic neuropathy and retinal imaging [10]. Figure 1.5 (a)
8 presents an image of the optical nerve head on the retinal nerve fibre layer, obtained by HRT II. The latest version, the Heidelberg Retinal Tomograph III (Figure 1.5 b) is more compact [21], the software has been upgraded to address an issue within the previous application that required the clinician to manually identify the optic disc resulting in variability of disc outline. Moreover, it is capable of providing a glaucoma probability score (GPS) based on automatic analysis of three scans of the disc [21].
Many fundus imaging techniques have been designed and developed for screening the internal retina and much effort has been made to improve the accessibility of the equipment. This overcomes the issue that traditional fundus imaging needs to be operated by experienced ophthalmic photographers. The most common and straight forward solution for improving accessibility is the adoption of a digital sensor (e.g. a charge-coupled device (CCD)) to record reflected light instead of using the traditional film-based imaging plane. This trend has resulted in widespread use of digital fundus cameras for routine clinical applications in ophthalmology departments. Moreover, the adoption of digital fundus cameras is consistent with technologies such as the Picture Archiving and Communication Systems (PACS) [23] which provides an economical storage solution for effective management, convenient distribution and presentation of medical images and rapid image retrieval etc.
Figure 1.5 (a) Image at the retinal nerve fibre layer obtained by Heidelberg Retinal Tomogroph II (b) The Heidelberg Retinal Tomogroph III.
9 Although new techniques such as tomographic imaging methods (SLO) can provide more detailed and specific images, there is still a role for conventional fundus photography. The safety, cost-effectiveness and accessibility of the digital fundus camera, and the acceptance of fundus photography as the primary fundus imaging technique for various ophthalmologic applications, drives research in retinal image processing and analysis .
1.2.3
Landmarks of fundus photography
Fundus photography (producing fundus images) has been employed in routine clinical therapy for a very long time. Many ophthalmological departments of hospitals in the UK are equipped with fundus cameras. Due to its relatively low cost, clinical diagnosis via fundus image analysis is still the most prevalent way to detect ophthalmic disease or assess some systemic diseases (these diseases are further described in section 1.2.4). The potential utilities of CAD offer an ability to analyse large numbers of fundus images and report corresponding diagnoses automatically. Consequently, accurate diagnostic reporting depends on reliable techniques for landmark identification and investigation.
A fundus photograph contains several important elements which could be used in various clinical applications. Primarily, these elements include the macula, optic disc (OD) also known as the optic nerve head (ONH), vessels and background structures.
Figure 1.6 illustrates an example retinal image used in a routine ophthalmic application. The image is captured from the left eye. The left bright circle is the optic disc and its cross-sectional view is illustrated in figure 1.1. It’s generally called the physiological blind spot because it allows optic nerves to pass though and transfers the signal to the brain. This component is extremely important in clinical applications involving the diagnosis of glaucoma. The dark area located near the centre of the image is the macula which aggregates visual pigments. Much research focuses on detecting its pathology (e.g. macular degeneration) as this influences vision. The vascular system of the eye which supplies blood to the retina includes invisible parts (e.g. choroid) and visible vessels which lie on the surface of retina.
Normally, retinal blood vessels emerge from the ONH and radiate over the interior surface of the retina in various directions. Their specific characteristics can be described as follows.
10 Anatomically speaking, the retinal blood vessel trees can split into different types: arteries, veins, arterioles, venules and capillaries, which are characterized by their diameters. Usually the arteries and veins are characterised by larger calibres and the arterioles and veinules are smaller. In fact, the arterioles and venules are of equal width during childhood. However, for an adult, the calibre of the arterioles is narrower but diameters of venules are enlarged, because of fibrosis of tissue caused by the physical pulse of the circulation system [24]. The capillaries are the small branches at the end of the vessel tree. Some of them just appear as 2-4 pixels wide in a retinal image. Many diseases can cause pathological changes of these vascular structures and this in turn influences their visual appearance. For example, hypertension results in leakage of the vascular blood also known as haemorrhage due to rising blood pressure. The leakage of plasma and blood that permeates the surface of the retina will influence visual function. Retinopathy, such as venous changes, (e.g. distortion and dilatation of the retinal vein) and breaks in capillaries can be found in diabetics. The pathological changes in capillaries may result in leakage which may extend to the fovea area leading to loss of vision. In section 1.2.4 we will describe specific diseases which can be analysed and studied using retinal images. In many clinical cases, it is extremely important and significant to isolate and study retinal blood vessels for diagnosis and treatment of related diseases.
There are several specific characteristics that can be used in retinal vessel studies. However, some of them may hinder distinguishing the vessels from other organs.
Figure 1.6 An example retinal image (fundus photography) showing anatomic structures.
Optic Disc
Macula Vessels
11
• The vessels are treelike and tubular structures. Each structure is supposed to be connected.
• Vessels appear in low contrast against the background. The appearance of blood vessels is dimmer than the background in colour fundus photography. The colour of vessels normally is dark red, and the background is close to orange. In a grey level image, their appearance is close to the other elements in the background (e.g. the macula). The appearance of capillaries may be very similar to that of the background.
• Because of the illumination, the vessels may contain specular effects located on the centre of vessel objects.
• In grey level images, the grey level of vessels is continuous and does not change abruptly.
• The vessel is a piecewise linear shape. The curve of the outline is relatively smooth without abrupt changes of orientation.
• Vessels are not all the same size. The width of a vessel covers a wide range of diameters and they can be extended along their length at any orientations.
• Vessel cross-sectional intensity profile approximates a Gaussian shape [85].
• Some specific shapes may characterise specific vessel pathologies. For instance, nipping of the arteriovenous crossing [24] may be presented in a fundus image of a hypertensive patient and spot shapes (microaneurysms) [25] may be found around the vessels in a diabetic patient’s fundus image.
1.2.4
Review of common diseases using analysis of retinal fundus images
Because many pathological abnormities in the retina manifest some systemic diseases and some ophthalmic diseases are caused by pathologies of the retina, the diagnosis of disease, either systemic or ophthalmic, based upon observing and documenting changes of eye tissues in fundus images has become particularly prevalent. In order to further discuss the important utilization of fundus images in clinical application, we summarise the most common diseases which have been studied based on the analysis of fundus images. The following provides a brief overview.
12
• GLAUCOMA
Glaucoma is a significant disease that leads to 12% of overall blind registrations in the UK, it’s been diagnosed particularly in the elderly, i.e. those in the 65 plus age group. Studies have reported glaucoma to be a common problem affecting 0.5% of the total population including 1% in the over 45s and 6.6% in the over 75s [25]. Glaucoma is the third leading cause of blindness in the U.S. [26]. It is a primary optic neuropathy that manifests the loss of nerve fibres which may associate with raised intraocular pressure. Visually, the hallmark of this optic neuropathy is a characteristic change in the optic nerve head known as cupping of the optic disc (Figure 1.7). The pressure on the nerve head may reduce the blood supply to the rim. As a result the axons of the retina may be damaged. This process will appear as an enlargement of the central cup or as defects of the nerve fibre layer in the focal area.
In routine practice, there are three characteristic measurements that can be tested for diagnosis of glaucoma. Firstly, raised intraocular pressure (IOP); Secondly, a characteristic pattern of visual field loss and thirdly pathological changes (cupping) of the optic nerve head [27]. The accurate diagnosis of glaucoma depends on taking all these inter-related features into account, as raised IOP alone may give false positives and testing of the visual field is time-consuming and requires specific equipment [25]. Accurate assessment of cupping of the ONH depends on accurate analysis of the optic disc [28]. The use of fundus images for analysis of the optic disc has been employed to detect early cases of the glaucoma before deterioration of the visual field develops using characteristic features of the disc and signs of vascular changes.
OD Rim
Cup
13 An important indicator for assessing the cup is the cup/disc ratio which is measured by judging the cup’s vertical height against the vertical height of the optic disc. In normal eyes the cup/disc ratio is generally below 0.5 except in some special cases that represent congenitally enlarged disc with a large cup. Difference in the cup/disc ratio between both eyes of 0.2 or more is a risk indicator for glaucoma. Moreover, a vertical cup/disc ratio larger than the horizontal ratio combined with an OD that does not have an increased vertical diameter is a sign of neural rim damage. Besides assessing the pathological changes of the OD, a fundus image based glaucoma analysis procedure, needs to assess the vascular changes around the OD, so that the progression of glaucoma can be recorded and measured. For example, evidence of vascular haemorrhage on or around the optical disc is a common clinical sign in patients with progressive glaucoma. In advanced glaucoma, other morphological features of vessels may be detected, such as a narrowing in the appearance of the retinal arterioles. Abnormal distortion of vascular shape (e.g. the appearance of so-called z bend also known as bayoneting) may signify local erosion of the neural rim [28].
• Age-related macular degeneration (AMD)
Age-related macular degeneration (AMD) is a common eye disease that causes irreversible vision loss (such as blurred vision or slight distortion) in adults older than 50 years of age. In AMD, the macula (see Figure 1.6) degenerates with age and this results in vision blur or more severely loss of central vision. According to an NHS report, up to 500,000 people are affected by some form of AMD in the UK [30]. It is also reported to be the most common optical disease causing visual loss in the U.S. Approximately 7,300,000 Americans have some form of AMD [31]. Patients with AMD suffer no pain in the early stages of the disease, hence it is difficult for patients to perceive symptoms until they get the blurred vision or loss of central vision, (i.e. they cannot see objects in front of them clearly) [29]. Normally, AMD is classified as being one of two forms: early stage AMD- Dry macular degeneration (DMD) and advanced stage-Wet macular degeneration (WMD). DMD usually manifests itself by the appearance of drusens (small yellowish-white blobs), which are the deposits of epithelial cell waste located beneath the retina. WMD also known as choroidal neovascularization is indicative of abnormal growth of the choroidal vascular structure into or around the macula. These new vessels are weak and easily bleed [32]. Drusen are present in both forms of AMD and are classified as two types, hard and soft (Figure.1.8). Hard drusen (Figure.1.8-a) are characterised by a clear boundary that can be easily defined. Hard drusen are generally less
14 harmful than soft drusen (Figure.1.8 -b). These present a fuzzy boundary, which may be accompanied by other abnormalities such as new growth of the vascular structure.
The dursen can be gradually formed into any shape, size and number during the development of AMD, hence identification of dursen’s characteristics are used by ophthalmologists to assess the progress of AMD so patients can receive appropriate treatment without delay. It is extremely significant to detect hard drusen in the early stage of AMD so that one is able to stabilize the pathogenic condition.
Currently, routine clinical identification and evaluation of drusen is implemented with the aid of fundus colour images which provide important signs for diagnosis. Many efforts in computer-assisted analysis of AMD have been made to achieve large population-based diagnoses of patients. In particular those studies which concern automated drusen detection and assessment based upon fundus images have been reported in much of the literature [34][35][36][37][38][39].
• Vascular disorders
The blood supply of the retina is through the choroid and retinal vessels which lie on the top of the retina. The retinal vessel is the only visible part of the blood circulation system. Observing the changes of the vascular characteristics can give information about the health of vessels, moreover pathological features of retinal vessels can manifest the risk of cardiovascular disease, such as hypertension, atherosclerosis and retinal vein/artery occlusion.
Figure 1.8 Two forms of age-related macular degeneration (AMD). The bright spots in (a) are hard drusen; (b) is wet AMD with soft drusen.
Hard Drusen Macula
(a)
Soft Drusen
15
Vascular disorders can affect the eye by various forms, for instance, new vessel formation in the OD and the macular, and acute ischemia, which cause cotton wool spots and the appearance of flame haemorrhage on the surface of the retina, etc. [24]. Some features that appear in fundus images of hypertensive patients can reflect the seriousness of hypertension thereby indicating whether the patient demands immediate treatment. In the early stage, the nipping or nicking of the arteriovenous crossing (crossing points of arteries and veins) is defined as early evidence of hypertension (Figure 1.9-b), whilst the appearance of scattered flame haemorrhages (Figure.1.9-c) is a classic indication of hypertension [24][25][41]. The narrowing of the arteries and the dilation of veins are symptomatic of patients at risk of subsequent development of hypertension [40]. Figure 1.9-a illustrates the appearance of mild narrowing and sclerosis of retinal arteries resulting in a decreased overall A/V ratio [42]. In practice, a decreased ratio between diameters of arteries to those of veins also known as the A/V ratio is used to assess the risk of hypertension. For those patients who have hypertension, the appearance of pale cotton-wool spots (Figure1.9-d) in the fundus image suggests urgent treatment is needed [25][41][42].
Retinal vein or arterial occlusion is a complication associated with hypertension or diabetes. The former is more common, however occlusion of retinal arteries is more severe as it is irretrievable. In a pathological fundus image, signs of retinal vein occlusion are characterised by dilated and tortuous veins, which may be accompanied by massive Figure 1.9 Manifestations of hypertensive retinopathy in fundus images. (a) A decrease A/V ratio; (b) nipping characteristic; (c) example of flame haemorrhages; (d) pale cotton-wool spots [42]. Nipping Hemorrhage s (b) (c) Cotton-wool spots (d)
16 haemorrhage. The range of these haemorrhages depends on the type of retinal venous occlusion, which is classified as either central or branch. The central retinal vein occlusion presents global haemorrhages, whilst the haemorrhages of branch retinal venous occlusion occur in the local area of the fundus image. Retinal arterial occlusion is characterised by the appearance of pale embolus around the area at the artery branch. Patients suffering from this condition are at risk of a retinal stroke which may block the blood flow to the retina and therefore result in retinal death.
• DIABETIC RETINOPATHY
Currently, the diagnostic criteria for diabetes is defined by the world health organization (WHO) to be a patient who has a fasting level of plasma glucose ≥ 7.0mmol/l (126mg/dl) or 2–hour plasma glucose ≥ 11.1mmol/l (200mg/dl) [43]. Approximately 171 million people in the world were diagnosed with diabetes in the year 2000. This number is estimated to increase in the next decades, and is predicted to increase to 366 million by 2030 [44]. Approximately 3.5% of the UK population are affected by diabetes [10] and the U.S. Department of health and human services (DHHS) reported that 9% of adults (aged 18 and over) had been diagnosed with diabetes [45]. Diabetes manifests as a rise in blood glucose which many cause damage to vascular walls. Consequently, it results in diabetic complications known as diabetic retinopathy which may cause loss of vision. Diabetic retinopathy is the leading causes of blindness or visual loss within the working age group [46]. According to a clinical study report [47], in England and Wales, approximately 7.6% of patients who registered as vision impaired during year 1999-2000 are affected by diabetic retinopathy, resulting in 6.3% blindness for this patient group. A report presented by ‘prevent blindness America’ [48], indicates that diabetic retinopathy affects approximately 7.7 million U.S. people aged 40 and older in 2010. Routine screening for diabetic retinopathy and early detection of sight-threatening changes can be used in early diagnosis. A laser treatment called photocoagulation, can be prescribed to prevent the consequent loss of vision [25][49][50][51].
The prevalent forms of diabetic retinopathy can be typed as mild or severe depending on whether the pathological abnormalities are associated with damage to the macula or fovea. It can also be classified as non-proliferative retinopathy or proliferative retinopathy by considering how the abnormalities and pathological changes present new growth of tissue (vessels). The progress or deterioration of diabetic retinopathy is a gradual procedure. Normally, background retinopathy (Figure 1.10-a) can be detected at an early stage of
17 diabetes and it is less harmful. It is characterised by the appearance of microaneurysms, scattered haemorrhages and retinal exudates. Microaneurysms are a specific sign of diabetes and manifest themselves as small red dots, occurring in areas around the macula. The haemorrhages are caused by leakage within small weak vessels (capillaries) that can be observed from retinal fundus images as flame blots. In early stages of retinopathy, these haemorrhages normally appear as a few isolated components, distant from macula or fovea rather than the mass of haemorrhages indicative of severe retinopathy (Figure 1.10-c). The leakage of fat and protein from weak vessels may form yellow white blots in the retina called retinal exudates or hard exudates (Figure 1.10-a). They are characterised by a clear identified boundary, appearing as brighter blots than background, but these do not affect the macula or fovea. However, in some severe cases of retinopathy (diabetic maculopathy), normally occurring in type II diabetes, there are increased numbers of exudates with an enlarged size, spreading towards macula or in some cases even aggregated on the macula Figure.1.10-b ( so-called macular exudate). Consequently these pathological changes may be accompanied by macular oedema, which has been reported as the most common cause of virtual loss in diabetics [9][25].
Retinal ischemia is an important factor causing severe diabetic retinopathy. Characteristic features such as a mass of haemorrhages, venous tortuosity and dilatation, cotton-wool spots, intra-retinal microvascular abnormality (IRMA), and proliferation can be detected in such fundus images. The size and number of these haemorrhages rapidly increase. The veins are dilated and tortuous because of hypoxia. The cotton-wool spots appear as white patches, fluffy in density with a fuzzy boundary on the retinal nerve fibre layer. This results from accumulations of swelling axon terminals which are caused by stimulation of retinal ischemia [52]. IRMA is characterised by abnormalities of capillaries (dilation and tortuosity).
One or more of these features appearing in a fundus image indicates that retinopathy has deteriorated into the pre-proliferative stage (Figure 1.10-c). This also signifies that the proliferation of IRMA is more likely [24]. However, early detection and treatment in this stage can prevent the further deterioration to the proliferative retinopathy stage (Figure 1.10-d). Although this is not common it is very severe and results in blindness. The characteristics of proliferative retinopathy are the appearance of new growth of blood vessels on the retina or OD. Because of severe hypoxia, the new vessels seek other sources of oxygen by growing in any direction and this may lead to vessel growth on the OD and the area between the lens
18 and vitreous body. Consequently, this may result in vitreous hemorrhage when blood and other liquids contaminate the vitreous body. This pathological change may even progress and in severe cases may detach the retina. Therefore, it’s very important to give laser treatment before vitreous hemorrhage occurs to prevent blindness.
1.3
Automated detection of retinal disease using fundus images
A traditional but prevalent way of retinal disease diagnosis is manual screening and reviewing the images by ophthalmologists in routine clinical diagnosis. However, with the popularized utilities of new optical examination techniques and equipment, an abundance of images have been generated to assist the diagnosis. The quantity of images already exceeds the limit of the clinicians’ ability to fully utilize it. Not only because manual diagnosis is a time-consuming procedure and the huge number of patients’ demand prompt diagnosis by a Figure 1.10 Different stages of diabetic retinopathy in (a) background retinopathy; (b) macular exudates; (c) pre-proliferative retinopathy and (d) proliferative retinopathy.
(a) (b)
(c) (d)
Microaneurysms
Exudate
Macula Exudate Macula
Haemorrhages
Cotton-wool spots
19 limited number of ophthalmologists before they can receive appropriate treatment. But also the manual diagnosis is experience dependent and high quality clinical detection relies on rich experience. For example, in some cases, changes in the pathology (e.g. the new growth of tinny vessels or microaneurysms in proliferative retinopathy) are difficult to observe and distinguish and therefore decisions are prone to inter and intra-observer variability. This in turn may result in patients missing the best time for treatment. An effective scheme to achieve population-based diagnosis relies on developing automated screening tools or computer-assisted diagnostic (CAD) systems that employ modern advanced computing techniques (image processing and analysis, computer vision techniques, distributed computing etc.). In the past few decades, numerous steps have been undertaken to achieve more accurate automated diagnosis using digital fundus images. A brief review of the latest techniques and their relevance to the specific diseases described in section 1.2.4 is summarized in the following sub-sections.
1.3.1
Automated detection of Glaucoma
Automated classifications of normal or glaucomatous patients need to rely on evaluating the features extracted from the patients’ fundus image. In routine clinical glaucoma detection, such features may include cupping of the ONH, nerve fibre layer defects, and peripapillary atrophy etc.. Among those features, cupping of the ONH is the most important sign of glaucoma. As we described in section 1.2.4, the pathological changes of Glaucoma in the optic nerve head (ONH) area which can be observed from a retinal fundus image are primary indicators but they are not limited to this area. Numerous methods have been proposed to automatically detect and combine one or more of these abnormities in the optic disc followed by analysis to determine if they belong to corresponding progressive stages of the disease using a diagnostic criterion (e.g. C/D ratio etc.). Under normal circumstances, to calculate this ratio, the optic nerve head and optic cup need to be detected and extracted. In [55], Nayak et al. proposed an automated glaucoma detection method which employs three features: the C/D ratio, the distance between optic disc centre and the ONH, and the ratio of the total area of the blood vessels in the inferior and superior side of the ONH to the total area of the blood vessels in the nasal and temporal area. Morphological closing and opening operations followed by a thresholding method are adopted for segmentation of the ONH. Vascular tree segmentation is implemented using bottom-hat filtering combined with thresholding. Finally, classification is performed by an artificial neural network (ANN)
20 classifier. In another article [56], the displacements of blood vessels within the OD are measured. The distances between centroids of the vessels in the superior, inferior and nasal areas to a reference point in the temporal side of the retina is proposed to distinguish normal or glaucomatous subjects. The performance of this method achieved 93.02% sensitivity, 91.66% specificity, and 91.34% accuracy. Further state-of-the-art methods for automated extraction of anatomical features from retinal images for early diagnosis of glaucoma are presented in the survey [57]. Bock et al. [53] proposed a system for automated glaucoma detection using colour retinal fundus images and achieved 80% accuracy. Pre-processing is implemented to address inhomogeneity in the illumination. Vessels localized on the ONH are removed by applying retinal vessel segmentation followed by inpainting of the detected vessel tree. Then three features are generated by different generic image representations, which are used to generate a glaucoma risk index (GRI). Finally, a stand-alone SVM classification scheme combines the GRI to generate a diagnosis. Noronha et al. [54] proposed an automated glaucoma diagnosis system that classified three states of glaucoma (normal, mild and severe) using a support vector machine (SVM) and Naive Bayesian (NB) classifiers based on features derived from higher order spectra (HOS) cumulants extracted from a radon transform of the digital fundus images. The performance of their system reaches 92.65% accuracy.
1.3.2
Automated detection of AMD
Age-related macular degeneration (AMD) is the most common cause of gradual loss of vision in the aged 50 and over group in the UK and U.S.. The critical risk of AMD is that it can’t be perceived until vision is impaired. Early detection of AMD may reduce this risk and laser treatments can be used to stop progression of the disease. Five computer-assisted diagnostic systems for detecting and manually grading AMD which have been used in clinical applications are summarized by Zarbin and Chu [58]. These systems have potential to be improved by replacing the manual grading stage with an automatic grading module, thereby allowing the system to meet the demands of an enormous number of patients. During recent years, many efforts have been devoted to studying automated diagnosis of AMD using different features extracted from components in digital colour fundus images of the retina. The methods initially detect abnormalities in retinal fundus image then classify cases as normal or AMD via quantification of those features. Many modern digital image processing and analysis techniques can be employed, e.g. image compression, image enhancement and
21 image segmentation etc. The most important part of the process is the automated segmentation of drusen, as they are the characteristic sign of AMD.
To some extent, the performance of a system for automated diagnosis of AMD relies on adopting a successful method of segmentation. Bhuiyan et al. [59] proposed a method for the detection and quantification of drusen for early detection of AMD. Initially, a vessel tree and background mask is generated to exclude the vessels and background related interference. Then drusen are detected using the combined local intensity distribution and adaptive intensity threholding. A first order Gaussian derivative filter is employed which works with the mask to generate a magnitude image without vessel and background pixels. This is used to identify edge information of drusen. The severity of early AMD is evaluated by quantifying the drusen occurring in the area of the macula. Their proposed method achieved 100% accuracy of drusen detection in 50 images collected by them. Rapantzikos et al. [60] employed multilevel histogram equalization (MLE) based on sequential applications of histogram equalization to enhance image contrast followed by histogram-based adaptive local thresholding (HALT) for detection of drusen. The advantage of utilizing HALT is that it is capable of extracting features of interest without influencing other components [60] (e.g. haemorrhage, vessel and optical disc). The method presented in paper [61] focuses on automated detection of advanced AMD by detection of the wet drusen and patches indicative of haemorrhage. Three regions of interest: (blood vessels trees and haemorrhages, OD and macula, background) are segmented using the k-means clustering algorithm, of which haemorrhages and drusen are related to the first and second regions. The vascular trees are removed by implementing erosion and dilation using cellular neural network (CNN) templates. Boundaries corresponding to regions of interest (ROI) are found using a Sobel operator and these are used for monitoring the progression of the condition.
![Figure 1.1 Cross sectional illustration of eye structures.[4]](https://thumb-us.123doks.com/thumbv2/123dok_us/1293936.2673449/19.892.218.678.503.748/figure-cross-sectional-illustration-eye-structures.webp)
![Figure 1.3 Stereo Optic Nerve Head (ONH) image [15]](https://thumb-us.123doks.com/thumbv2/123dok_us/1293936.2673449/22.892.211.713.437.763/figure-stereo-optic-nerve-head-onh-image.webp)
![Figure 1.7 A fundus image of glaucoma patient. Diagnostic: focal nerve fibre loss.[27]](https://thumb-us.123doks.com/thumbv2/123dok_us/1293936.2673449/28.892.230.651.807.1060/figure-fundus-image-glaucoma-patient-diagnostic-focal-nerve.webp)