Experimentally and Numerical Study on Deep Drawing Process
for Magnesium Alloy Sheet at Elevated Temperatures
D. V. Hai
*1,*2, S. Itoh
*1, T. Sakai
*1, S. Kamado and Y. Kojima
Department of Mechanical Engineering, Nagaoka University of Technology, Nagaoka 940-2188, Japan
Recently, magnesium alloys have been considered as a promising alternative for high-strength steel and aluminum in some applications because of its advantages such as low density, high specific strength etc. However, the application of formed magnesium wrought alloys components is restricted due to lack of knowledge for processing magnesium alloys at elevated temperatures. In this study, the deformation behavior of a cylindrical deep drawing of magnesium alloy sheets at elevated temperatures are simulated by using a non-isothermal finite element based on DEFORM 3D commercial software. In order to validate the finite element analysis, deep drawing test of cylindrical cup of AZ31 and AZ52 rolled sheets at given conditions was also performed. The experimental results show a good agreement with the finite element simulation predictions. The optimal forming temperature, thickness distribution of the cup and punch force were determined for the process. [doi:10.2320/matertrans.MC200761]
(Received October 5, 2007; Accepted December 13, 2007; Published February 14, 2008)
Keywords: magnesium alloy, sheet forming, rigid-viscoplasticity, finite element simulation
1. Introduction
Weight reduction has long been identified as a key priority for improving automotive fuel economy, and many studies often suggest substituting lightweight materials for typical steel applications. In recent years, magnesium alloys have been paid much attention due to its advantages such as low density, high specific strength etc. Therefore, magnesium alloys have been considered as a promising alternative for high-strength steel and aluminum in some applications and expected to be widely used for structural components, notably in the automotive and aerospace industry in the near future.1–3) The application of formed magnesium wrought alloys components, however, is restricted due to lack of knowledge for processing magnesium alloys, especially forming process, at elevated temperatures. Traditionally, forming processes are usually carried out in isothermal conditions. In other words, the processes are conducted under the conditions of constant and homogeneous temperatures of tools and workpiece. However, deep drawing tests with magnesium alloy sheets show that the drawability of sheets can be improved by local heating based on the change of material property with respect to temperatures.4–6) This means the process is ultimately non-isothermal. Moreover, during the forming process, heat is generated by plastic deformation and the heat loss by conduction and by radiation and convection to the punch as well as to the environment can result in several property changes of the workpiece. There-fore, this underscores the need for accurate methods to investigate a forming process of magnesium alloy not only deformation behavior but also heat transfer process, a task to which the finite element method is well suited.
In this study, a thermo-rigid-viscoplastic FEM, based on DEFORMÔ3D codes, with anisotropic Hill’s non-quadratic yield criterion is applied to analyze the warm deep drawing of AZ31 and AZ52 rolled sheets. The load-stroke curves, optimal process parameters and temperature distribution in
the sheets obtained in the FE simulation were compared with experimental results for various forming conditions.
2. Experimental Procedure
The magnesium alloys used in this study are AZ31 and AZ52 rolled sheets with a thickness of 0.83 mm. The chemical composition and microstructure images of the sheets are shown in Table 1 and Fig. 1, respectively.
2.1 Mechanical properties tests
In order to investigate the effect of temperature, rolling direction and strain rate sensitivity of the magnesium alloy sheets on flow stress as well as determine the constitutive behavior of the sheets, uniaxial tensile tests at different strain rates, rolling direction and temperatures were carried out. The results are shown in Figs. 2 and 3. Besides, the Rankford value, r, was also calculated to examine the anisotropic property of the sheet for a strain of 20% in tensile tests. It shows that the sheets exhibit anisotropic property markedly. However, the property trends to be decreased constantly with increasing temperature and approaching isotropic property at the temperature over 498 K. The Table 2 shows the r-values as well as parameters of mechanical property of sheets obtained from tensile test at 498 K and strain rate of103s1.
2.2 Cylindrical Cup Deep drawing test
[image:1.595.303.549.742.783.2]Cylindrical cup deep drawing tests were carried out at various conditions to investigate the formability of the sheets as well as validate simulation result. As mentioned previ-ously, the formability of magnesium alloy sheets can be improved by local heating at elevated temperatures. Hence, testing dies with heating control system is designed. The experiments were conducted with a punch diameter of
Table 1 Chemical composition of the specimens (mass%).
Material Al Zn Mn Fe Cu Ni Mg
AZ31 3.0 1.0 0.16 0.02 0.01 0.001 Bla.
AZ52 4.5 1.5 0.14 0.02 <0:01 <0:001 Bla.
*1Graduate Student, Nagaoka University of Technology
*2Corresponding author, E-mail: [email protected]
40 mm, punch radius of 4 mm, die parameter of 42 mm and die shoulder radius of 4 mm. The blank holder force was kept constant at 14 kN and the punch speed was 3 mm/s. The tests were carried out at temperatures of tooling (die and blank holder) ranging from 423 to 523 K while the temperature of punch was set at 298 K. Teflon sheets were used as lubricant. The temperature was monitored using several thermocouples, and this system was connected to a computer for controlling temperature and recording the data during the forming process.
3. FE model
In this study, FE simulation of the magnesium alloy sheets
warm forming process was performed using an implicit FE code DEFORM 3D, a commercial FE program based process simulation system designed to analyze three-dimensional flow of various metal-forming processes, which can be used for non-isothermal simulation. Due to the symmetric boun-dary conditions, and to reduce computational time, a quarter of the geometries were modeled as shown in Fig. 4. The sheets and tooling were meshed with four-noded tetrahedral elements. However, the tooling was modeled as perfectly rigid but non-isothermal while the blank was considered as rigid- viscoplasticity with isotropic hardening law and following Hill’s anisotropic yield criterion. The Hill’s function6)can be expressed as:
fðÞ ¼
ffiffiffiffiffiffiffiffiffiffiffiffiffiffiffiffiffiffiffiffiffiffiffiffiffiffiffiffiffiffiffiffiffiffiffiffiffiffiffiffiffiffiffiffiffiffiffiffiffiffiffiffiffiffiffiffiffiffiffiffiffiffiffiffiffiffiffiffiffiffiffiffiffiffiffiffiffiffiffiffiffiffiffiffiffiffiffiffiffiffiffiffiffiffiffiffiffiffiffiffiffiffiffiffiffiffiffiffiffiffiffiffiffiffiffiffiffiffiffiffiffiffiffiffiffiffiffiffiffiffiffiffiffiffiffiffiffiffiffiffiffiffiffiffiffiffi
Fð2233Þ2þGð3311Þ2þHð1122Þ2þ2L232 þ2M 2 31þ2N
2 12 q
ð1Þ
3.5
µ
m
2.9
µ
m
(a)
(b)
Fig. 1 Typical microstructure of AZ31 and AZ52 rolled sheet, respectively.
T=423K
T=448K
T=498K AZ31 AZ52
[image:2.595.68.525.74.238.2]Fig. 2 Effect of temperatures on tensile true stress-strain curves of AZ31 and AZ52 at""_¼103s1.
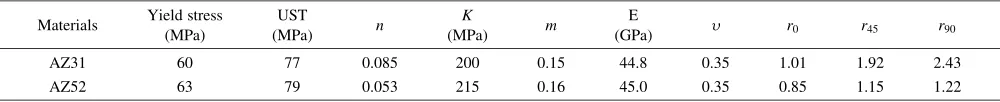
Table 2 Mechanical properties and r-values of the magnesium alloy sheets at 498 K.
Materials Yield stress
(MPa)
UST
(MPa) n
K
(MPa) m
E
(GPa) r0 r45 r90
AZ31 60 77 0.085 200 0.15 44.8 0.35 1.01 1.92 2.43
AZ52 63 79 0.053 215 0.16 45.0 0.35 0.85 1.15 1.22
1 1
s 10− − =
ε
1 2
s 10− − =
ε
1 3
s 10− − =
ε
.
.
.
[image:2.595.61.282.278.425.2] [image:2.595.320.531.279.427.2] [image:2.595.48.548.497.548.2]whereij denote the stress components and F, G, H, L, M and N are material constants obtained by tests of the material in different directions. These constants can be expressed in terms of six yield stress ratios R11,R22, R33, R12, R13 andR23 according to
F¼1
2 1 R2 22 þ 1 R2 33 1 R2 11
; G¼1
2 1 R2 11 þ 1 R2 33 1 R2 22
; H¼1
2 1 R2 11 þ 1 R2 22 1 R2 33 ;
L¼ 3
2R2 23
; M¼ 3
2R2 13
; N¼ 3
2R2 12
ð2Þ
In sheet metal forming application, anisotropic material data is commonly used in term of ratios of width strain to thickness strain. The stress ratios can then be defined as
R11 ¼R13¼R23 ¼1; R22 ¼
ffiffiffiffiffiffiffiffiffiffiffiffiffiffiffiffiffiffiffiffiffiffi
r90ðr0þ1Þ
r0ðr90þ1Þ s
; R33¼
ffiffiffiffiffiffiffiffiffiffiffiffiffiffiffiffiffiffiffiffiffiffi
r90ðr0þ1Þ
r0þr90 s
; R12¼
ffiffiffiffiffiffiffiffiffiffiffiffiffiffiffiffiffiffiffiffiffiffiffiffiffiffiffiffiffiffiffiffiffiffiffiffiffiffiffi 3r90ðr0þ1Þ
ð2r45þ1Þðr0þr90Þ s
wherer0,r45 andr90 are the anisotropy coefficient obtained from uniaxial tensile tests in different directions of the sheet, as shown in Table 2.
The flow stress of the sheets obeys the Tabular data format given as a function of strain rate, strain and temperature¼
ð""; """";_ TÞwithis flow stress,"",""""_andTare effective plastic strain, effective strain rate and temperature, respectively. This law was selected due to its ability to follow the true behavior of a material. Contact between the sheet and tooling was modeled by means of master-slave penalty force algorithm. The penalty value was kept large enough to minimize penetrations during the simulation. The friction coefficient in Coulomb’s friction law was chosen for contact surface and kept to be constant at 0.1 in the analysis of forming operations. Automatic meshing was performed after 10 steps of increment regularly. The parameters for simulations are shown in Table 3.
4. Results and Discussion
The results of simulation and experiment show that the
limiting drawing ratio (LDR) of both investigated materials increase with increasing in temperature and obtaining maximum value at 225C. The following are some of the
results.
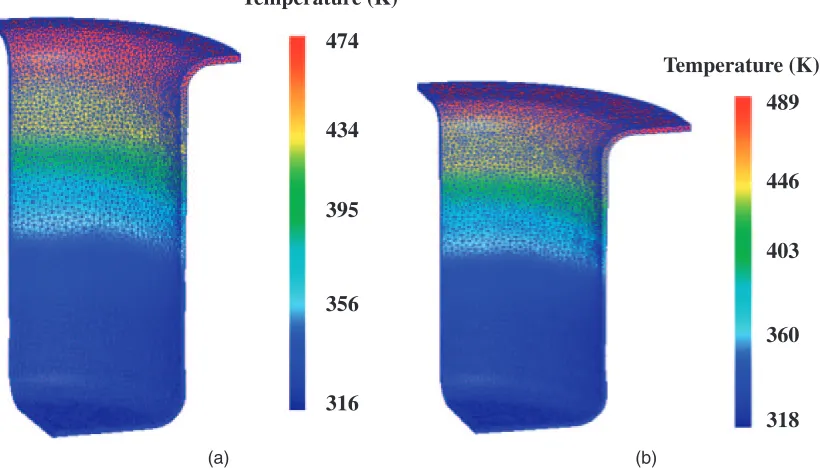
4.1 Temperature distribution
[image:3.595.50.286.517.785.2]Figure 5 shows the numerical predicted temperature distribution along the cup wall during forming of AZ31 (LDR¼3:0) and AZ52 (LDR¼2:8) at 498 K, respectively. During forming, as the punch moved into the die cavity and contacted the blank, parts of the blank contacting the punch lost some of their heat to the punch, resulting in minimal temperature of the blank at punch shoulder radius and increased temperatures towards the die shoulder radius. This is due to the significant difference of punch and blank temperatures as well as the high thermal conductivity and low specific heat capacity of magnesium alloy. Low temper-ature in the wall caused increase in the flow stress. This can result in avoiding localized necking. Otherwise, high temper-ature in the flange results in the flange part drawing with lower drawing force.4,5) This re-affirms that control of temperature distribution in the wall and the flange plays a
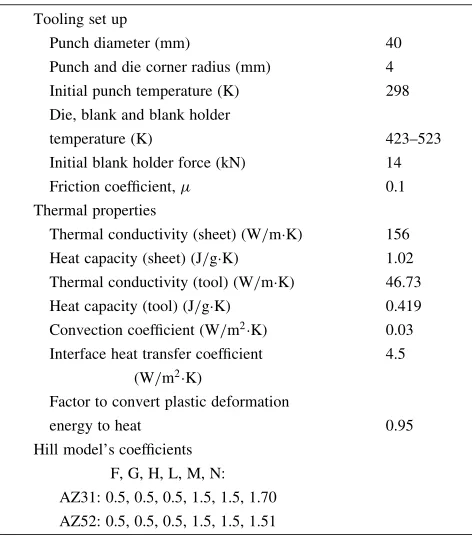
Table 3 Process parameters used in simulation.
Tooling set up
Punch diameter (mm) 40
Punch and die corner radius (mm) 4
Initial punch temperature (K) 298
Die, blank and blank holder
temperature (K) 423–523
Initial blank holder force (kN) 14
Friction coefficient, 0.1
Thermal properties
Thermal conductivity (sheet) (W/mK) 156
Heat capacity (sheet) (J/gK) 1.02
Thermal conductivity (tool) (W/mK) 46.73
Heat capacity (tool) (J/gK) 0.419
Convection coefficient (W/m2K) 0.03
Interface heat transfer coefficient 4.5
(W/m2K)
Factor to convert plastic deformation
energy to heat 0.95
Hill model’s coefficients F, G, H, L, M, N: AZ31: 0.5, 0.5, 0.5, 1.5, 1.5, 1.70 AZ52: 0.5, 0.5, 0.5, 1.5, 1.5, 1.51
Blank holder
Blank
Punch
Die
[image:3.595.321.525.524.767.2]critical role in a successful warm deep drawing process for magnesium alloy sheets. The maximum deep-drawn cups of AZ31 and AZ52 obtained from experiment at the same conditions as simulation processes are shown in Fig. 6.
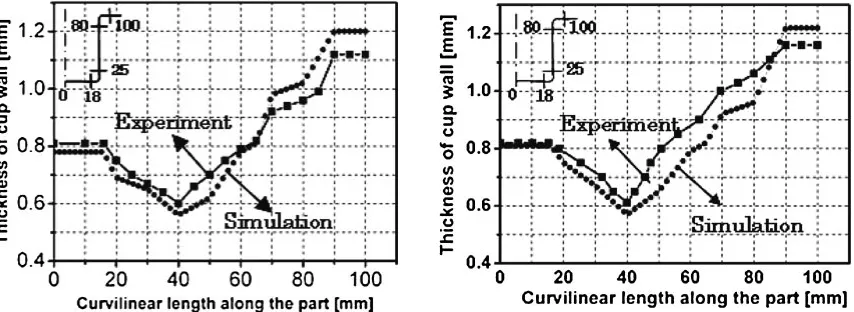
4.2 Thickness distribution
Figure 7 shows the comparison of the numerical predicted and experimental results of AZ31 and AZ52 at forming temperature of 498 K for DR of 2.8, respectively. Both experimental and numerical strain distribution show the same basic feature. In other words, the trend of change in thickness predicted by simulation matches well with experiment results. However, a maximum thinning of 32% was observed in the simulation as compared to 27% in experiment. This might be due to Hill yield surface used in simulation for determining yielding of the material may overpredict the
yield stress in the flange where the radial stresses are tensile and hoop stresses are compressive. Another important finding was that the maximum thinning observed in the cup wall for both simulation and experiment is contrary to the conven-tional stamping where the maximum thinning is observed at punch radius. The difference of the localized thinning could be due to the strength of the cup wall in warm forming is not uniform as in conventional forming and depends on the temperature distribution in the wall during forming process. Low temperatures at punch shoulder radius and high temper-atures at the die shoulder radius resulted in low yield strength in the material at the cup wall as compared to the material at the punch corner. As a result, thinning in the cup walls is greater than at the punch corner. Furthermore, results of tensile test indicate that magnesium alloys are characterized by specific behaviors at elevated temperatures: as seen in
Temperature (K)
Temperature (K)
474
434
395
356
316
489
446
403
360
318
(a) (b)
Fig. 5 Temperature variation in the AZ31 (a) and AZ52 (b) sheets at 498 K predicted by the FEM.
[image:4.595.95.505.81.318.2] [image:4.595.105.493.349.565.2]Figs. 2 and 3, there is actually a softening effect after the initial hardening, because of recovery and/or recrystalliza-tion.7)In the experiments, the maximum LDRs of 3.2 and 2.8 were obtained at forming temperature of 498 K while the result of simulation achieved 3.0 and 2.8 for AZ31 and AZ52, respectively. Although the maximum LDRs predicted by simulation for different forming temperatures were less than those obtained from experiment, the location of localized thinning and the trend of failure obtained in the simulations matched well with fracture locations in experiments. Figure 8 shows the comparison between experiment and simulation result about the fracture of the drawn cup at forming temperature of 423 K and DR of 2.8. The facture was observed at around the punch corner, because the punch force is higher then limit strength of the material at given condition.
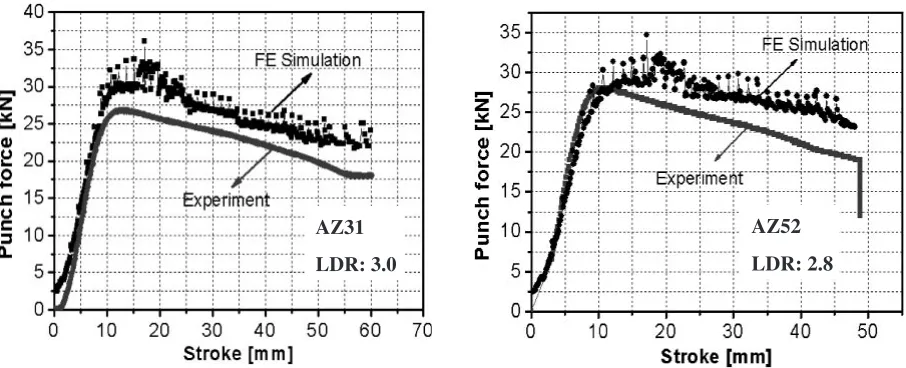
4.3 Punch force
Figure 9 shows the punch loads obtained from the simulations and experiments of forming AZ31 and AZ52 for LDR 3.0 and LDR 2.8, respectively. The results indicate that the maximum punch loads obtained by experiment are lower than those in the simulation. However, the tendency of increment and decrement of punch load during the forming process could be predicted by simulation.
This issue could be either due to high blank holder force that restrains the material flow and/or high shear stress due to
interface friction coefficient. It should also be noted that the flow stress available from tensile test was limited to high strain rates. Therefore, in the simulation the flow stress for high strain rates were extrapolated. These values have been probably overestimated. Thus, the punch load obtained in simulation was higher than the load obtained in experiment. This leads to more restraining force to draw the material from the flange had resulted in localized thinning of 32% in the simulation as mentioned previously.
5. Summary
The main conclusions of this study are as follows: (1) The LDRs of AZ31 and AZ52 increase with increasing in forming temperature and obtaining the maximum values at 498 K. However, the LDRs predicted by simulation were slightly lower compare to the experiment results.
(2) The punch force predicted by FE simulation overesti-mated the experiment results. This could be either due to high blank holder force and/or high shear stress caused by interface friction coefficient.
(3) The thinning distribution observed in simulation matches with experiment result.
(4) The thermo-viscoplasticity FEM code, particularly Deform3D code could successfully capture the deformation behavior and specific characteristics of the warm sheet forming process.
Fig. 7 The thickness distribution along the cup wall of AZ31 and AZ52 at forming temperature of 498 K for DR of 2.8.
[image:5.595.86.513.73.229.2] [image:5.595.80.517.266.429.2]REFERENCES
1) Y. Kojima: Mater. Trans.42(2001) 1154–1159.
2) B. L. Mordike and T. Robert: Mater. Sci. and Eng.A302(2002) 37–45. 3) E. Doege and K. Droder: J. Mater. Process. Technol.115(2001) 14–19. 4) S.Yoshihara, B. J. MacDonald, H. Nishimura, H. Yamamoto and K.
Manabe: J. Mater. Process. Technol.154(2004) 319–322.
5) F. Kaiser, D. Letzig, J. Bohlen, A. Styczynski, Ch. Hartig and K. U. Kainer: Mater. Sci. Forum419–422(2003) 315–320.
6) R. Hill: The Mechanical Theory of Plasticity, (Oxford University Express, New Castle 1950) pp. 108–113.
7) D. V. Hai, S. Itoh, S. Kamado and Y. Kojima: Adv. Mate. Res.11–12
(2006) 413–416.
AZ31
LDR: 3.0
AZ52
LDR: 2.8
[image:6.595.72.525.72.256.2]