http://www.scirp.org/journal/epe ISSN Online: 1947-3818
ISSN Print: 1949-243X
DOI: 10.4236/epe.2018.101002 Jan. 12, 2018 10 Energy and Power Engineering
A Generic Battery Model and Its
Parameter Identification
Datong Song*, Colin Sun, Qianpu Wang, Darren Jang
Energy, Ming and Environment Research Centre, National Research Council of Canada, Vancouver, Canada
Abstract
A new dynamic model is developed in this paper based on the generic MATLAB battery model. The battery capacity is expressed as a function of the self-discharge rate, the discharge current, the cycling life and the temperature of the battery. The dependence of the model parameters on cycle life and temperature are esti-mated from the first order approximation. The detailed procedures and for-mula to extract the model parameters are presented and the extraction relies only on the discharge curves at two different discharge currents, at two different life cycles, and at two different temperatures. These discharge curves are typi-cally provided in the battery manufacturer’s datasheet. The proposed model is verified for both nickel-metal hydride and lithium-ion batteries by comparing the calculated discharge curves with the results from the generic MATLAB model. The model is further validated for the Sinopoly lithium-ion battery (SP-LFP1000AHA) by comparing the model results with the discharge curves from the manufacturer’s datasheet at different discharge currents, different cycl-ing numbers, and different temperatures. Simulation results show that the new model can correctly predict voltage separation beyond the nominal zone while maintaining the same level of accuracy as the generic MATLAB model in the exponential and nominal zones.
Keywords
Battery Model, Parameter Identification, Self-Discharge, Capacity Fade/Degradation, Cycling Life
1. Introduction
Battery-based energy storage systems (ESS) are playing an increasingly impor-tant role in modern electrical grids as they can serve a variety of functions in the
How to cite this paper: Song, D., Sun, C., Wang, P. and Jang, D. (2018) A Generic Battery Model and Its Parameter Identifica-tion. Energy and Power Engineering, 10, 10-27.
https://doi.org/10.4236/epe.2018.101002
Received: November 29, 2017 Accepted: January 9, 2018 Published: January 12, 2018
Copyright © 2018 by authors and Scientific Research Publishing Inc. This work is licensed under the Creative Commons Attribution International License (CC BY 4.0).
http://creativecommons.org/licenses/by/4.0/
DOI: 10.4236/epe.2018.101002 11 Energy and Power Engineering
generation, transmission, and distribution of electric energy, especially in the case of the high penetration of intermittent renewable energy from wind and solar power generation [1]. When an ESS relies on an electrochemical storage tech-nology like batteries, an accurate model of its voltage and capacity is essential to evaluating the system’s ability to perform various function required for grid ap-plications. The ESS controller must rely on this model in order to safely and re-liably operate the ESS. The existing mathematical battery models vary widely in terms of chemistries, reactions, and geometries modelled. In general, as more detailed physiochemical phenomena are included in a battery model, its simula-tion results can be expected to be more reliable, but at the cost of increased computational effort. Therefore, an accurate yet relatively simple dynamic ma-thematical model is required for the battery management systems (BMS) to faci-litate efficient ESS control in grid applications so that the charging/discharging processes can be properly managed to optimize battery performance and dura-bility.
According to their modeling methodology, battery models can be classified as Electrochemical Multiphysics, Equivalent Circuit (EC), and Empirical or semi- empirical dynamic models [2]. Electrochemical Multiphysics battery models [3]
incor-DOI: 10.4236/epe.2018.101002 12 Energy and Power Engineering
porates the temperature and aging functions and these effects on battery perfor-mance can be evaluated individually. This generic MATLAB battery model has been modified by many researchers to include some missing features, such as the self-discharge and internal resistance variation [13], nonlinear temperature de-pendence [14], and is commonly applied to the dynamic analysis for electric vehicles
[12] [15]. The most advantageous feature of the generic MATLAB battery model is that the model parameters are estimated from a manufacturer’s datasheet and only three points on one discharge curve are needed, namely the initial fully charged point (100% state of charge), the point at the end of exponential zone and the point at the end of nominal zone [7]. MATLAB’s generic model did not consider the variation of the battery capacity as a function of its self-discharge, discharge current, cycle life and temperature so it is unable to predict the voltage behavior near the end of the discharge process.
As a lithium-ion battery ages, its voltage and capacity decreases or fades and its internal resistance increases due to the loss of active lithium and the thickness of the solid electrolyte interface (SEI) [16] [17] and these variations should be carefully considered when developing a the dynamic battery model. This paper describes the advancements made to the generic MATLAB battery model by in-troducing an additional parameter together with a variable capacity which is a function of the self-discharge rate, the discharge current, the cycle life and oper-ating temperature. The effects of temperature and cycle life on battery perfor-mance are estimated using first-order approximations. An explicit and syste-matic approach is presented to determine the model parameters. More impor-tantly, the identification of model parameters is based only on information typi-cally provided in manufacturer’s datasheets and no tedious battery testing is re-quired.
2. The Modified MATLAB Model
In order to improve the accuracy of the generic MATLAB battery model beyond the nominal zone and to consider the capacity degradation, the equation of the generic MATLAB battery model [7] is modified as,
( )
( )
(
)
batt( ) 0 exp
mQ i
V t V Ri K A Bit
mQ i it
= − − + −
− (1)
and
( )
00
i
Q i Q
i
α
=
(2)
where Vbatt
( )
t is the battery voltage (V), t is charging or discharging time (h),0
V is a voltage constant (V), R is internal resistance of the battery (Ω), i is
battery current (A) where positive current represents discharging the battery and negative current indicates charging the battery, K is a polarization constant
(V/(Ah)), m is a capacity adjustment factor that accounts for capacity
DOI: 10.4236/epe.2018.101002 13 Energy and Power Engineering
point in the battery’s life being modeled, A is exponential zone voltage constant
(V), and B is exponential zone inverse time constant (1/(Ah)), and Q0 is the
nominal or rated battery capacity at the beginning of life (i.e. n = 1) at a refer-ence discharge current of i0.
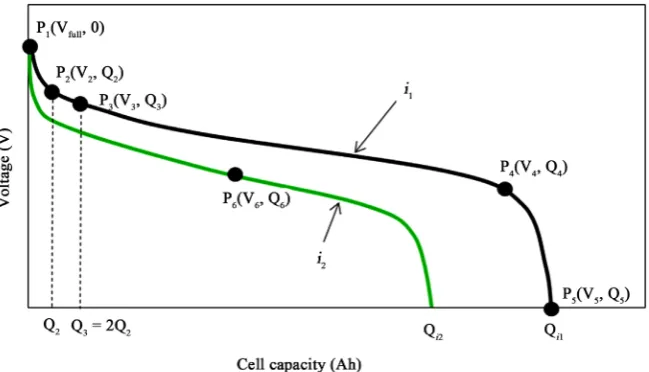
[image:4.595.213.538.517.703.2]The parameter α in Equation (2) can be determined by two battery capaci-ties (Q Qi1, i2) at two different discharge currents i1 and i2 under normal tem-perature (typically 25˚C) and near the beginning of life (e.g. n < 5), as shown in
Figure 1.
(
)
(
22 1)
1log
log
i i
Q Q
i i
α = (3)
There are a total of 7 unknowns in Equation (1): V0, R, K, A, B, Q0
and m. The method described in [7] can be applied here to estimate the first 6
parameters once the needed three points on a discharge curve are accurately identified. The initial 100% state of charge point is at the beginning of the dis-charge process (t=0). The other two points, one at the end of exponential zone and one at the end of nominal zone, are challenging to distinguish and need to be finely adjusted in order to obtain a good fit. The supporting documentation
[11] for MATLAB’s generic battery model describes that the capacity adjustment parameter (m) is set at a default value of 0.1 and no detailed procedure is given
on how to determine its value. In addition, the determination of the internal re-sistance relies on the cell efficiency which is not typically provided on manufac-turer’s datasheets. In this paper, a new procedure is introduced to determine all model parameters based only on the specifications typically provided on manu-facturer’s datasheets. As compared to the MATLAB method, the new procedure proposed is more tolerant of the positions of the required points on discharge curves. In general, the nominal capacity (Q0) of the battery can be found
direct-ly from manufacturer’s datasheets. The following section will focus on how to determine the other6 unknowns. Figure 1 plots two typical discharge curves
DOI: 10.4236/epe.2018.101002 14 Energy and Power Engineering
at two different discharge currents that are commonly included in manufactur-er’s datasheets.
The first step is to determine the parameters A B K, , and m by using five
points on the discharge curve at i=i i1
(
1>i2)
: P V1(
full, 0)
, the initial fully chargedpoint; P V Q2
(
2, 2)
and P V Q3(
3, 3)
are within the exponential zone and satisfy thecondition of Q3=2Q2; P V Q4
(
4, 4)
, one point near the end point of nominal zone;and P V Q5
(
5, 5)
, the end point of discharge. Five equations are obtained byap-plying Equation (1) to these five points accordingly.
full 0 1
V =V −Ri − +K A (4)
(
)
1 1
0 1 exp , 2, 3, 4, 5
i
j j
i j
mQ
V V Ri K A BQ j
mQ Q
= − − + − =
− (5)
Equation (4) minus Equation (5) to eliminate the term (V0−Ri1),
(
)
1 1
full 2 2
2
1 1 exp
i
i
mQ
V V K A BQ
mQ Q
− = − + − −
−
(6)
(
)
1 1
full 3 3
3
1 1 exp
i
i
mQ
V V K A BQ
mQ Q − = − + − − −
(7)
(
)
1 1
full 4 4
4
1 1 exp
i
i
mQ
V V K A BQ
mQ Q
− = − + − −
−
(8)
(
)
1 1
full 5 5
5
1 1 exp
i
i
mQ
V V K A BQ
mQ Q − = − + − − −
(9)
Assuming Q2Qi1, Q3Qi1 and noticing the relation of Q3=2Q2, Equa-tions (4) and (7) reduce to
(
)
full 2 1 exp 2
V −V ≈A − −BQ (10)
and
(
)
(
(
)
)
2full 3 1 exp 3 1 exp 2
V −V ≈A − −BQ =A − −BQ
(11)
Parameters A and B can be solved from Equations (10) and (11) as full 3
2 full 2
1
ln V V 1
B
Q V V
−
= − −
−
(12)
(
)
full 3 3 1 exp V V A BQ − =− − (13)
Let
(
)
4 full 4 1 exp 4
AB =V −V −A − −BQ (14)
(
)
5 full 5 1 exp 5
AB =V −V −A − −BQ (15)
Equations (8) and (9) becomes 1 1 4 4 1 i i mQ K AB mQ Q − = −
DOI: 10.4236/epe.2018.101002 15 Energy and Power Engineering and 1 1 5 5 1 i i mQ K AB mQ Q − = −
(17)
So the parameters m and K can be obtained from Equations (16) and (17)
as 1 5 4 4 5 4 4 5 1 1 i AB AB Q m
AB Q Q
AB Q −
= ×
− (18)
1 5 5 1 i Q
K AB m
Q
= −
(19)
The second step is to determine parameters R and V0. In some cases, the
battery’s internal resistance and efficiency are not provided in manufacturer’s datasheets so the MATLAB method to determine R given in [7] is not
appli-cable. Here a new procedure is proposed to calculate the internal resistance by using two points on two different discharge curves at two different discharge currents.
Applying the cell voltage Equation (1) to point P6 on the discharge curve of
current i2,
(
)
2 2
6 0 2 6
6
1 exp
i
i mQ
V V Ri K A BQ
mQ Q
= − − + − −
− (20)
Subtracting Equation (5) (for j=3) from Equation (20), and solving for the
internal resistance R results in the following equation,
(
)
(
)
2 2 1 1 6 61 2 6
3 3 3 1 exp exp i i i i mQ
R V K A BQ
i i mQ Q
mQ
V K A BQ
mQ Q = + − − − − − + − − − (21)
Once the values of parameters, B A m K, , , and R are available, the
con-stant voltage, V0 can be obtained from Equation (4), 0 full 1
V =V +Ri + −K A (22)
3. Model Equations with Aging and Temperature Effects
To include both aging and temperature effects, the model Equation (1) is rewrit-ten as,
(
)
(
)
(
)
(
)
(
(
( )
( )
)
)
(
)
(
)
batt r r r , , , ( ), , , ,, , , , exp
, , ,
V t i n t n T
mQ i n t n T
V n T R n T i K n T A n T Bit
mQ i n t n T it
= − − + −
−
(23)
where n is n-th discharge-charge cycle starting from discharging a cell to a
DOI: 10.4236/epe.2018.101002 16 Energy and Power Engineering
is the n-th resting time of the cell after the (n − 1)-th cycle. T is the cell
tem-perature. Here the capacity adjustment (m) and exponential zone time constant
(B) are assumed unchanged.
For simplicity, both the cycling- and temperature-dependences of the para-meters in Equation (23) are estimated by the first-order approximation,
(
,)
0(
1 Vn1(
1)
)
(
1 VT1(
ref)
)
V n T =V +k n− × +k T−T (24)
(
,)
0(
1 Rn1(
1)
)
(
1 RT1(
ref)
)
R n T =R +k n− × +k T−T (25)
(
,)
0(
1 Kn1(
1)
)
(
1 KT1(
ref)
)
K n T =K +k n− × +k T−T (26)
(
,)
0(
1 An1(
1)
)
(
1 AT1(
ref)
)
A n T =A +k n− × +k T−T (27)
where kxn1 refers to the first-order degradation rate constant of parameter x
re-lated to cycling life; kxT1 is the degradation rate constant of parameter x
re-lated to temperature; Tref is a reference temperature.
3.1. Battery Capacity Degradation Considering Self-Discharge, Cycling Life and Temperature
A battery’s capacity Q degrades not only due to the cycling life and
tempera-ture, but also as a function of the resting time between two consecutive dis-charge-charge cycles [18]. Furthermore, it is also varies with the corresponding discharge current. These degradations must first be identified before calculating the degradation rate constants appearing in Equations (24) to (27). Assuming the self-discharge rate constant doesn’t depend on cycling life, thenQ n t n
(
,r( )
)
,the battery capacity at beginning of the n-th cycle after resting t nr
( )
hours, canbe estimated as,
( )
(
, r)
(
1 sd r( )
)
( )
, 1, 2,Q n t n = −k t n Q n n= (28)
where ksd (1/h) is the rate constant of the self-discharge of the battery, Q n
( )
is the battery capacity at the beginning of the n-th cycle (before resting).
Once the battery is fully charged, its stored energy slowly diminishes due to internal self-discharge [13] (i.e. with no load on the battery). Self-discharge va-ries with battery types. For a lithium-ion battery, the self-discharge rate is around 5% in the first 24 hours and then reduces to 1% - 2% per month, plus 3% for safety circuit consumption [19]. The typical values of ksd for a lithium-ion battery cell
is given in [9] as,
5
8 10 1 h
sd
k = × −
The degradation of Q n
( )
due to cycling is an irreversible and cumulativeprocess and can be approximated by second-order approximation as,
( )
(
) (
)
(
)
( )
2
Qn1 Qn2
1 1 1 , 1, 2,
0
Q n Q n n k Q n k Q n
Q Q
= − + − + − =
=
(29)
where Q is the battery’s capacity given by Equation (2), kQn1 and kQn2 are the
DOI: 10.4236/epe.2018.101002 17 Energy and Power Engineering
respectively.
The summation of above Equations (29) from 1 to n leads to,
( )
(
)
Qn1(
) (
)
Qn21 1 2 1
1
2 2
n n n n n
Q n =Q + − k + − − k
(30)
Since the capacity degradation of the battery is also dependent on tempera-ture, Equation (30) is modified as
(
)
(
)
(
) (
)
(
)
(
)
(
)
Qn1 Qn2
2
QT1 ref QT2 ref
1 1 2 1
, 1
2 2
1
n n n n n
Q n T Q k k
k T T k T T
− − − = + + × + − + − (31)
where kQT1 and kQT2 are the first and second-order degradation rates of the
battery capacity related to temperature change.
Finally, the degradation of a battery’s capacity due to self-discharge, discharge current, life cycle and temperature is expressed by substituting Equations (31) and (2) into Equation (28) as
( )
(
)
( )
(
)
(
)
(
) (
)
(
)
(
)
(
)
rsd r 0 Qn1 Qn2
0
2 QT1 ref QT2 ref
, , ,
1 1 2 1
1 1
2 2
1 , 1, 2,
Q i n t n T
n n n n n
i
k t n Q k k
i
k T T k T T n
α − − − = − + + × + − + − = (32)
Two battery capacities (Qn1,Qn2) at two different cycle numbers under normal or reference temperature are needed to calculate the cycling related degradation rates (kQn1 and kQn2); another two battery capacities (Q QT1, T2) at two different temperatures under in the first life cycle are required to estimate the temperature related degradation rates (kQT1 and kQT2).
(
)
(
) (
)
(
)
(
) (
)
( )
(
)
(
)
( )
(
)
(
)
1 2 1 1 1 1 1 1sd r 1 0 0 Qn1
Qn2 2 2 2 2 2
sd r 2 0 0
1 1 2 1 1
1
2 2
1 1 2 1
1
2 2 1
n
n
n
n
Q
n n n n n
k t n Q i i
k
k n n n n n Q
k t n Q i i
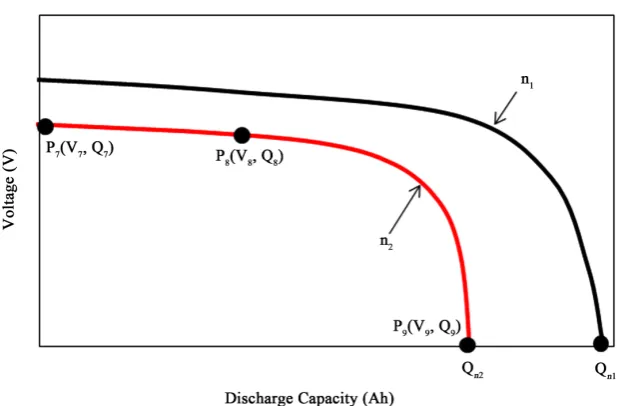
α α − − − − − − × × = − − − − − × × (33) where the two battery capacities, Qn1 and Qn2, can be found on the two dis-charge curves provided by manufacturer’s datasheet under two different cycling numbers n1 and n2 at normal temperature, as shown in Figure 2.
(
)
(
)
( )
(
)
(
)
( )
(
)
(
)
1 2 1 2sd r 0 0 QT1 1 ref 1 ref
2 QT2 2 ref 2 ref
sd r 0 0
1 1 1 1 1 1 T T T T Q
k t Q i i
k T T T T
k T T T T Q
k t Q i i
α α − − − − − × × = − − − − × × (34)
where the two battery capacities, QT1 and QT2, can be found on the two
DOI: 10.4236/epe.2018.101002 18 Energy and Power Engineering Figure 2. Two typical discharge curves of two cycle numbers n1 and n2 (n2>n1>1) at
normal temperature (T=Tref ) and same constant discharge current (in).
Figure 3. Two typical discharge curves of two temperatures T1 and T2 at the first cycle
(n=1) and same constant discharge current (iT).
3.2. First-Order Degradation Rate Constants Related to Cycling Life kxn1
To determine the first-order degradation rate constants related to cycling life
n1 x
k , point P1 in Figure 1, and three other points on the discharge curve of
(
)
2 2 1 1
n=n n >n > , namely points P7, P8 and P9, are required, as shown in Figure 2.
Applying the modified cell voltage Equation (23) with Equations (24)-(27) to point P1 with n = 2, points P7, P8 and P9 respectively, and rearranging the
result-ing 4 equations into the followresult-ing matrix form,
Xn=
[image:9.595.218.530.317.519.2]DOI: 10.4236/epe.2018.101002 19 Energy and Power Engineering where
(
)
(
)
(
)
(
)
full 0 0 1 0 0
7 0 0 0 0
Vn1
Rn1
8 0 0 0 0 0 8
Xn
8 Kn1
An1
9 0 0 0 0 0 9
9 exp ; exp n n n
V V R i K A
V V R i K A
k
k mQ
V V R i K A B Q
mQ Q k
k mQ
V V R i K A B Q
mQ Q − − − + − − − + − − − + − = = − − − − + − −
k b (36)
and
(
)
(
)
(
)
(
)
(
)
(
)
(
)
(
)
(
)
(
)
(
)
(
)
(
)
(
)
0 0 1 0 0
0 2 0 2 0 2 0 2
0 2 0 2 0 2 0 2 0 8 8
0 2 0 2 0 2 0 2 0 9 9
1 1 1 1
1 1 1 1 exp
1 1 1 1 exp
n
n
n
V R i K A
V n R i n K n A n
mQ
V n R i n K n A n B Q
mQ Q
mQ
V n R i n K n A n B Q
mQ Q − − − − − − − − − − − − − − − = − − − − − − − − − G (37) Note that the value of Q in expressions (36) and (37) should be the value of
( )
(
, , r ,)
Q i n t n T at i=i nn, =n T2, =Tref.
The first-order degradation rate constants related to cycling life in Equations (24) to (27), kVn1, kRn1, kKn1 and kAn1 can be obtained by solving Equation
(35),
1 Xn
−
=
k G b (38) The internal resistance variation is usually very small and can be neglected within a certain life span (for example, n≤n0=1000) and therefore, the
degra-dation rate constant related to cycling life for internal resistance is modified as
0 Rn1 Rn1 0 0, , n n k
k n n
≤
= >
(39)
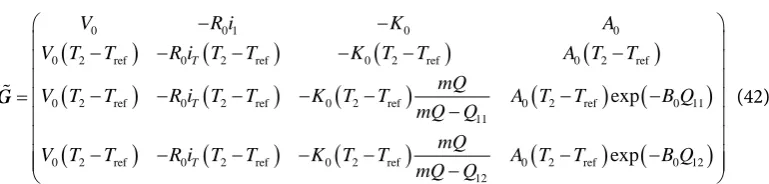
3.3. First-Order Degradation Rate Constants Related to Temperature kxT1
Similar to kxn1, the degradation rate constants related to temperature kxT1 can
be calculated by applying the procedures given in Section 3.2 to point P1 with
1
ref
T =T + , points P10, P11 and P12, as shown in Figure 3. The formulas for the
calculation are given as follows.
XT=
Gk b (40) where
(
)
(
)
(
)
(
)
0 0 1 0 0 10 0 0 0 0 VT1
RT1
11 0 0 0 0 0 11 XT
11 KT1
AT1
12 0 0 0 0 0 12 12 exp ; exp full T T T
V V R i K A
V V R i K A
k
k mQ
V V R i K A B Q
mQ Q
k
k mQ
V V R i K A B Q
mQ Q − − − + − − − + − − − + − = = − − − − + − −
DOI: 10.4236/epe.2018.101002 20 Energy and Power Engineering
and
(
)
(
)
(
)
(
)
(
)
(
)
(
)
(
)
(
)
(
)
(
)
(
)
(
)
(
)
0 0 1 0 0
0 2 ref 0 2 ref 0 2 ref 0 2 ref 0 2 ref 0 2 ref 0 2 ref 0 2 ref 0 11
11
0 2 ref 0 2 ref 0 2 ref 0 2 ref 0 12 12
exp
exp
T
T
T
V R i K A
V T T R i T T K T T A T T
mQ
V T T R i T T K T T A T T B Q
mQ Q
mQ
V T T R i T T K T T A T T B Q
mQ Q
− −
− − − − − −
− − − − − − −
= −
− − − − − − −
−
G (42)
Note that the value of Q in expressions (41) and (42) should be the value of
( )
(
, , r ,)
Q i n t n T at i=i nT, =1,T=T2.
The first-order degradation rate constants related to temperature in Equations (24) to (27), kVT1, kRT1, kKT1 and kAT1 can be obtained by solving Equation
(40),
1 XT
−
=
k G b (43) The final battery model takes into account the effects of self-discharge, cycling life and temperature on capacity degradation and battery voltage, and these de-pendencies are described by Equations (23) to (27), and (32). The identification of the model parameters depends only on the information typically provided in a manufacturer’s datasheet and the procedures used to derive them are presented in detail.
4. Model Validation
The modified model is verified by two steps. First, the model is applied to the two batteries used in [7] and the predicted battery voltages are compared with those generated by the generic MATLAB model. Secondly, the modified model with the inclusion of aging and temperature is applied to a commercially availa-ble lithium-ion battery and the model parameters are extracted. The new mod-el’s calculated battery voltage is then compared with the performance figures pro-vided in the manufacturer’s datasheet.
4.1. Comparison with the MATLAB Model
[image:11.595.153.538.86.178.2]Both the nickel-metal hydride (NiMH) and lithium-ion batteries from [7] are used here to check the improvement of battery voltage prediction of the modified model Equations (1) and (2). For the NiMH battery, Figure 4 shows the com-parison of voltage prediction by the modified model with the prediction by the generic MATLAB model, and with the values on the manufacturer’s datasheet as well. It can be seen that the overall accuracy of the modified model is better than the generic MATLAB model for all three discharge rates, especially beyond the nominal region.
DOI: 10.4236/epe.2018.101002 21 Energy and Power Engineering
Figure 4. Comparison of voltage prediction under different discharge currents for the
[image:12.595.210.538.370.543.2]NiMH battery [7].
Figure 5. Comparison of voltage prediction under different discharge currents for the
li-thium-ion battery [7].
is the voltage prediction beyond the nominal zone. All of the three discharge curves (red lines) predicted by the generic MATLAB model converge to the rated capacity which is not the case comparing with the reference data. The modified model demonstrates much higher accuracy within this zone and has correctly predicted the separation of the three discharge curves (black lines) at the end of discharge process.
DOI: 10.4236/epe.2018.101002 22 Energy and Power Engineering
Figure 6. Battery capacity changes with discharge current for both lithium-ion and NiMH
batteries from [7].
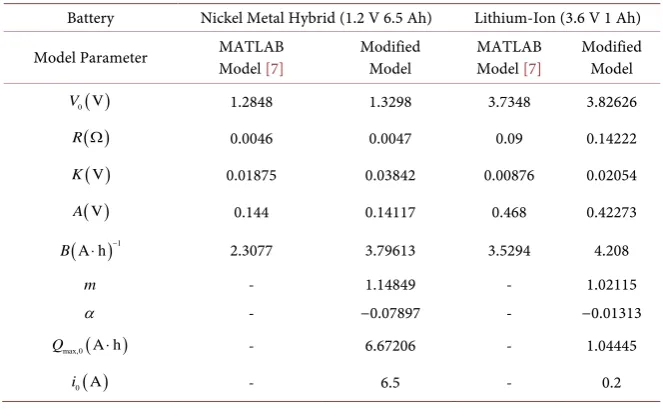
Table 1 lists the model parameters of the generic MATLAB model and the modified model for both the NiMH and lithium-ion batteries.
4.2. Model Validation Using a Commercially Available Large-Format Lithium-Ion Battery
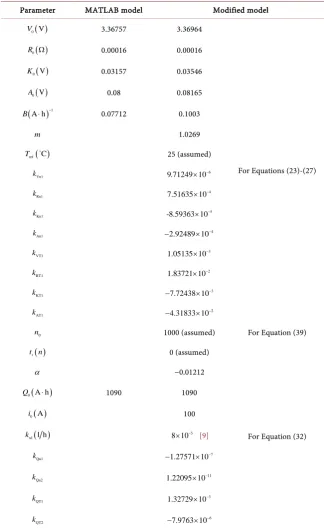
To further validate the modified battery model, a large-format high capacity (1000 Ah) lithium-ion battery from SINOPOLY was used. The specifications and discharge curves of the battery (Model: SP-LFP1000AHA) can be found in
[20]. Based on the procedures given in Sections 2 and 3, the parameter values for the modified model are extracted and listed in Table 2. For comparison, the ge-neric MATLAB model parameter values are also estimated and presented in Ta-ble 2.
The capacity of the SP-LFP1000AHA battery varies with the discharge cur-rent, temperature and cycling number. Comparing with the experimental data, Equation (32) gives a very good approximation, as shown in Figure 7.
Figure 8 shows the voltage vs capacity curves from the manufacturer’s data-sheet, the MATLAB model, and the modified model for three different discharge currents. The modified model has comparable accuracy with the generic MATLAB model in terms of the voltage prediction in the exponential and nominal zones but has much higher accuracy beyond the nominal zone. Near the end of the dis-charge process, the new model predicts the battery’s output voltage much closer to the results provided in the manufacturer’s datasheet while the generic MATLAB model incorrectly converges the three (red) curves to a single capacity value due to the MATLAB model doesn’t consider the battery capacity variation with dis-charge currents.
DOI: 10.4236/epe.2018.101002 23 Energy and Power Engineering
Figure 7. Comparison of capacity prediction with experimental data for the SP-LFP1000AHA
[image:14.595.211.538.293.461.2]battery.
Figure 8. Comparison of voltage prediction under different discharge currents for the
SP-LFP1000AHA lithium-ion battery.
Table 1. Model parameters.
Battery Nickel Metal Hybrid (1.2 V 6.5 Ah) Lithium-Ion (3.6 V 1 Ah)
Model Parameter MATLAB Model [7]
Modified Model
MATLAB Model [7]
Modified Model ( )
0 V
V 1.2848 1.3298 3.7348 3.82626
( )
R Ω 0.0046 0.0047 0.09 0.14222
( )V
K 0.01875 0.03842 0.00876 0.02054
( )V
A 0.144 0.14117 0.468 0.42273
( )1
A h
B ⋅ − 2.3077 3.79613 3.5294 4.208
m - 1.14849 - 1.02115
α - −0.07897 - −0.01313
( )
max,0 A h
Q ⋅ - 6.67206 - 1.04445
( )
0 A
[image:14.595.208.540.523.733.2]DOI: 10.4236/epe.2018.101002 24 Energy and Power Engineering
Table 2. Model parameters for the SP-LFP1000AHA battery.
Parameter MATLAB model Modified model
( )
0 V
V 3.36757 3.36964
For Equations (23)-(27) ( )
0
R Ω 0.00016 0.00016
( )
0 V
K 0.03157 0.03546
( )
0 V
A 0.08 0.08165
( )1
A h
B ⋅ − 0.07712 0.1003
m 1.0269
( )
ref C
T 25 (assumed)
Vn1
k 6
9.71249 10× −
Rn1
k 4
7.51635 10× −
Kn1
k 5
-8.59363 10× −
An1
k 4
2.92489 10−
− ×
VT1
k 3
1.05135 10× −
RT1
k 2
1.83721 10× −
KT1
k 3
7.72438 10−
− ×
AT1
k 2
4.31833 10−
− ×
0
n 1000 (assumed) For Equation (39)
( )
r
t n 0 (assumed)
For Equation (32)
α −0.01212
( )
0 A h
Q ⋅ 1090 1090
( )
0 A
i 100
( )
sd 1 h
k 5
8 10× − [9]
Qn1
k 7
1.27571 10−
− ×
Qn2
k 11
1.22095 10× −
QT1
k 3
1.32729 10× −
QT2
k 6
7.9763 10−
− ×
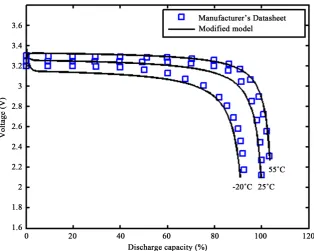
Figure 10 depicts the temperature effects on the discharge curves calculated by the new model under three different temperatures and compares them with the manufacturer’s datasheet.
DOI: 10.4236/epe.2018.101002 25 Energy and Power Engineering
Figure 9. Comparison of voltage prediction over cycle life under different discharge
con-ditions for the SP-LFP1000AHA lithium-ion battery.
Figure 10. Comparison of voltage prediction under different temperatures for the SP-LFP
1000AHA lithium-ion battery.
5. Conclusion
[image:16.595.216.531.362.613.2]parame-DOI: 10.4236/epe.2018.101002 26 Energy and Power Engineering
ters on cycle life and temperature are linearly estimated. The detailed procedures are developed to determine the model parameters and the capacity function. The model parameter identification depends only on information typically available from manufacturer’s datasheets. The new model was compared with the generic MATLAB model for a nickel-metal hydride battery and the lithium-ion battery that are used for the generic MATLAB battery model validation. The simulation results demonstrated that the newly developed model has similar accuracy with-in the exponential and nomwith-inal zones compared to the generic MATLAB model but can correctly capture the discharge curve separation behavior beyond the no-minal zone where the generic MATLAB model failed. Further validation on a large capacity lithium-ion battery has shown that the modified model can accurately predict the discharge curves at different discharge currents, at different points in cycle life, and at different temperatures. Future work will be devoted to further validate the model with various battery types, integrate it into a grid-scale energy storage control system with the goal of improving its reliable and economic op-eration.
References
[1] Xu, X., Bishop, M., Oikarinen, D.G. and Hao, C. (2016)Application and Modeling of Battery Energy Storage in Power System. CSEE Journal of Power and Energy Systems, 2, 82-90. https://doi.org/10.17775/CSEEJPES.2016.00039
[2] Nejad, S., Gladwin, D.T. and Stone, D.A. (2016) A Systematic Review of Lumped- Parameter Equivalent Circuit Models for Real-Time Estimation of Lithium-Ion Battery States. Journal of Power Sources, 316, 183-196.
https://doi.org/10.1016/j.jpowsour.2016.03.042
[3] Ramadesigan, V., Northrop, P.W.C., De, S., Santhanagopalan, S., Braatz, R.D. and Subramanian, V.R. (2012) Modeling and Simulation of Lithium-Ion Batteries from a Systems Engineering Perspective. Journal of the Electrochemical Society, 159, R31-R45. https://doi.org/10.1149/2.018203jes
[4] Fotouhi, A., Auger, D.J., Propp, K., Longo, S. and Wild, M. (2016) A Review on Electric Vehicle Battery Modeling: From Lithium-Ion toward Lithium-Sulphur.
Renewable and Sustainable Energy Reviews, 56, 1008-1021. https://doi.org/10.1016/j.rser.2015.12.009
[5] Baccouche, I., Jemmali, S., Manai, B., Omar, N. and Amara, N.E.B. (2017) Improved OCV Model of a Li-Ion NMC Battery for Online SOC Estimation Using the Ex-tended Kalman Filter. Energies, 10, 764. https://doi.org/10.3390/en10060764 [6] Shepherd, C.M. (1965) Design of Primary and Secondary Cells—Part 2. An
Equa-tion Describing Battery Discharge. Journal of Electrochemical Society, 112, 657-664. https://doi.org/10.1149/1.2423659
[7] Tremblay, O., Dessaint, L.-A. and Dekkiche, A.-I. (2007) A Generic Battery Model for the Dynamic Simulation of Hybrid Electric Vehicles. Vehicle Power and Propul-sion Conference, Arlington, 9-12 September 2007, 284-289.
https://doi.org/10.1109/VPPC.2007.4544139
[8] Hartmann II, R.L. (2008) An Aging Model for Lithium-Ion Cells. PhD Thesis, The Graduate Faculty of The University of Akron, Akron.
DOI: 10.4236/epe.2018.101002 27 Energy and Power Engineering [10] Ahmed, R., Gazzarri, J., Onori, S., Habibi, S., Jackey, R., Rzemien, K., Tjong, J. and
LeSage, J. (2015) Model-Based Parameter Identification of Healthy and Aged Li-Ion Batteries for Electric Vehicles. SAE International Journal of Alternative Powertrains, 4, 233-247.
[11] Mathworks.com (2017) https://www.mathworks.com/
[12] Tremblay, O. and Dessaint, L.-A. (2009) Experimental Validation of a Battery Dy-namic Model for EV Applications. World Electric Vehicle Journal, 3, 289-298. [13] Sibi Krishnan, K. Prasanth, P. and Sunitha, R. (2016) Generic Battery Model
Cover-ing Self-Discharge and Internal Resistance Variation. 2016 IEEE 6th International Conference on Power Systems (ICPS), New Delhi, 4-6 March 2016, 1-5.
[14] Kroeze, R.C. and Krein, P.T. (2008) Electrical Battery Model for Use in Dynamic Electric Vehicle Simulations. 2008 IEEEPower Electronics Specialists Conference, Rhodes, 15-19 June 2008. https://doi.org/10.1109/PESC.2008.4592119
[15] Wijewardana, S.M. (2014) New Dynamic Battery Model for Hybrid Vehicles and Dynamic Model Analysis Using Simulink. Engineer, XLVII, 53-61.
[16] Barre, A., Deguilhem, B., Grolleau, S., Gerard, M., Suard, F. and Riu, D. (2013) A Review on Lithium-Ion Battery Ageing Mechanisms and Estimations for Automo-tive Applications. Journal of Power Sources, 241, 680-689.
[17] Ashwin, T.R., Chung, Y.M. and Wang, J. (2016) Capacity Fade Modelling of Li-thium-Ion Battery under Cyclic Loading Conditions. Journal of Power Sources, 328, 586-598.
[18] Jaguemont, J., Boulon, L., Venet, P., Dube, Y. and Sari, A. (2016) Lithium-Ion Bat-tery Aging Experiments at Subzero Temperatures and Model Development for Capacity Fade Estimation. IEEE Transactions on Vehicular Technology, 65, 4328-4343. [19] Battery University (2017)
http://batteryuniversity.com/learn/article/elevating_self_discharge [20] Sinopoly Lithium-Ion (2017)
![Figure 4. Comparison of voltage prediction under different discharge currents for the NiMH battery [7]](https://thumb-us.123doks.com/thumbv2/123dok_us/18296.501618/12.595.212.538.71.323/figure-comparison-voltage-prediction-different-discharge-currents-battery.webp)
![Figure 6. Battery capacity changes with discharge current for both lithium-ion and NiMH batteries from [7]](https://thumb-us.123doks.com/thumbv2/123dok_us/18296.501618/13.595.210.538.68.254/figure-battery-capacity-changes-discharge-current-lithium-batteries.webp)