Probing QCD with Photons and Jets at the ATLAS detector
Giuseppe Callea1,a, on behalf of the ATLAS Collaboration
1Università della Calabria and INFN-Cosenza
Abstract.This contribution gives an overview of the recent measurements of the diff
er-ential cross sections for final states involving photons and/or jets at the centre-of-mass
energies of 8 and 13 TeV, published by the ATLAS Collaboration. The results are com-pared with several next-to-leading order calculations and with the latest predictions of various Monte Carlo generators. New measurements of transverse energy-energy corre-lations and their associated asymmetries in multi-jet events at 8 TeV are also presented. Both measurements are used to extract the strong coupling constant and test the renor-malization group equation.
1 Introduction
The study of the production of jets and photons at the Large Hadron Collider (LHC) provides a pow-erful tool for understanding perturbative QCD (pQCD). The production of prompt photons in proton-proton collisions, provides a testing ground for pQCD in a cleaner enviroment than in jet production, since the colorless photon originates directly from the hard interaction. The prompt photon analyses described in this contribution include both photons coming from the direct contribution and from the fragmentation process [1]. An isolation requirement is applied in order to reduce the background from photons produced during hadronisation. Moreover, the jet production measurements are used to contrain the gluon density in the proton and can be exploited to extract the strong coupling constant (αs) in specific final state topologies. This paper presents the recent published measurements of the cross section of final states involving photons and/or jets at center-of-mass energies of 8 and 13 TeV
with the data collected by ATLAS detector [2]. We also present a measurement of the transverse energy-energy correlations (TEEC) and their associate asymmetries (ATEEC) in multi-jet events at 8 TeV and a method to extractαsfrom them.
2 Photon production
2.1 Inclusive isolated photon production
Inclusive isolated-photon production at 13 TeV has been studied using a dataset with an integrated luminosity of 3.2 fb−1[3]. Cross sections as a function ofEγ
Tare measured in four different regions of the photon pseudorapidityηγfor photons withEγ
T >125 GeV and|ηγ|<2.37. The predictions of the Leading Order (LO) Monte Carlo (MC) generators Pythia [4] and Sherpa[5] give an adequate
ae-mail: [email protected]
Theory/Data
0.6 0.8 1 1.2
1.4 ATLAS
-1
= 13 TeV, 3.2 fb s
luminosity uncertainty
|<0.6)
γ
η Data (|
NLO QCD (JETPHOX): MMHT2014 CT14 NNPDF3.0
|<1.37)
γ
η Data (0.6<|
[GeV]
γ
T
E
200 300 400 500 1000
Theory/Data
0.6 0.8 1 1.2
1.4 |<1.81)
γ
η Data (1.56<|
[GeV]
γ
T
E
200 300 400 500 1000 |<2.37)
γ
η Data (1.81<|
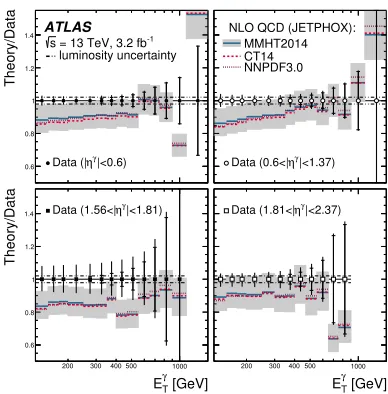
Figure 1. Ratio of the NLO pQCD predictions from Jetphoxbased on the MMHT2014 PDFs to the measured
cross sections for isolated-photon production (solid lines) as a function ofEγ
Tin four|η|bins [3]. The black error bars represent the experimental uncertainties, the dot-dashed lines represent the uncertainty due to the luminosity measurement and the shaded bands display the theoretical uncertainty. The ratio of the NLO pQCD predictions based on the CT14 (dashed lines) or NNPDF3.0 (dotted lines) PDF sets to the data are also included.
description of the data, except forEγ
T ≥500 GeV in the regions of|ηγ|<0.6 and 0.6<|ηγ|<1.37. The photon energy is the dominant systematic uncertainty at highEγ
Twhile, at lowE γ
Tthe uncertainty related to the background subtraction method dominates. The uncertainties are larger in the |ηγ|
-forward regions. In Figure 1, the NLO pQCD predictions of Jetphox [6], using the MMHT2014
PDF set, are shown, providing an adequate description of the data within the theoretical uncertainties, which are larger than the experimental ones.
2.2 Photon + jet production
Measurements of the cross sections for the production of an isolated photon in association with up to three jets have been studied with the ATLAS detector at 8 TeV [7].
The photon is required to haveEγ
T >130 GeV and|ηγ|<2.37. The jets are reconstructed using the anti-kt algorithm [8] with radius parameter 0.6. The differential cross sections for photon plus one jet are measured as functions of Eγ
T and pjet1T with pjet1T >100 GeV. For the measurements of the cross sections as a function ofmγ−jet1and the scattering angle in the center-of-mass frame (|cosθ∗|), an additional requirement is imposed: mγ−jet1 >467 GeV. The NLO QCD predictions of Jetphox, corrected for hadronisation and underlying-event effects, give a good description of the measured
cross section distributions in both shape and normalisation. In particular, the measured differential
cross section as a function of|cosθ∗|and its scale dependence is consistent with the dominance of processes in which a quark is being exchanged.
Photon plus two-jets production is investigated by measuring differential cross sections as functions
ofEγ
T andpjet2T and the azimuthal separation between the final state objects forpjet1T >100 GeV and
Theory/Data
0.6 0.8 1 1.2
1.4 ATLAS
-1
= 13 TeV, 3.2 fb s
luminosity uncertainty
|<0.6)
γ
η Data (|
NLO QCD (JETPHOX): MMHT2014 CT14 NNPDF3.0
|<1.37)
γ
η Data (0.6<|
[GeV]
γ
T
E
200 300 400 500 1000
Theory/Data
0.6 0.8 1 1.2
1.4 |<1.81)
γ
η Data (1.56<|
[GeV]
γ
T
E
200 300 400 500 1000 |<2.37)
γ
η Data (1.81<|
Figure 1. Ratio of the NLO pQCD predictions from Jetphoxbased on the MMHT2014 PDFs to the measured
cross sections for isolated-photon production (solid lines) as a function ofEγ
Tin four|η|bins [3]. The black error bars represent the experimental uncertainties, the dot-dashed lines represent the uncertainty due to the luminosity measurement and the shaded bands display the theoretical uncertainty. The ratio of the NLO pQCD predictions based on the CT14 (dashed lines) or NNPDF3.0 (dotted lines) PDF sets to the data are also included.
description of the data, except forEγ
T ≥500 GeV in the regions of|ηγ|<0.6 and 0.6<|ηγ| <1.37. The photon energy is the dominant systematic uncertainty at highEγ
Twhile, at lowE γ
Tthe uncertainty related to the background subtraction method dominates. The uncertainties are larger in the |ηγ|
-forward regions. In Figure 1, the NLO pQCD predictions of Jetphox[6], using the MMHT2014
PDF set, are shown, providing an adequate description of the data within the theoretical uncertainties, which are larger than the experimental ones.
2.2 Photon + jet production
Measurements of the cross sections for the production of an isolated photon in association with up to three jets have been studied with the ATLAS detector at 8 TeV [7].
The photon is required to haveEγ
T >130 GeV and|ηγ|<2.37. The jets are reconstructed using the anti-ktalgorithm [8] with radius parameter 0.6. The differential cross sections for photon plus one jet are measured as functions of Eγ
T and pjet1T with pjet1T >100 GeV. For the measurements of the cross sections as a function ofmγ−jet1and the scattering angle in the center-of-mass frame (|cosθ∗|), an additional requirement is imposed: mγ−jet1 >467 GeV. The NLO QCD predictions of Jetphox, corrected for hadronisation and underlying-event effects, give a good description of the measured
cross section distributions in both shape and normalisation. In particular, the measured differential
cross section as a function of|cosθ∗|and its scale dependence is consistent with the dominance of processes in which a quark is being exchanged.
Photon plus two-jets production is investigated by measuring differential cross sections as functions
ofEγ
T andpjet2T and the azimuthal separation between the final state objects for pjet1T >100 GeV and
pjet2T >65 GeV. The predictions of Sherpa, which include higher-order tree level matrix elements, give
a better description ofpjet2T and the angular distributions, respect to those of Pythia, which are based
on 2→2 processes. The NLO QCD predictions of BlackHat[9] provide a good description of the
measured differential cross sections, except forETγ >750 GeV, as shown in Figure 2.
Photon plus three-jets production is characterised by measuring the differential cross sections as
[pb/GeV]
γ T
/dE
σ
d
5
−
10 4
−
10 3
−
10 2
−
10 1
−
10
ATLAS
-1 = 8 TeV, 20.2 fb s
Data NLO QCD (BLACKHAT, D)
> 100 GeV
jet1 T
p
+ 2 jets + X
γ →
pp
> 65 GeV
jet2 T
p
[GeV]
γ T
E 200 300 400 500 600 1000
NLO/Data
0.6 0.8 1 1.2 1.4
[pb]
-jet2
γ
φ
∆
/d
σ
d
0 5 10 15
ATLAS
-1 = 8 TeV, 20.2 fb s
Data NLO QCD (BLACKHAT, D)
+ 2 jets + X
γ →
pp
> 130 GeV
γ
T
E
> 100 GeV
jet1 T
p
> 65 GeV
jet2 T
p
[rad]
-jet2 γ φ ∆
0 1 2 3
NLO/Data
0.6 0.8 1 1.2 1.4
Figure 2. Measured cross section for isolated-photon plus two jets production (dots) as a function ofEγ T(left) and of the azimuthal separation between the photon and the sub-leading jet,∆φγ−jet2, (right) [7]. The NLO QCD predictions of BlackHatbased on the CT10 PDF set (solid lines) are also included for comparison. The bottom
part of both figures shows the ratio of the NLO QCD prediction to the measured cross-section. The black error bars respresent the experimental uncertainties while the shaded bands are the theoretical uncertainties of the calculation.
functions ofEγ
Tandpjet3T and the azimuthal separation between the final state objects for pjet1T >100 GeV,pjet2T >65 GeV andpjet3T >50 GeV. Sherpadescribes better than Pythiapjet3T , while both of them
give a good description of the angular distributions. The NLO QCD predictions of BlackHatprovide
a good description of the measured differential cross sections.
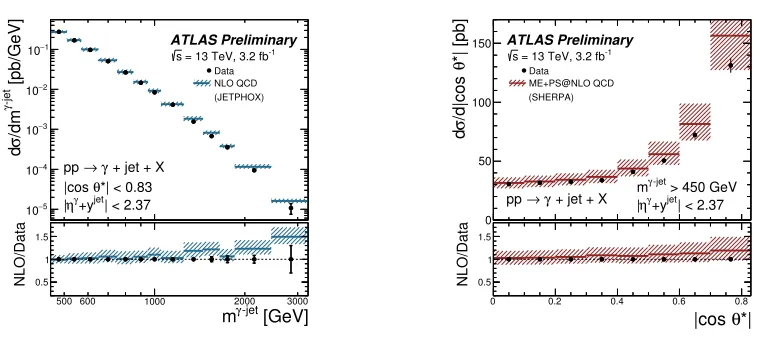
The dynamics of the isolated-photon production in association with a jet have been also studied using the dataset collected with the ATLAS detector in 2015, with an integrated luminosity of 3.2 fb−1[10]. Photons are required to haveEγ
Tabove 125 GeV. Jets are reconstructed using the anti-ktwith radius parameter R=0.4 and are required to havepjetT greater than 100 GeV and|yjet|<2.37. Measurements of isolated-photon plus jet cross sections are presented as functions of the leading photon tranverse energy, the leading jet transverse momentumpjetT−lead, the azimuthal separation between the photon and the jet, the invariant mass of the photon-jet system and|cosθ∗|. The differential cross sections
as a function ofmγ−jet and|cosθ∗|are performed in an unbiased phase-space by requiring: |ηγ + yjet−lead|<2.37,|cosθ∗|<0.83 andmγ−jet>450 GeV. The LO predictions of Pythiaand Sherpagive a good description of the data, except forpjet−lead
T in the case of Pythia. The fixed-order NLO QCD calculations of Jetphox, corrected for hadronisation and underlying event effects, and the multi-leg
NLO QCD plus parton shower calculations of Sherpadescribe the measured cross sections within the
[pb/GeV]
-jet
γ
/dm
σ
d
5
−
10 4
−
10 3
−
10 2
−
10 1
−
10
NLO QCD (JETPHOX)
ATLAS Preliminary
-1 = 13 TeV, 3.2 fb s
Data
*| < 0.83
θ
|cos
+ jet + X
γ →
pp
| < 2.37
jet
+y
γ
η
|
[GeV]
-jet γ
m
500 600 1000 2000 3000
NLO/Data 0.5 1 1.5
*| [pb]
θ
/d|cos
σ
d
0 50 100 150
ME+PS@NLO QCD (SHERPA)
ATLAS Preliminary
-1 = 13 TeV, 3.2 fb s
Data
> 450 GeV
-jet
γ
m + jet + X
γ →
pp jet| < 2.37
+y
γ
η
|
*|
θ
|cos
0 0.2 0.4 0.6 0.8
NLO/Data 0.5 1 1.5
Figure 3.Measured cross section for isolated-photon plus a jet production (dots) as a function of the invariant mass of the photon-jet system,mγ−jetand of the scattering angle in the center-of-mass frame, compared with the fixed-order NLO QCD calculations of Jetphox(left) and multi-leg NLO QCD plus parton shower predictions
from Sherpa(right) [10]. The bottom part of both figures shows the ratio of the NLO QCD prediction to the
measured cross section. The black error bars respresent the experimental uncertainties while the shaded bands are the theoretical uncertainties of the calculation.
does not depend on the used PDF set. The measureddσ/|cosθ∗|is consistent with the dominance of processes in which a quark has been exchanged.
2.3 Photon pair production
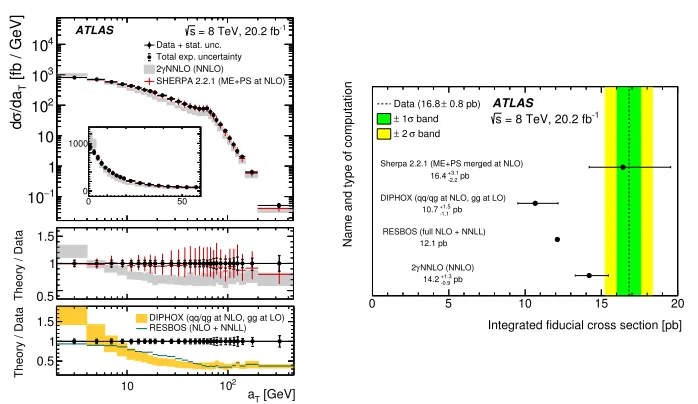
Measurements of a photon pair production has been studied at a center-of-mass energy of 8 TeV [11]. The leading and sub-leading photons are required to haveEγ(1)
T >40 GeV and E γ(2)
T >30 GeV re-spectevely and|ηγ|<2.37 both. Differential cross sections are mesured as functions of the main
vari-ables of the photon pair system, together with the trasverse component of the diphoton tri-momentum respect to the thrust axis (aT). The fixed-order QCD calculations of Diphox[12] and Resbos[13] at NLO, 2γNNLO at NNLO [14] are compared to the data. These predictions are unable to reproduce the measured cross sections: Resbosand Diphoxmiss higher orders, while the NNLO calculations of
2γNNLO improve the description, but are still insufficient to describe the data. The predictions of a
parton-level calculation of varying the jet multiplicity up to NLO1, matched to the parton shower algo-rithm in Sherpa2.2.1 provide a good description of the data. Figure 4 shows the comparison between
the measured differential cross section as a function ofaTand the fiducial cross section compared to
the different pQCD calculations.
[pb/GeV]
-jet
γ
/dm
σ
d
5
−
10 4
−
10 3
−
10 2
−
10 1
−
10
NLO QCD (JETPHOX)
ATLAS Preliminary
-1 = 13 TeV, 3.2 fb s
Data
*| < 0.83
θ
|cos
+ jet + X
γ →
pp
| < 2.37
jet
+y
γ
η
|
[GeV]
-jet γ
m
500 600 1000 2000 3000
NLO/Data 0.5 1 1.5
*| [pb]
θ
/d|cos
σ
d
0 50 100 150
ME+PS@NLO QCD (SHERPA)
ATLAS Preliminary
-1 = 13 TeV, 3.2 fb s
Data
> 450 GeV
-jet
γ
m + jet + X
γ →
pp jet| < 2.37
+y
γ
η
|
*|
θ
|cos
0 0.2 0.4 0.6 0.8
NLO/Data 0.5 1 1.5
Figure 3. Measured cross section for isolated-photon plus a jet production (dots) as a function of the invariant mass of the photon-jet system,mγ−jetand of the scattering angle in the center-of-mass frame, compared with the fixed-order NLO QCD calculations of Jetphox(left) and multi-leg NLO QCD plus parton shower predictions
from Sherpa(right) [10]. The bottom part of both figures shows the ratio of the NLO QCD prediction to the
measured cross section. The black error bars respresent the experimental uncertainties while the shaded bands are the theoretical uncertainties of the calculation.
does not depend on the used PDF set. The measureddσ/|cosθ∗|is consistent with the dominance of processes in which a quark has been exchanged.
2.3 Photon pair production
Measurements of a photon pair production has been studied at a center-of-mass energy of 8 TeV [11]. The leading and sub-leading photons are required to haveEγ(1)
T >40 GeV andE γ(2)
T >30 GeV re-spectevely and|ηγ|<2.37 both. Differential cross sections are mesured as functions of the main
vari-ables of the photon pair system, together with the trasverse component of the diphoton tri-momentum respect to the thrust axis (aT). The fixed-order QCD calculations of Diphox[12] and Resbos[13] at NLO, 2γNNLO at NNLO [14] are compared to the data. These predictions are unable to reproduce the measured cross sections: Resbosand Diphoxmiss higher orders, while the NNLO calculations of
2γNNLO improve the description, but are still insufficient to describe the data. The predictions of a
parton-level calculation of varying the jet multiplicity up to NLO1, matched to the parton shower algo-rithm in Sherpa2.2.1 provide a good description of the data. Figure 4 shows the comparison between
the measured differential cross section as a function ofaT and the fiducial cross section compared to
the different pQCD calculations.
1Theγγandγγ+1 parton processes are generated at NLO accuracy, whileγγ+2 and 3 partons are generated at LO.
10 102
[fb / GeV]
T
/da
σ
d
1
−
10 1 10
2
10
3
10
4
10 Data + stat. unc. Total exp. uncertainty
NNLO (NNLO) γ 2
SHERPA 2.2.1 (ME+PS at NLO)
-1
= 8 TeV, 20.2 fb s
ATLAS
0 50
0 1000
0.5 1 1.5
[GeV]
T
a
10 102
0.5 1 1.5
Theory / Data
Theory / Data
DIPHOX (qq/qg at NLO, gg at LO)
RESBOS (NLO + NNLL) Integrated fiducial cross section [pb]
0 5 10 15 20
Name and type of computation
Sherpa 2.2.1 (ME+PS merged at NLO) pb
-2.2 +3.1
16.4
DIPHOX (qq/qg at NLO, gg at LO) pb
-1.1 +1.5
10.7
RESBOS (full NLO + NNLL) 12.1 pb
NNLO (NNLO)
γ
2 pb
-0.9 +1.3
14.2
0.8 pb)
±
Data (16.8 band
σ
1
±
band
σ
2
±
ATLAS -1 = 8 TeV, 20.2 fb s
Figure 4. (Left) Differential cross section of the photon pair production as a function ofaT compared to the predictions of Diphox, Resbos, 2γNNLO and Sherpa2.2.1. At the bottom of each plot, the ratio of the prediction
to the data is shown. The ratio of Diphoxand Resbosto the data is also shown. The bars and bands around the
data and theoretical predictions represent the statistical and systematic uncertainties, estimated as described in the text [11]. Only the central values are shown for Resbos. (Right) Measured fiducial cross section compared
to the predictions. The green (yellow) band represents the one- (two-)standard deviation uncertainty, including both the statistical and systematic uncertainties in the measurement added in quadrature.
3 Jet production
3.1 Inclusive jet production at 8 TeV
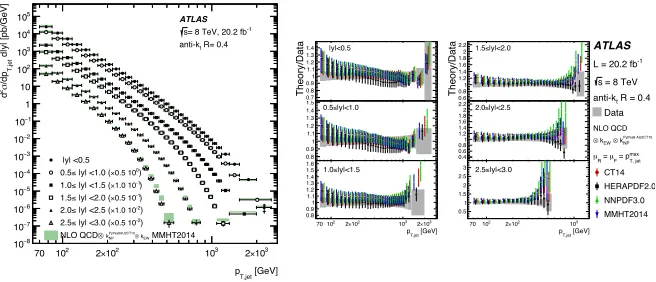
The inclusive jet cross-sections have been measured using the ATLAS 8 TeV dataset [15]. Jets are reconstructed with the anti-ktalgorithm with jet radius parameter values of R=0.4 and R=0.6, in the kinematic region of the jet transverse momentum frompT>70 GeV and|yjet|<3. The cross sections are measured double-differentially in the jet transverse momentum and rapidity, as shown in Figure 5
(left). A fair agreement has been found in the comparison between the measured cross sections and the fixed-order NLO QCD calculations for different PDF sets, shown in Figure 5 (right), corrected
for non-perturbative and electroweak effects, when considering the jet cross sections in individual jet
[GeV]
T,jet
p 70 102 2×10² 103 2×10³
d|y| [pb/GeV]
T,jet
/dp
σ
2d
8
− 10
7
− 10
6
− 10
5
− 10
4
− 10
3
− 10
2
− 10
1
− 10 1 10
2
10
3
10
4
10
5
10
|y| <0.5 ) 0 0.5 10
×
|y| <1.0 (
≤
0.5
) -1 1.0 10
×
|y| <1.5 (
≤
1.0
) -1 0.5 10
×
|y| <2.0 (
≤
1.5
) -2 1.0 10
×
|y| <2.5 (
≤
2.0
) -2 0.5 10
×
|y| <3.0 (
≤
2.5
MMHT2014
EW k
⊗
Pythia8AU2CT10 NP k
⊗
NLO QCD
ATLAS
-1
= 8 TeV, 20.2 fb s
R= 0.4
t
anti-k
Theory/Dat
a
0.7 0.8 0.91 1.1 1.2 1.3 1.4 |y|<0.5
0.8 0.91 1.1 1.2 1.3 1.4 1.5
|y|<1.0
≤
0.5
[GeV] T,jet p
70102 2×10² 103 2×10³
0.8 0.91 1.1 1.2 1.3 1.4 1.5 1.6
|y|<1.5
≤
1.0
Theory/Dat
a
0.6 0.81 1.2 1.4 1.6 1.82 2.2 1.5≤|y|<2.0
0.4 0.6 0.81 1.2 1.4 1.6 1.82 2.2 2.0≤|y|<2.5
[GeV] T,jet p
70102 2×10² 103
0.51 1.5 2 2.53 2.5≤|y|<3.0
ATLAS -1
L = 20.2 fb = 8 TeV s
R = 0.4
t
anti-k Data
NLO QCD Pythia8 AU2CT10
NP k
⊗ EW k
⊗ max T, jet = p F
µ
= R
µ
CT14 HERAPDF2.0 NNPDF3.0 MMHT2014
Figure 5. (Left) Inclusive jet cross-section at 8 TeV as a function of jetpT in bins of jet rapidity. The data are compared to the NLO QCD prediction with the MMHT2014 PDF set The error bars indicate the statistical uncertainty and the systematic uncertainty in the measurement added in quadrature. (Right) Ratio of the inclusive jet cross-section predicted by NLO QCD to the cross-section in data as a function of the jetpTin each jet rapidity bin. Shown are the predictions for different PDF sets. The error bars indicate the total theory uncertainty. The
grey band shows the total uncertainty in the measurement [15].
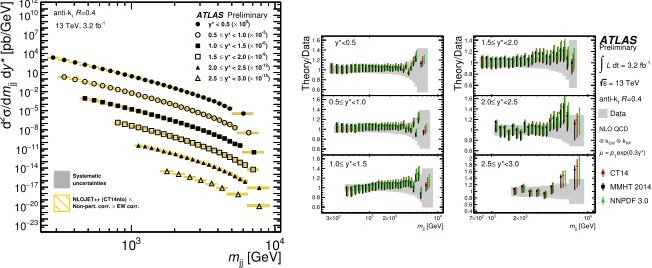
3.2 Inclusive and dijet production at 13 TeV
The inclusive jet and dijet cross sections have also been measured using the 3.2 fb−1ATLAS dataset at 13 TeV [16]. The jets are reconstructed using the anti-ktwith radius parameter R=0.4. The cross sec-tions were measured following the same method as for the 8 TeV analysis. The double-differentially
cross sections for the 13 TeV measurement are shown in Figure 6 (left). NLO and NNLO pQCD calculations for the inclusive jet measurement, corrected for non-perturbative and electroweak effects,
are compared to the measured cross sections. As for the 8 TeV measurement, a good agreement has been found when considering the jet cross sections in individual jet rapidity bins independently. No significant deviations between the inclusive jet cross sections and the fixed order NNLO QCD calcula-tions, corrected for non-perturbative and electroweak effects, are observed when using the transverse
[GeV]
T,jet
p 70 102 2×10² 103 2×10³
d|y| [pb/GeV] T,jet /dp σ 2d 8 − 10 7 − 10 6 − 10 5 − 10 4 − 10 3 − 10 2 − 10 1 − 10 1 10 2 10 3 10 4 10 5 10 |y| <0.5 ) 0 0.5 10 ×
|y| <1.0 (
≤ 0.5 ) -1 1.0 10 ×
|y| <1.5 (
≤ 1.0 ) -1 0.5 10 ×
|y| <2.0 (
≤ 1.5 ) -2 1.0 10 ×
|y| <2.5 (
≤ 2.0 ) -2 0.5 10 ×
|y| <3.0 (
≤ 2.5 MMHT2014 EW k ⊗ Pythia8AU2CT10 NP k ⊗ NLO QCD ATLAS -1
= 8 TeV, 20.2 fb s R= 0.4 t anti-k Theory/Dat a 0.7 0.8 0.91 1.1 1.2 1.3 1.4 |y|<0.5 0.8 0.91 1.1 1.2 1.3 1.4 1.5 |y|<1.0 ≤ 0.5 [GeV] T,jet p
70102 2×10² 103 2×10³
0.8 0.91 1.1 1.2 1.3 1.4 1.5 1.6 |y|<1.5 ≤ 1.0 Theory/Dat a 0.6 0.81 1.2 1.4 1.6 1.82 2.2 1.5≤|y|<2.0
0.4 0.6 0.81 1.2 1.4 1.6 1.82 2.2 2.0≤|y|<2.5
[GeV] T,jet p
70102 2×10² 103
0.51 1.5 2 2.53 2.5≤|y|<3.0
ATLAS -1
L = 20.2 fb = 8 TeV s
R = 0.4
t anti-k Data NLO QCD Pythia8 AU2CT10 NP k ⊗ EW k ⊗ max T, jet = p F µ = R µ CT14 HERAPDF2.0 NNPDF3.0 MMHT2014
Figure 5. (Left) Inclusive jet cross-section at 8 TeV as a function of jet pT in bins of jet rapidity. The data are compared to the NLO QCD prediction with the MMHT2014 PDF set The error bars indicate the statistical uncertainty and the systematic uncertainty in the measurement added in quadrature. (Right) Ratio of the inclusive jet cross-section predicted by NLO QCD to the cross-section in data as a function of the jetpTin each jet rapidity bin. Shown are the predictions for different PDF sets. The error bars indicate the total theory uncertainty. The
grey band shows the total uncertainty in the measurement [15].
3.2 Inclusive and dijet production at 13 TeV
The inclusive jet and dijet cross sections have also been measured using the 3.2 fb−1ATLAS dataset at 13 TeV [16]. The jets are reconstructed using the anti-ktwith radius parameter R=0.4. The cross sec-tions were measured following the same method as for the 8 TeV analysis. The double-differentially
cross sections for the 13 TeV measurement are shown in Figure 6 (left). NLO and NNLO pQCD calculations for the inclusive jet measurement, corrected for non-perturbative and electroweak effects,
are compared to the measured cross sections. As for the 8 TeV measurement, a good agreement has been found when considering the jet cross sections in individual jet rapidity bins independently. No significant deviations between the inclusive jet cross sections and the fixed order NNLO QCD calcula-tions, corrected for non-perturbative and electroweak effects, are observed when using the transverse
momentum of each jet,pjetT, as QCD scale, as shown in Figure 6 (right).
[GeV]
T
p
2
10 103
[pb/GeV] y dT p /d σ 2 d 23 − 10 20 − 10 17 − 10 14 − 10 11 − 10 8 − 10 5 − 10 2 − 10 10 4 10 7 10 10 10 12 10 201706241336 Preliminary ATLAS -1 13 TeV, 3.2 fb
=0.4 R t anti-k uncertainties Systematic EW corr. × Non-pert. corr. × NLOJET++ (CT14nlo) ) 0 10 ×
| < 0.5 ( y | ) -3 10 ×
| < 1.0 ( y | ≤ 0.5 ) -6 10 ×
| < 1.5 ( y | ≤ 1.0 ) -9 10 ×
| < 2.0 ( y | ≤ 1.5 ) -12 10 ×
| < 2.5 ( y | ≤ 2.0 ) -15 10 ×
| < 3.0 ( y | ≤ 2.5 Theory/Data0.6 0.8 1 1.2 1.4 1.6 1.8 |y|<0.5 0.7 0.8 0.9 1 1.1 1.2 1.3 1.4 1.5 0.5≤|y|<1.0
[GeV] T
p 2
10 2×10² 103 2×10³
0.7 0.8 0.9 1 1.1 1.2 1.3 1.4 1.5 |y|<1.5 ≤ 1.0 Theory/Data0.6 0.8 1 1.2 1.4 1.5≤|y|<2.0
0.6 0.8 1 1.2 1.4 1.6 1.8 2.0≤|y|<2.5
[GeV] T
p 2
10 2×10² 103 2×10³
0.5 1 1.5 2 2.5 3 |y|<3.0 ≤ 2.5 ATLAS Preliminary -1 dt = 3.2 fb
L ∫
= 13 TeV s =0.4 R t anti-k Data NLO QCD NP k ⊗ EW k ⊗ jet T p = F µ = R µ NLO MMHT 2014 NLO NNLO MMHT 2014 NNLO
Figure 6. (Left) Inclusive jet cross-section at 13 TeV as a function of jet pTin bins of jet rapidity. The data are compared to the NLO QCD prediction with the MMHT2014 PDF set The error bars indicate the statistical uncertainty and the systematic uncertainty in the measurement added in quadrature [16]. (Right) Ratio of the inclusive jet cross-section predicted by NLO (red) and NNLO (black) QCD predictions to the cross-section in data as a function of the jetpTin each jet rapidity bin. The error bars indicate the total theory uncertainty. The grey band shows the total uncertainty in the measurement.
In Figure 7 (left), the double-differential dijet production cross sections are presented as a function
of the dijet invariant mass from 300 GeV to 9 TeV and half absolute rapidity separation between the two leading jets (y∗), up toy∗ <3. A fair agreement has been found in the comparison between the
[GeV]
jj
m
3
10 104
[pb/GeV] y* djj m /d σ 2 d 23 − 10 20 − 10 17 − 10 14 − 10 11 − 10 8 − 10 5 − 10 2 − 10 10 4 10 7 10 10 10 12 10 201706241336 Preliminary ATLAS -1 13 TeV, 3.2 fb
=0.4 R t anti-k uncertainties Systematic EW corr. × Non-pert. corr. × NLOJET++ (CT14nlo) ) 0 10 ×
y* < 0.5 ( ) -3 10
×
y* < 1.0 (
≤ 0.5 ) -6 10 ×
y* < 1.5 (
≤ 1.0 ) -9 10 ×
y* < 2.0 (
≤ 1.5 ) -12 10 ×
y* < 2.5 (
≤ 2.0 ) -15 10 ×
y* < 3.0 (
≤ 2.5 Theory/Data0.6 0.8 1 1.2 1.4 1.6 y*<0.5 0.6 0.8 1 1.2 1.4 1.6 0.5≤ y*<1.0
[GeV] jj m 2 10 ×
3 103 2×10³ 104
0.6 0.8 1 1.2 1.4 1.6 y*<1.5 ≤ 1.0 Theory/Data0.6 0.8 1 1.2 1.4 1.5≤ y*<2.0
0.6 0.8 1 1.2 1.4 1.6 y*<2.5
≤ 2.0 [GeV] jj m 2 10 ×
7 103 2×10³ 104
0.4 0.6 0.8 1 1.2 1.4 1.6 1.8 2 y*<3.0 ≤ 2.5 ATLAS Preliminary -1 dt = 3.2 fb
L ∫
= 13 TeV s =0.4 R t anti-k Data NLO QCD NP k ⊗ EW k ⊗ exp(0.3y*) T p = µ CT14 MMHT 2014 NNPDF 3.0
Figure 7. (Left) Dijet cross-sections as a function ofmjjandy∗, for anti-ktjets with R=0.4. The shaded areas
indicate the experimental systematic uncertainties. The data are compared to NLO pQCD predictions calculated using NLOJET++with the CT14 NLO PDF set. The open boxes indicate the predictions with their
measured cross sections and the fixed-order NLO QCD calculations for different PDF sets, shown in
Figure 7 (right), corrected for non-perturbative and electroweak effects.
4 Transverse energy-energy correlations and
α
sextraction
Transverse energy-energy correlations and the relative asymmetries in multi-jet events have been mea-sured using the 8 TeV ATLAS dataset [17]. The data were binned in six intervals of the scalar sum of the transverse momenta of the two leading jets,HT2=pT1+pT2and compared to the NLO pQCD pre-dictions, corrected for hadronisation and multi-parton interaction effects. The comparison shows that
the data are compatible with the theoretical predictions, within the uncertainties. The results are then used to determine the strong coupling constantαsand its evolution with a chosed scaleQ=HT2/2, by means of aχ2fit to the theoretical predictions for both TEEC and ATEEC in each energy bin. The results of theχ2fit, together with other experiment determinations are shown in Figure 8. Moreover,
global fits to the TEEC and ATEEC data are performed, obtaining
αs(mZ)=0.1162±0.0011(exp.)−+00..00760061(scale)±0.0018(PDF)±0.0003(NP)
αs(mZ)=0.1196±0.0013(exp.)−+00..00610013(scale)±0.0017(PDF)±0.0004(NP)
respectively. The two values are in good agreement with the worls averageαs(mZ)=0.1181±0.0011. The presented results are limited by the theoretical scale uncertainties, which amounts to the 6 % (4 %) of the value ofαs(mZ) in the case of the TEEC (ATEEC). This uncertainty is expected to decrease as higher orders are calculated for the perturbative expansion.
Q [GeV] 2
10 103
(Q)s
α
0.08 0.09 0.1 0.11 0.12 0.13
0.14 TEEC 2012 Global fit World Average 2016 TEEC 2012 TEEC 2011
32
CMS R CMS 3-jet mass CMS inclusive jets CMS tt cross section D0 angular correlations D0 inclusive jets ATLAS
Q [GeV] 2
10 103
(Q)s
α
0.08 0.09 0.1 0.11 0.12 0.13
0.14 ATEEC 2012 Global fit World Average 2016 ATEEC 2012 ATEEC 2011
32
CMS R CMS 3-jet mass CMS inclusive jets CMS tt cross section D0 angular correlations D0 inclusive jets ATLAS
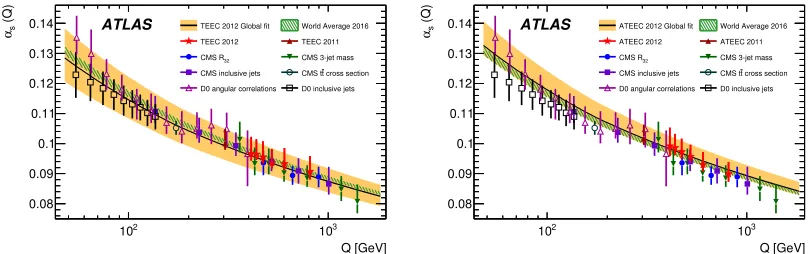
Figure 8. Comparison of the values of αs (Q) obtained from fits to the TEEC (left) and the ATEEC (right) functions at the energy scales given byHT2/2 (red star points) with the uncertainty band from the global fit (orange full band) and the 2016 world average (green hatched band). Determinations from other experiments are also shown as data points. The error bars, as well as the orange full band, include all experimental and theoretical sources of uncertainty. The strong coupling constant is assumed to run according to the two-loop solution of the renormalisation group equation [17].
5 Summary
measured cross sections and the fixed-order NLO QCD calculations for different PDF sets, shown in
Figure 7 (right), corrected for non-perturbative and electroweak effects.
4 Transverse energy-energy correlations and
α
sextraction
Transverse energy-energy correlations and the relative asymmetries in multi-jet events have been mea-sured using the 8 TeV ATLAS dataset [17]. The data were binned in six intervals of the scalar sum of the transverse momenta of the two leading jets,HT2=pT1+pT2and compared to the NLO pQCD pre-dictions, corrected for hadronisation and multi-parton interaction effects. The comparison shows that
the data are compatible with the theoretical predictions, within the uncertainties. The results are then used to determine the strong coupling constantαs and its evolution with a chosed scaleQ= HT2/2, by means of aχ2fit to the theoretical predictions for both TEEC and ATEEC in each energy bin. The results of theχ2fit, together with other experiment determinations are shown in Figure 8. Moreover,
global fits to the TEEC and ATEEC data are performed, obtaining
αs(mZ)=0.1162±0.0011(exp.)−+00..00760061(scale)±0.0018(PDF)±0.0003(NP)
αs(mZ)=0.1196±0.0013(exp.)−+00..00610013(scale)±0.0017(PDF)±0.0004(NP)
respectively. The two values are in good agreement with the worls averageαs(mZ)=0.1181±0.0011. The presented results are limited by the theoretical scale uncertainties, which amounts to the 6 % (4 %) of the value ofαs(mZ) in the case of the TEEC (ATEEC). This uncertainty is expected to decrease as higher orders are calculated for the perturbative expansion.
Q [GeV] 2
10 103
(Q)s
α
0.08 0.09 0.1 0.11 0.12 0.13
0.14 TEEC 2012 Global fit World Average 2016 TEEC 2012 TEEC 2011
32
CMS R CMS 3-jet mass CMS inclusive jets CMS tt cross section D0 angular correlations D0 inclusive jets ATLAS
Q [GeV] 2
10 103
(Q)s
α
0.08 0.09 0.1 0.11 0.12 0.13
0.14 ATEEC 2012 Global fit World Average 2016 ATEEC 2012 ATEEC 2011
32
CMS R CMS 3-jet mass CMS inclusive jets CMS tt cross section D0 angular correlations D0 inclusive jets ATLAS
Figure 8. Comparison of the values ofαs (Q) obtained from fits to the TEEC (left) and the ATEEC (right) functions at the energy scales given byHT2/2 (red star points) with the uncertainty band from the global fit (orange full band) and the 2016 world average (green hatched band). Determinations from other experiments are also shown as data points. The error bars, as well as the orange full band, include all experimental and theoretical sources of uncertainty. The strong coupling constant is assumed to run according to the two-loop solution of the renormalisation group equation [17].
5 Summary
In this paper high-precision measurements involving photons and jets at 8 TeV are presented together with the first results at 13 TeV. All the mesurements are in good agreement with the pQCD predictions
within the theoretical uncertainties, expecially those coming from missing higher order terms in the calculations. For the future, the ATLAS collaboration plans to improve these studies with higher statistics in order to explore the new energy regime opened by the LHC at 13 TeV and to provide valuable physics inputs to PDF andαsfits.
References
[1] T. Pietrycki and A. Szczurek,Photon-jet correlations in pp and pp collisions¯ , Phys. Rev. D 76, 034003 (2007).
[2] ATLAS Collaboration,The ATLAS Experiment at the CERN Large Hadron Collider, JINST 3 (2008) S08003.
[3] ATLAS Collaboration,Measurement of the cross section for inclusive isolated-photon production in pp collisions at √s=13TeV using the ATLAS detector, Phys. Lett. B 770 (2017) 473.
[4] T. Sjostrand, S. Mrenna and P. Z. Skands,A Brief Introduction to PYTHIA 8.1, Commun. 178 (2008) 852, arXiv:0710.3820.
[5] T. Gleisberg et al.,Event generation with SHERPA 1.1, JHEP 02 (2009), p. 7. 10.1088/
1126-6708/2009/02/007.
[6] S. Catani, M. Fontannaz, J. Ph. Guillet and E. Pilon,Cross section of isolated prompt photons in hadron-hadron collisions, arXiv:hep-ph/0204023.
[7] ATLAS Collaboration,High-ET isolated-photon plus jets production in pp collisions at √s =8
TeV with the ATLAS detector, Nucl. Phys. B 918 (2017) 257.
[8] S. Catani, Y.L. Dokshitzer, M.H. Seymour and B.R. Webber,Longitudinally invariant Kt cluster-ing algorithms for hadron hadron collisions, Nucl. Phys. B 406 (1993) 187.
[9] C.F. Berger et al.,An Automated Implementation of On-Shell Methods for One-Loop Amplitudes, Phys. Rev. D 78 (2008) 036003.
[10] ATLAS Collaboration, First measurement of isolated-photon plus jet production in pp collisions at √s = 13 TeV with the ATLAS detector, ATLAS-CONF-2017-059,
https://atlas.web.cern.ch/Atlas/GROUPS/PHYSICS/CONFNOTES/ATLAS-CONF-2017-059/.
[11] ATLAS Collaboration,Measurements of integrated and differential cross sections for isolated photon pair production in pp collisions at √s=8TeV with the ATLAS detector, Phys. Rev. D 95
(2017) 112005.
[12] T. Binoth, J. P. Guillet, E. Pilon and M. Werlen, A Full next-to-leading order study of direct photon pair production in hadronic collisions, Eur. Phys. J. C 16 (2000) 311.
[13] C. Balaza, E. Berger, P. Nadolsky and C.-P. Yuan,All-orders resummation for diphoton produc-tion at hadron colliders, Phys. Lett. B 637 (2006) 235.
[14] S. Catani, L. Cieri, D. de Florian, G. Ferrera and M. Grazzini,Diphoton production at hadron colliders: a fully-differential QCD calculation at NNLO, Phys. Rev. Lett. 108 (2012) 072001.
[15] ATLAS Collaboration,Measurement of the inclusive jet cross-sections in proton–proton colli-sions at √s=8 TeV with the ATLAS detector, JHEP 09 (2017) 020.
[16] ATLAS Collaboration,Measurement of inclusive-jet and dijet cross-sections in proton-proton collisions at 13 TeV centre-of-mass energy with the ATLAS detector, ATLAS-CONF-2017-048, https://atlas.web.cern.ch/Atlas/GROUPS/PHYSICS/CONFNOTES/ATLAS-CONF-2017-048.
[17] ATLAS Collaboration,Determination of the strong coupling constantαsfrom transverse
![Figure 1. Ratio of the NLO pQCD predictions from Jetphox based on the MMHT2014 PDFs to the measuredcross sections for isolated-photon production (solid lines) as a function of Eγ in four bins [3]](https://thumb-us.123doks.com/thumbv2/123dok_us/8041405.1338933/3.482.66.395.157.318/figure-predictions-jetphox-measuredcross-sections-isolated-production-function.webp)