87
Performance Study of H-Rotor Vertical Axis Wind
Turbine Blade for different Angles of Attack
Ch. Indira Priyadarsini
1, T. Ratna Reddy
2, Vutukuru Srilaxmi Shilpa
3, A Akhil
4Faculty1,2, P.G Students3,4, Mechanical Engg.Dept1,2,3,4,CBIT1,2,3,4 Email: [email protected]1 [email protected] 3
Abstract- This paper evaluates the aerodynamic performance of different wind turbine blade profiles. The flow analysis was performed on four symmetrical airfoils namely NACA 0012, NACA 0015, NACA 0018 and NACA 0024. The simulations were performed at various angles of attack keeping the wind velocity constant. The results of lift force drag force, velocity and pressure contours for different NACA blades are compared and numerical power values are calculated for all the four airfoils at various angles of attack. Comparing the results obtained NACA 0024 was identified as the better airfoil, hence was chosen for a 3 bladed H-Rotor type VAWT for further analysis. The performance of H-Rotor type VAWT was characterized by torque and power. For this purpose, AUTOCAD & ANSYS FLUENT-18.0 commercial soft wares are used to design the flow field to carry 2D modeling and CFD analysis respectively.
Keywords: VAWT, Angle attack, NACA, H-Rotor
1. INTRODUCTION
The Indian renewable energy sector is the second most attractive renewable energy market in the world as per the renewable energy attractiveness index 2017. Power generation from renewable energy sources in India reached 93.21 billion units in FY18 (up to February 2018). India has the fourth largest installed capacity of wind power. This has been proving to be the major thrust for the sector in India as the market players have sufficient incentives to move to clean source. The emphasis on using renewable energy sources is growing rapidly as the prices of many fossil fuels continue to be volatile and the repercussions of not addressing and not mitigating carbon dioxide
emissions becomes more impactful on the
environment. Additionally, as countries develop, they tend to use more energy per capita. Thus, it is important to find pathway to meet the worlds’ energy needs without drastically changing the population’s
energy-use habits. The application and
commercialization of small-scale wind energy can provide sustainable clean energy a viable option for constituents of both developing and developed countries while contributing towards the reduction of carbon dioxide emissions. The use of wind turbines increases the potential for a more environment friendly sustainable energy supply. As of 2015, Denmark generates 40% of its electric power from wind, and at least 83 other countries around the world are using wind power to supply their electric power grids. In 2014, global wind power capacity expanded 16% to 369,553 MW. Yearly wind energy production is also growing rapidly and has reached around 4% of worldwide electric power usage, 11.4% in the EU.
2. LITERATURE REVIEW
88
investigation of "CL and CD values" for lower Reynolds number, 1000 and 5000 has been carried out. The values of CL and CD at lower Reynolds number is much important in analysis of Darrieus and horizontal axis type of wind turbine blade, still in these values are not available from literature reviewed. From CFD analysis it is concluded that as Reynolds number increase lift forces and drag forces increases. NACA0012 provides maximum lift and drag at higher.
Reynolds number. Ankan Dash [6] carried out the analysis of NACA0012 wind turbine airfoil at various angles of attack (4,6,8,10 degrees), keeping the Reynolds number constant. The geometry and analysis were done using ANSYS-FLUENT. Calculations were done for constant air velocity altering only the angle of attack. For the computational domain an unstructured mesh with sphere of influence and inflation was selected, taking care of the refinement of the grid near the airfoil in order to enclose the boundary layer approach. The CFD simulation results show close agreement with the results obtained from wind tunnel testing experiments, thus suggesting CFD analysis as a reliable alternative to experimental methods. Mohamed [7] improved the design performance of H-rotor Darrieus turbine for wind energy conversion. For this purpose, 20 different symmetric and non-symmetric airfoils have been investigated by
two-dimensional Computational Fluid Dynamics.
Moreover, he proved that the optimal configuration of H-rotor Darrieus turbine involving S-1046 appears to be very promising for wind energy generation, in particular in urban areas. Ferreira et al.
[8] focused on the numerical simulation of a single-bladed VAWT through the comparison with experimental measurements and PIV data. This demonstrated the DES model which was able to provide a good representation of the development of dynamic stall. Wang and Tao [9] also performed a two-dimensional numerical investigation of the phenomenon of deep dynamic stall for a low Reynolds number flow over a NACA 0012. They compared k-u SST model with low Reynolds number correction and the v2-f model. They found that the RANS approach was good for fast design or research of low Reynolds number airfoils.
Kumar et al. [10] suggested a low Reynolds number VAWT design and optimization procedure based on both CFD and BEM (The Boundary Element Method) calculations. Castelli et al. [11,12] presented a model for the evaluation of rotor performance and aerodynamic forces on a single-bladed helical VAWT. Moreover, they also introduced a validation study for a CFD code for a Darrieus micro-VAWT. Castelli and Benini [13] presented again a two-dimensional CFD analysis of the effect of airfoil thickness on a straight-bladed Darrieus-type VAWT. They performed
complete simulations based on full RANS unsteady calculations on a three bladed rotor for two different blade profiles; NACA 0012 and NACA 0021. S. Brusca et al. [14] analyzed the link between the aspect ratio of a vertical-axis straight-bladed (H-Rotor) wind turbine and its performance. This numerical analysis highlighted how turbine performance is strongly influenced by the Reynolds number of the rotor blade. From geometrical point of view, as aspect ratio falls, the Reynolds number rises which improves wind turbine performance.
3. NUMERICAL ANALYSISNumerical
analysis and comparison of different wind turbine blades
ANSYS Fluent software contains the broad physical modeling capabilities needed to model flow, turbulence, heat transfer, and reactions for industrial applications—ranging from air flow over an aircraft wing to combustion in a furnace, from bubble columns to oil platforms, from blood flow to semiconductor manufacturing, and from clean room design to wastewater treatment plants. Fluent covers a
broad reach, including special models with
capabilities to model in-cylinder combustion, aero-acoustics, turbomachinery and multiphase systems.
The present study was aimed to analyze the flow field for different symmetrical airfoils namely NACA 0012, NACA 0015, NACA 0018 and NACA 0024 at various angle of attack starting from 0⁰ to 20⁰ whereas the wind velocity 10 m/s was kept constant. The flow was obtained by solving the steady-state governing equations of continuity and momentum conservation with Standard − turbulence model and the results were analyzed by comparing the values of numerical power of the turbine at all angles of attack for all the four airfoils.
Description of airfoil
The airfoils were developed by the National Advisory Committee for Aeronautics. In the NACA airfoils four digits describe that
1. The first digit represents max camber as percentage of the chord.
2. The second digit represents a distance of max
camber from the airfoil leading edge.
3. The last two digits represent the thickness of the airfoil.
4. MATERIALS AND METHODS
4.1 Selection of airfoils
89
wind turbines commonly used symmetrical airfoils are NACA 0012,0015, 0018, and NACA 0024.
For numerical simulations, above mentioned airfoils were selected. The coordinates of all symmetrical airfoils were obtained from NASA website for
simulations. These coordinates were used in
AUTOCAD software to generate smooth and accurate airfoil profiles and these profiles were imported into CFD FLUENT.
[image:3.612.350.542.90.365.2]Fig.4.1 shows the actual profiles of above mentioned NACA 0012 to 0024 airfoils which are generated in AUTOCAD software.
Fig 4.1:Profiles of airfoils NACA0012, 0015, 0018 and 0024 The creation of domain and mesh generation was done by using ANSYS FLUENT 18.0. The 2D computational mesh is designed using FLUENT. In CFD calculations, it uses a finite volume method.
4.2 Description of the numerical flow field
The appropriate size of the computational domain has been investigated to eliminate the effect of the domain size on the results. In this numerical analysis the computational domain used was same for all the NACA 0012, 0015, 0018 and 0024 airfoils. The chord length(C) of all the four airfoils is considered as 1m. The dimensions of flow domain are based on chord length, that is X max = 4C, X min= 2C, Y min=2C, Y max=2C. In the beginning computational domain is
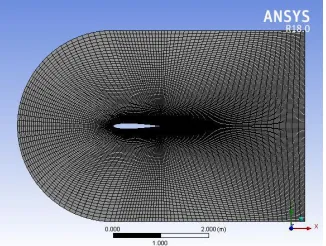
[image:3.612.64.304.218.314.2]generated by using AUTOCAD software and the same is imported in to CFD FLUENT. This domain is further divided into four parts in GEOMETRY modeling in order to obtain desired quality mesh. With the above step creation of computational domain is done to carry out meshing and flow analysis of all the four airfoils. The below figure 4.2 shows how the computational domain is created for NACA airfoils.
Fig.4.2: Computational domains of airfoils NACA0012, 0015, 0018 and 0024
Inlet has been set as a velocity inlet, with a constant wind velocity profile of 10 m/s, while, outlet has been set as a pressure out.4.3 Domain meshing
A Quad Dominant and fine mesh has been chosen for the whole computational domain in ANSYS-FLUENT meshing tools. This type of mesh is selected in order to reduce the computational time and increasing the accuracy in spite of increasing the preparation time of the CFD simulations. The mesh of the domain has approximately the same characteristics cell size to obtain faster convergence. Same procedure is followed for NACA 0012, 0015, 0018 and 0024. Fig 4.4 gives closer view of fine and quality mesh obtained for NACA 0012 airfoil. The same options were used while meshing all the four airfoils.
[image:3.612.329.492.595.718.2]90
4.4 Input and boundary conditions
The problem consists of flow around an airfoil at various angles of attack (0⁰ to 20⁰) keeping the velocity constant. The chord length(C) of all the four
airfoils is considered as 1m. Table 4.1 shows input and boundary conditions of numerical simulations. Table.4.1 Input and boundary conditions
S. INPUT VALUE
No.
1. Fluid medium Air
2. Velocity of air flow 10 m/s
3. Operating pressure 101325 Pa
4. Density of fluid 1.225 kg/m3
5. Reynolds number 6×10⁵
6. Chord length 1 m
7. Model Standard k- ɛ
8. Angles of attack 0⁰ to 20⁰
9. Radius of Rotor 1 m
4.5 Numerical solution
A finite volume CFD solver ANSYS FLUENT is used in this work, that implements Reynolds averaged Naviere Stokes equations. For analysis, the solver is 2D- pressure based, the viscous model is standard k- ɛ model. In solution methods, for pressure velocity coupling SIMPLE algorithm was chosen for analysis of all the four airfoils. In Spatial Discretization, gradient is Least square cell based, for pressure
SECOND ORDER is used and
SECONDORDER UPWIND discretization is used for momentum equation
5. RESULTS AND DISCUSSION
5.1 Numericalanalysis and comparison of
different wind turbine blades
5.1.1 Calculations
After the Post Processing using FLUENT, all the results of lift forces and drag forces along with coefficients of lift and drag were obtained and calculations were done to get numerical Power of VAWT using lift and drag forces. While doing calculations angle of attack was varied from 0⁰ to 20⁰ keeping wind velocity constant at 10 m/s and value of number of rotations was considered as 50 rpm.
From FLUENT software we get the values of FL= 16.366 N
FD = 0.676 N
Resultant Force = FR= (FD2 + FL2) 0.5 = 16.379 N
Blade Angular Velocity = ω = 2 ×π × N / 60 = 5.235 rad/sec
At α =7.5⁰, N =50 rpm, R= 1 m, the values of numerical Power
for a Vertical Axis Wind Turbine are calculated using the below
formula. Power = PN = Torque × ω
= FR× R ×ω
= 85.69 W
The same procedure is followed for all the NACA profiles at different angles of attack from 0⁰ to 20⁰. With the help of CFD software
Ansys-Fluent, successful analysis of
aerodynamic performance of
NACA0012,0015,0018 and 0024 airfoils have been carried at various angles of attack keeping wind velocity constant and using the Standard – turbulence model. Fig. 5.1 and Fig 5.2 clearly show that the values of lift force and lift coefficient were increased with the increase in the value of angle of attack. This led to rise in drag force and drag coefficient as well, but the increase in drag force and drag coefficient is quite low in comparison to lift force and lift coefficient.
91
[image:5.612.229.390.99.181.2]Fig 5.1:Graph of Angle of Attack vs Coefficient of Lift
Fig 5.2: Graph of Angle of Attack vs Coefficient of Drag
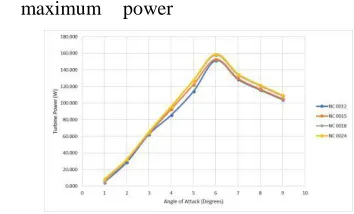
Numerical values of Turbine power were calculated for all the four airfoils at various AoA that is from 0 to 20 degrees. It was clear that NACA0024 was the optimum blade profile for maximum power
generation and it occurred at an angle of attack 12.5⁰. Fig. 5.3 shows the variation of power from the turbine with the angle of attack.
Fig 5.3: Graph of Angle of Attack vs Turbine Power
5.1.2 Contours of pressure and velocity magnitudes
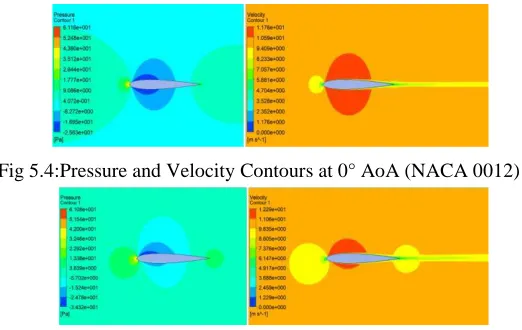
The contours of pressure and velocity magnitudes were obtained for various angles of attack from CFD simulations. It is observed that the flow accelerates on the upper side of the airfoil and the velocity of flow decreases along the lower side, according to Bernoulli’s principle the upper surface will experience low pressure and the lower surface will experience higher pressure. Hence the value of lift coefficient will increase and the value of drag coefficient will also increase but the increase in drag is low in comparison to the increase in lift force. As
the pressure on the lower surface of the airfoil is greater than that of the incoming flow stream, the airfoil is effectively pushed upward normal to the incoming flow stream.
On the leading edge, we can see the stagnation point where the velocity of flow is nearly zero. The fluid accelerates on the upper surface of the airfoil while the velocity of the fluid decreases along the lower surface of the airfoil.
[image:5.612.223.390.235.336.2] [image:5.612.201.378.391.498.2]92
Fig 5.4:Pressure and Velocity Contours at 0° AoA (NACA 0012)
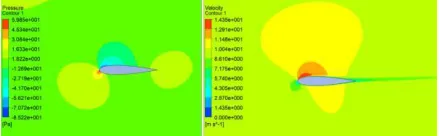
Fig 5.5:Pressure and Velocity Contours at 2.5° AoA (NACA 0012)
[image:6.612.181.442.111.276.2]
Fig 5.6:Pressure and Velocity Contours at 5° AoA (NACA 0012)
[image:6.612.195.415.521.594.2]Fig 5.7:Pressure and Velocity Contours at 7.5° AoA (NACA 0012)
Fig 5.8:Pressure and Velocity Contours at 10° AoA (NACA 0012)
[image:6.612.198.415.624.702.2]93
Fig 5.10:Pressure and Velocity Contours at 15° AoA (NACA 0012)
The figures from 5.11 to 5.17 displays the pressure and velocity contours of NACA0015 at various Angles of Attack.
Fig 5.11:Pressure and Velocity Contours at 0° AoA (NACA 0015)
Fig 5.12:Pressure and Velocity Contours at 2.5° AoA (NACA 0015)
[image:7.612.166.458.250.665.2]Fig 5.13:Pressure and Velocity Contours at 5° AoA (NACA 0015)
[image:7.612.204.424.635.703.2]Fig 5.14:Pressure and Velocity Contours at 7.5° AoA (NACA 0015)
94
[image:8.612.206.429.127.196.2]
Fig 5.16:Pressure and Velocity Contours at 12.5° AoA (NACA 0015)
Fig 5.17:Pressure and Velocity Contours at 15° AoA (NACA 0015)
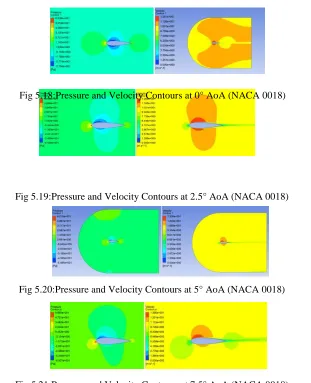
The figures from 5.18 to 5.24 displays the pressure and velocity contours of NACA0018 at various Angles of Attack.
[image:8.612.199.423.230.299.2][image:8.612.158.469.342.725.2]
Fig 5.18:Pressure and Velocity Contours at 0° AoA (NACA 0018)
Fig 5.19:Pressure and Velocity Contours at 2.5° AoA (NACA 0018)
Fig 5.20:Pressure and Velocity Contours at 5° AoA (NACA 0018)
[image:8.612.177.445.350.500.2]95
[image:9.612.212.434.137.203.2]
Fig 5.22:Pressure and Velocity Contours at 10° AoA (NACA 0018)
Fig 5.23:Pressure and Velocity Contours at 12.5° AoA (NACA 0018)
Fig 5.24:Pressure and Velocity Contours at 15° AoA (NACA 0018)
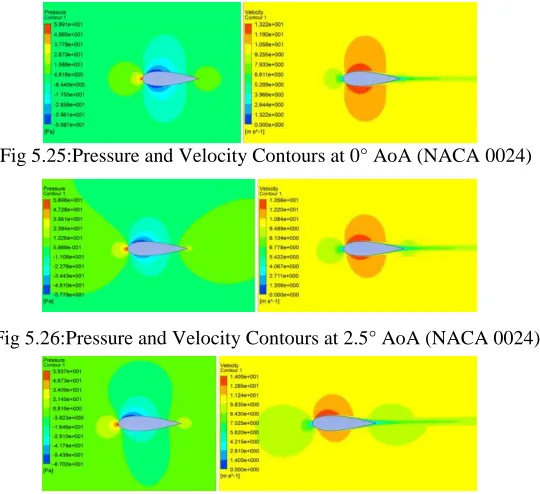
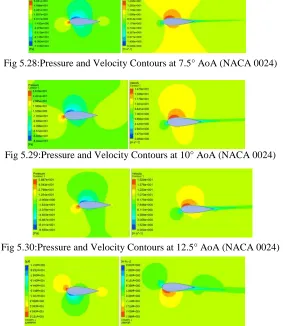
The figures from 5.25 to 5.31 displays the pressure and velocity contours of NACA0024 at various Angles of Attack.
[image:9.612.177.447.457.704.2]Fig 5.25:Pressure and Velocity Contours at 0° AoA (NACA 0024)
Fig 5.26:Pressure and Velocity Contours at 2.5° AoA (NACA 0024)
96
[image:10.612.195.419.140.202.2]
Fig 5.28:Pressure and Velocity Contours at 7.5° AoA (NACA 0024)
Fig 5.29:Pressure and Velocity Contours at 10° AoA (NACA 0024)
Fig 5.30:Pressure and Velocity Contours at 12.5° AoA (NACA 0024)
[image:10.612.170.453.150.476.2]97
6. CONCLUSIONS
The following conclusions emerge from this study.
1) CFD analysis was done using
two-dimensional modeling for the NACA
symmetrical airfoils.
2) Performance characteristics of NACA 0012, 0015, 0018 and 0024 were compared.
3) It was observed that value of numerical power increases as angle of attack increases from 0⁰ to 12.5⁰, after 12.5⁰ the value of numerical power reduced. Hence critical angle of attack for this blade is 12.5⁰ at air velocity 10 m/s.
4) NACA 0024 blade can generate maximum
power of 160 W at angle of attack 12.5⁰ and velocity of air 10 m/s and was chosen as a better airfoil to use in H-Rotor VAWT.
REFERENCES
[1] H. V. Mahawadiwar,V.D. Dhopte,
P.S.Thakare, Dr. R. D. Askhedkar. CFD Analysis of Wind Turbine Blade, International Journal of Engineering Research and Applications, May-Jun 2012; PP- 3188-3194.
[2] Ji Yao, Jianliang Wang, Weibin-Yuan,
Huimin Wang, Liang Cao. Analysis on the Influence of
Turbulence Model Changes to Aerodynamic
Performance of Vertical Axis Wind Turbine, ELSEVIER, International Conference on Advances in Computational Modeling and Simulation, Procedia Engineering 2012; 31:274-281.
[3] Chris Kaminsky, Austin Filush, Paul
Kasprzak and Wael Mokhtar, A CFD Study of Wind Turbine Aerodynamics, Proceedings of ASEE North Central Section Conference 2012.
[4] T. Ravikumar Reddy, B.E. Kumar, Effect of Blade Thickness of Vertical Axis Wind Turbine on Power Generation, International Journal of Engineering Research & Technology (IJERT) 2014; Vol. 3 Issue 10: 2278-0181.
[5] Bhushan S. Patil, Hitesh R. Thakare,
Computational Fluid Dynamics Analysis of Wind Turbine Blade at Various Angles of Attack and different Reynolds Number, Procedia Engineering 2015; 127:1363-1369.
[6] Ankan Dash, CFD Analysis of Wind Turbine
Airfoil at Various Angles of Attack, IOSR Journal of
Mechanical and Civil Engineering (IOSR-JMCE)2016; 13:18-24.
[7] M.H. Mohamed. Performance investigation
of H-rotor Darrieus turbine with new airfoil shapes, Energy 47 (1), November, 2012; 522e530.
[8] S. Ferreira, H. Bijl, G. van Bussel, G. van Kuik. Simulating dynamic stall in a 2DVAWT: modeling strategy, verification and validation with particle image velocimetry data, the science of making torque from wind, J. Phys. Conf. Ser.75 (2007).
[9] S. Wang, Z. Tao, L. Ma, D. Ingham, M.
Pourkashanian. Numerical investigations on dynamic stall associated with low Reynolds number flows over airfoils, in:2nd International Conference on Computer Engineering and Technology (ICCET), 16e18 April, 2010. Chengdu (China).
[10] V. Kumar, M. Paraschivoiu, I. Paraschivoiu. Low Reynolds number vertical axis wind turbine for Mars, June 2010; Wind Eng. 34 (4).
[11] M.R. Castelli, E. Benini. Effect of blade inclination angle on a Darrieus wind turbine, October 2011; Journal of Turbomach. 133.
[12] M.R. Castelli, G. Pavesi, E. Benini, L. Battisti, G. Ardizzon. Modeling strategy and numerical validation for a Darrieus vertical axis micro-wind turbine, in: Proceedings of the ASME 2010 International Mechanical Engineering Congress & Exposition, 12e18 November 2010, Vancouver, British Columbia; IMECE2010-39548.
[13] M.R. Castelli, E. Benini. Effect of blade thickness on Darrieus vertical-axis wind turbine performance, in: CSSim 2011, 2nd International Conference on Computer Modelling and Simulation, 5e7 September 2011, Brno (Czech Republic).
[14] S. Brusca • R. Lanzafame • M. Messina. Design of a vertical-axis wind turbine: how the aspect ratio affects the turbine’s performance, Int J Energy Environ Eng, 2014; 5:333–340.