2018 International Conference on Applied Mechanics, Mathematics, Modeling and Simulation (AMMMS 2018) ISBN: 978-1-60595-589-6
Brain Tumor Segmentation from Multi-modality MRI Data
Based on Tamura Texture
Na LI
*and Zhi-yong XIONG
College of Computer Sciences, South-Central University for Nationalities, Wuhan, China
*Corresponding author
Keywords: Brain tumor segmentation, Multi-modality MRI data, Tamura texture, BP neural network.
Abstract. A segmentation algorithm of brain tumor MR image based on Tamura texture feature and BP Neural Network is proposed in this paper. Firstly, the local grayscale features of four modal MR images are combined with the Tamura texture metrics in the algorithm. The information in the image is extracted as much as possible. Then, the known samples are input into the BP Neural Network and classifier training is performed. Finally, other brain tumor images are processed with the trained BP Neural Network. The experiment was performed on the images of 30 patients. From the obtained data, the method proposed in this paper can segment the brain tumor region accurately and effectively and show strong self-adaptability to the difference of the brain tumor images.
Introduction
Magnetic Resonance imaging technology has high resolution of soft tissue, accurate description of the anatomy of the brain, and important significance in the diagnosis, treatment and surgical guidance of brain tumors [1]. MRI images should be fully interpreted to provide quantitative information for clinical diagnosis and treatment. To complete the above steps, the MRI image is to be accurately segmented at first, and then the segmentation domain is quantified. In current clinical routine, this task involves manual annotation and segmentation of large amount of multimodal MRI images. However, since manual segmentation is a very time consuming procedure, development of robust automatic segmentation methods, to provide efficient and objective segmentation, became an interesting and popular research area in recent years [2].
MR imaging of brain tumor patients is a three-dimensional multi-band imaging, usually including four modes of FLAIR, T1, T2, and T1C. Different modes provide different brain tumor information [3]. In clinical practice, multimodal MRI images are combined by doctors to perform tumor segmentation. Computer-assisted software is used during segmentation to manually delineate tumor regions layer by layer. Such operations are subjective and have poor repeatability [4].
Common automatic or semi-automatic tumor segmentation methods are mostly based on image gray information. Such as fuzzy clustering method [4], level set method [5], AdaBoost iteration method [6], SVM method [7] and neural network method [8]. The information contained in an image is complex. Almost images contain gray and texture information. When identifying the images, human never distinguish between gray information and texture information. Papers [9-11] have shown that combining gray (color) information with texture information to segment the image can obtain better segmenting effect and higher robustness than those obtained with the use of only gray information or only texture information. In this paper, the gray information and texture information formed high-dimensional features for each pixel. BP neural network algorithm is used to train samples to obtain the optimal classifier. Then, the well-trained BP neural network model is used to process other brain tumor images.
Feature Extraction Based on Tamura
and degree of roughness [12]. Experiments show that contrast, directionality and roughness are more important than others. They are also used as texture information in this paper. A given brain tumor image, Ikhw {0,1, 2, ,L1},where k[1,K], h[1,H], w[1,W],Kis value of the sequence,
H is the height, Wis the width, and L is the pixel (voxel) gray level.
Roughness
The results show that the metric proposed by Tamura is the best in expressing image roughness. Index quantification is replaced by linear quantification in the paper [13]. This method reduces the complexity of the algorithm. The amount of data in the image is very large, this method is also used in this paper. The roughness of this paper is calculated as follows:
(a)The gray mean value of 3*3 pixel area is calculated, marked as
2
( , , ) ( , , ) / (2 1)
h n w n
n
i h n j w n
A k h w f k i j n
(1)Where n1, 2,3, 4,5, f k i j( , , ) is the gray value of the pixel located in the sequence k.
(b)Assuming that the pixel is ( , , )k h w , the average grayscale variance is calculated as follows.
, ( , , ) ( , , ) ( , , )
n u n n
E k h w A k h n w A k h n w
(2)
, ( , , ) ( , , ) ( , , )
n v n n
E k h w A k h w n A k h w n
(3) Equation (2) is to calculate the vertical direction, equation (3) is the vertical direction.
(c)The value of E is calculated, and the value of n corresponding to the maximum E value is found. This is regardless of direction, whether horizontal or vertical.
(d)The average roughness of the neighborhood sized 3 3 is calculated as follows.
(e)The absolute value of the difference between the roughness and the average roughness is the roughness measure of the pixel ( , , )k h w .
Contrast
Contrast refers to the difference between the brightest part and the darkest part, which can be obtained by statistical analysis of the gray distribution around the pixel. The contrast of this paper is calculated as follows:
(a)Taking the pixel ( , , )k h w as the center, the average grayscale value of a pixel block with a neighborhood size of 3 3 is counted, marked as Avggray( , , )k h w .
(b)The fourth moment of the neighborhood gray value are counted, and the neighborhood size is3 3 pixel area, marked as M k h w4( , , ).
(c)The average grayscale variance of 3 3 pixel area is calculated, marked as M k h w( , , ). (d) The value of M k h w( , , ) divided by 1/4
4( , )
M h w is The contrast value of pixel( , , )k h w .
Directionality
Directionality is an important feature of an image. Some texture images have no obvious directionality, and some texture images have obvious directionality. Tamura uses directionality to measure the apparent directionality of the image.
(a)Calculate the gradient vector at each pixel, the modulus and direction of the vector are calculated, marked as G k h w( , , ) and ( , , )k h w [12].
(b)The direction angle of the pixel is '[12].For images with no obvious direction, the value of
'
will change little. There is a parameter t in the expression of '.There are many ways to find the
(c)The mean value of the direction angles of all the pixels is calculated, and these pixels are pixels in the pixel( , , )k h w and its neighborhood size of 3 3 , marked as Avgdir( , , )k h w .
(d)The direction Angle of the pixel ( , , )k h w subtracts the average direction Angle is the measure of the degree of direction of the pixel.
The above-mentioned roughness, contrast, orientation characteristics and gray scale characteristics in four modes are normalized to an integer of 0-1. The grayscale feature values included the grayscale value of a certain pixel ( , , )k h w , the average grayscale value and the average grayscale difference of the pixel ( , , )k h w its neighbor is a 3 3 pixel block, ,the average grayscale value and the average grayscale difference of the pixel ( , , )k h w its neighbor is a5 5 pixel block. The texture information and gray information of the pixel are the information describing the Ikhw of the image block.
Automated Brain Tumor Segmentation from Multi-modality MRI Data Based on Tamura Texture Feature and BP Neural Network
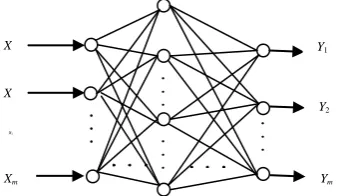
[image:3.595.230.399.328.426.2]BP neural network, the multi-layer feedforward neural network, its core idea is to use the known samples to train the network model, and then apply the trained neural network to the unknown samples to be processed. The structure is shown in figure 1:
Figure 1. BP network structure.
In Figure 1, X1, X2,X3 are input signals, Y1, Y2 ,Y3are output signals, and the BP neural network
includes an input layer, an implicit layer and an output layer, and is a neural network having three or more layers of neurons. The input signal will propagate forward to the hidden layer neuron. After the action function, the output information of the hidden layer neurons will be propagated to the output neurons, and the output will be given. The transfer functions of each layer usually use the Sigmoid type function, whose input and output relations are highly nonlinear mapping relations. By adjusting the connection weight and network scale of the BP neural network, clustering and other problems can be realized, and any nonlinear function can be approximated with arbitrary precision.
The MR image of brain tumor is segmented with BP neural network. The first step is to select the sample point. The choice of the training sample is very important and directly affects the search of the optimal classifier. In this paper, the uniform sampling method can be used to obtain representative samples and greatly prevent periodic deviations. MR sequence images are complexity, the image sampling window is set to Ws 7, and new sampled images are generated every seven rows and seven
columns in the image Ikhw. In this way, a sequence will contain
2
( ) /
x s
N HW W pixels of information, greatly improving the efficiency of the algorithm. The specific division steps are as follows:
(a)Grayscale and Tamura texture features are extracted from the image.
(b)Uniform sampling is performed and the BP neural network model is trained.
(c) The pixels are divided into tumor area pixels and background area pixels by using the trained BP neural network model;
(d) Morphological manipulations corrected the tumor area and get the segmented image.
X
1
X
2
X1
Xm
Y2
Y1
Experimental Results and Analysis
The clinical data of 30 patients (unknown patient age and gender) provided by MICCAI BRATS 2013 (https://www.virtualskeleton.ch/BRATS/Start2013) were selected as experimental data. Each of the 30 sets of data contains four modal images and the segmentation results completed by the experts. The four modes of image include FLAIR, T1, T2, and T1C images. These brain tumors are different in locations, sizes, and shapes according to these data.In order to evaluate the segmentation performance, Dice similarity coefficient, Sensitivity, and Predictive positivity value (PPV) are used to evaluate the segmentation results.
[image:4.595.134.475.187.480.2]
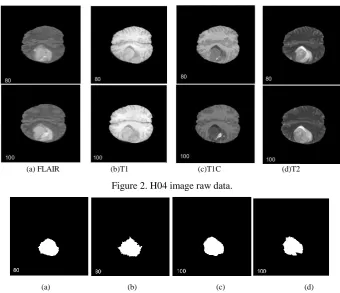
(a) FLAIR (b)T1 (c)T1C (d)T2
Figure 2. H04 image raw data.
(a) (b) (c) (d)
Figure 3. H04 image expert segmentation results and the segmentation results of the algorithm: (a) 80th sequence expert segmentation results (b) 80th sequence algorithm segmentation results (c) 80th sequence expert segmentation results
(d) 80th sequence algorithm segmentation results.
Figure 2 shows the original images of the four modalities of H02 patients. The 79th and 108th sequences were selected. From left to right are FLAIR, T1, T1C, and T2 images. Figure 3 shows the results of the expert segmentation and the results of the segmentation of this paper. There are white tumor tissues misjudged as normal tissues while the normal tissues are misjudged as the tumor tissues. The edge part of the tumor is rough and uneven, but the segmentation precision is better from the whole, and the Dice coefficient of each layer reaches more than 90%.
[image:4.595.122.476.611.780.2]
(a) FLAIR (b)T1 (c)T1C (d)T2
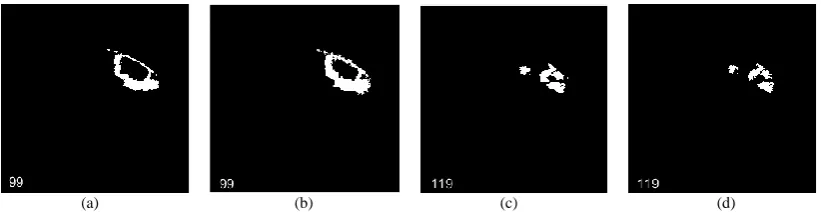
[image:5.595.102.513.69.175.2]
(a) (b) (c) (d)
Figure 5. H06 image expert segmentation results and the segmentation results of the algorithm: (a) 99th sequence expert segmentation results.(b) 99th sequence algorithm segmentation results.(c) 119th sequence expert segmentation results.
(d) 119th sequence algorithm segmentation results.
Figure 4 shows the original images of the four modalities of H06 patients. Figure 5 shows the results of the expert manual segmentation and segmentation results of the algorithm. It can be seen from the figure that the segmentation effect of the 99th sequence is better than that of the 119th sequence. The 119th sequence of brain tumor area is shown to be disconnected. There are gaps between normal tissues and tumor tissues. These problems lead to difficulty in segmentation. The difference between the fuzzy normal tissue area and the tumor area is small, and the texture characteristics are not particularly obvious. In addition, in the training, according to the method of uniform sampling, sampling of the fuzzy region accounts for a small proportion of the input sample, so the segmentation accuracy of the brain tumor region is not high. Therefore, for the 119th sequence in Figure 5, the segmentation accuracy is not high. A large number of re-samplings are needed for this area. The proportion of the sample in the region to the total sample is increased, so that targeted training can be performed.
Table 1 shows a quantitative comparison of the segmentation results the method in this paper, the method in paper [8] ,and the method in paper[14]. The paper[8] is based on the BP neural network algorithm without considering texture information, the kernel function of the algorithm is Gauss kernel function. It can be seen from the table that the Dice coefficient of the paper [8] method is low. The paper[14] is used Region Grow method which is based on seeds selection, seeds represent the centres of objects to be segmented. Its performance is not as good as the algorithm in this paper. In the process of extracting the gray features from multi-modal feature information, the features of different modal information that are favorable for classification are lost. These lead to a decline in the correct rate of segmentation. In this method, the texture information of the image block is considered in the multimodal information fusion process. Especially the texture information of most T1C and T2 modes can distinguish tumor molecular from non-tumor molecular, so the Tamura texture information can get a higher segmentation precision, and the higher segmentation accuracy is achieved. It was obtained because the Tamura texture information was considered.
Table 1. Average segmentation results for 30 patients (%).
Method Dice Sensitivity PPV
SVM without Texture Feature 82.0714.00 94.694.87 74.8419.93
Algorithm proposed in paper[14] 87.439.12 89.747.81 86.34+6.92
Algorithm proposed in this paper 89.657.40 97.695.45 85.6413.42
Summary
training; finally, other brain tumor images are processed with the trained BP neural network model. This method makes full use of the characteristics of different types of brain tumor images, taking into account not only the gray information of the images, but also the texture information of the images. The experimental results show that the proposed method has a certain degree of improvement in segmentation accuracy compared to the image segmentation method based on gray information.
Acknowledgement
This work is supported by the Natural Science Foundation of Hubei Province, China (Nos 2016CKC775). Thanks are due to Deng TQ for assistance with the experiments.
References
[1]K P. Wong, methods and applications in functional imaging, Springer-Verlag, Berlin, 2005.
[2]G Mohan, M Subashini, MRI based medical image analysis: survey on brain tumor grade classification J. Biomedical Signal Processing and Control, 39(2018) 139-161.
[3]HC Shen, JG Zhang, Fully connected CRF with data-driven prior for multi-class brain tumor segmentation, IEEE International Conference on Image Processing, Beijing, 2017:1727-1731.
[4]B J Wang, H W Pan, X Q Xie, et al, Medical image clustering based on multimodal features, J. Journal of Frontiers of Computer Science and Technology, 11(2017) 1-16.
[5]Namburu, Anupama, S. K. Samay, and S. R. Edara. Soft fuzzy rough set-based MR brain image segmentation. Applied Soft Computing, 54(2016)456-466.
[6]Y K Dubey, M M Mushrif, K Mitra, Segmentation of brain MR images using rough set based intuitionistic fuzzy clustering, J. Biocybernetics & Biomedical Engineering, 36(2016) 413-426.
[7]A Minz, C Mahobiya, MR image classification using adaboost for brain tumor type, IEEE 7th International Advance Computing Conference (IACC). Hyderabad: IEEE, (2017) 701-706.
[8]N Nabizadeh, M Kubat.Brain tumors detection and segmentation in MR images: Gabor wavelet vs.statistical features, J. Computers Electrical Engineering, 45(2015)286-301.
[9]P Moeskops, M A Viergever, A M Mendrikat,et al.Segmentation of MR brain images with a convolutional neural network, J. IEEE Transactions on Medical Imaging, 35(2016)1252-1261.
[10]A D Dahab, S G Samy, M S Gamal, Auto-mated brain tumor detection and identification using image processing and probabilistic neural network techniques, J. International Journal of Image Processing & Visual Communication, 1(2012) 1-8.
[11]N N Liu, J Tian, Z G Hu, et al, An information integration method of texture and gray based on neural network, J. Journal of Software,10(1999) 575-580.
[12]D E Hea, P F Whelan, Image segmentation based on the integration of color-texture descriptors-A review, J. Pattern Recognition, 44(2011)2479-2501.
[13]B F Yuan, Y H Wu, W Zeng, Image segmentation algorithm based on coevolution with texture and grayscale, J. Journal of Computer Applications, 29(2009)54-58.