Solving Economic Load Dispatch Using A Novel
Method Based On PSO Algorithm And GAMS
Software
Soodabeh Soleymani, Mahdi Hayatdavudi
Abstract: Economic load dispatch (ELD) problem between power plant units is formulated as a nonlinear optimization with continuous variables. The main target in this problem is optimum planning in power plant units with minimum cost while equal and non-equal constraints consisting load request and unit production capacity are followed. In this paper an effective method based on particle swarm algorithm optimization for solving economic load dispatch optimization problem is presented which has a high ability to give optimum response in a proper time. GAMS software is used for this comparison.
Index Terms: economic dispatch, non-convex cost function, particle swarm optimization, GAMS software.
————————————————————
1
I
NTRODUCTIONELD is a basic problem in applying power systems. The objective in ELD is minimizing power production cost regarding constraints on power plants and system. With respect to nonlinear objective function and complex constraints solving this problem is complicated [1]. Various methods are presented to obtain optimum solution in ELD. In [2], [3] linear and nonlinear programming is suggested. Linear programming is swift and accurate but this function estimates cost function partially therefore the result is not accurate. Nonlinear programming has complexity and convergence problem. Active programming is suggested for ELD [4]. This method cannot solve large scale problem nor needs a long
time. Methods like Lagrange based on derivative are
introduced [5]. These methods are not capable in considering practical constraints like valve point effect increase rate and prohibited zone because of their non-derivative nature. Mathematical analyzing methods cannot solve this problem regarding their mathematical nature. Therefore using complementary algorithm without nonlinearity and non-derivative of both objective function and constraints is suggested. A number of complementary algorithms are genetic
algorithm [6-8], particle swarm algorithm [9-12], neural
network [13], simulated annealing algorithm [14], bacterial
foraging [15], particle swarm optimization [16], evolutionary
programming [17], biography [18] and differential evolution
[19]. Also a method based on combination of above algorithms is used for ELD problem and are different with each other in precision and speed [20].
In this paper an idea based on particle swarm algorithm for solving ELD problem is used. To use a more real ELD cost functional power plant fuel are modelled non-convex. In this paper an innovative method for entering equal and non-equal constraints in producing primary population is presented which is very effective in obtaining optimum solution. Two system sample consisting of 13, 140 power plant units are used to show the effectiveness of this method and the obtained results are compared with some credible references. In the end the results of comparison between proposed algorithm and GAMS software are shown.
2
F
ORMULATING THEP
ROGRAMELD is an optimizing problem for minimizing power plant cost regarding different constraints. In this section mathematical objective function and constraints are presented.
2.1 Objective Function
The total cost of power plant unit consists of fuel cost, personnel payment, maintenance cost and fuel cost is the main part of cost and has a direct relation with production. Cost function is based on fuel cost and other costs are constant values in this function. Power plant fuel cost function is usually a quadratic function based on active output power therefore ELD mathematical model is (1).
In equation (1), n is the number of generators,
a
i,
b
i,
c
i arecoefficient cost of i power plant and Pi is production
capability of i power plant.
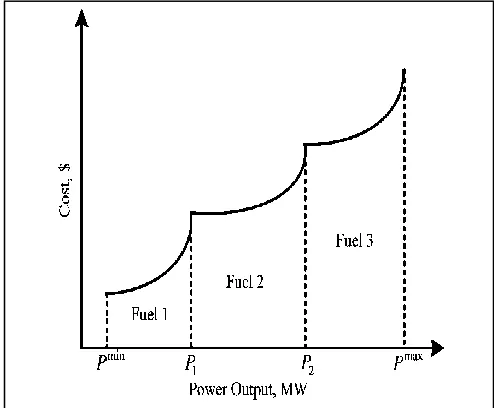
2.2 Considering Valve-Point Effects
Inspections show the figure of power plant cost function is not always convex and has non-differentiable points according to valve-point. Figure 1 shows a power plant cost function with 5 valve controllers. For modeling valve effect a sine part is added .therefore production cost of power plant is obtained using (2).
n
i
i i i i i n
i i i
T F P aP bP c
F
1 2
1
)
(
(1)
__________________________
Soodabeh Soleymani is with Technical Engineering Department, Science and Research Branch, Islamic Azad University-(IAU), Tehran, Iran.
E-mail: [email protected]
Mahdi Hayatdavudi is with Technical Engineering Department, Science and Research Branch, Islamic Azad University-(IAU), Tehran, Iran.
In equation (2)
e
i,
d
i objective function coefficient because of valve point effect and pi min show the minimum production capability.2.3 Considering Multiple Fuel Options
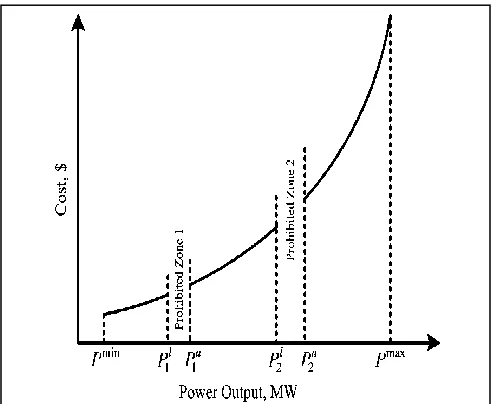
Different fuel types are usually used in power plants regarding their output power. Therefore for a more realistic ELD problem modelling multiple fuel effects must be considered in formulation. Cost function of i power plant with k fuel types is presented in equation (3).
In equation (3), Pimax is maximum production of power plant. Multiple fuel effect on cost function is presented in figure 2. With considering valve effect sine effect is added to (3).
3
P
ROBLEMC
ONSTRAINTS3.1 Generating Limit Constraint
Regarding electrical, mechanical and stability consideration, power plant production capability must be between minimum and maximum permissible range. This constraint is shown in
(4) which Pimin and
P
imax are minimum and maximum outputpower of i unit.
3.2 Power Balancing Constraint
For balancing capability in power systems, production of all power plant units must be equal to summation of load on system and network loss (equation(5)).
In equation (5), PD is load and
P
L is network transition loss. The volume of loss depends on network physical structure and power plant output which is calculated by equation (6) [4].WhereBij,B0i,B00 are B matrix coefficient which are directly derived from impedance matrix[4].
3.3 Slope Rate Constraint
In a real condition power plant production can be increased or decreased with slope rate therefore production capability has a minor difference in time intervals. This constraint is presented Fig. 1. Valve point effect on fuel cost curve
2 min
( ) sin( ( ))
i i i i i i i i i i i
F P a b P c P d e P P
(2)
(3)
, fuel ,
2,
fuel ,
1,
fuel ,
) (
max 1
2
2 1
2 2 2 2
1 min
1 1 2 1
i i k i ik
ik i ik
i i i i
i i i
i i i i
i i i i i
P P P k c b P a
P P P c
b P a
P P P c
b P a
P F
Fig 2.Multiple fuel effect on fuel cost curve
n i
P P
Pimin i imax for 1,2,, (4)
L D n
i
i P P
P
1
(5)
n i
n
j
n
i i i ij
i
L PB B P B
P
1 1 1
00
in equations (7), (8).
Where Pi0 is primary production capability andURi, DRi are
maximum increasing and decreasing slope rate of i unit
respectively. For considering slope rate constraint and i power
plant capability simultaneously (4) and (8) are combined and considered as a non-equal constraint.
3.4 Prohibited Operating Zones
Prohibited production zone are in production intervals which vibration on turbines are above permitted limits therefore production is prohibited in these zones. Permitted intervals are shown in equation (9).
WherePiu,k , u
k i
P, are k low and high limits of prohibited zone I
unit respectively. zi is the number of i power plant prohibited zone and nz is the number of power plants having prohibited zone[11]. The effect of prohibited zone on power plat cost function is shown in figure (3).
4
O
PTIMIZINGM
ETHODB
ASEDO
NP
ARTICLES
WARMO
PTIMIZATIONA
LGORITHMParticle swarm optimization algorithm (PSO) is an optimization method based on population which was suggested first by
Renndy and Eberhart [15]. The main idea in PSO algorithm is based on modeling and simulating particle swarm (like birds) behavior to find food. In this paper developed methods of this algorithm [16] which is highly capable in obtaining absolute optimized solution or a near solution is used for ELD problem among power plants. It needs to be mentioned that in this paper To increase the effectiveness of this algorithm operator crossover is added to this algorithm.
4.1 Classic Editing of PSO Algorithm
In PSO classic algorithm each i particle is consisted of two major parts current position of particle Xi and particle velocity
Vi in each repetition the change of particle position is updated based on current position of particle and updated velocity. each Particle velocity is updated via equation (10) based on 3 major factors, current velocity, best experienced position (person) knowledge and the best position of particle among group particles (social knowledge).
Where w is inertial coefficient of I particle for motion by previous velocity. C1i , C2i are personal and group learning of i particle which is randomly selected from [0-2] interval for preserving probability character algorithm. By determining next
velocity of each i particle next position is achieved by equation
(11). The process of updating particle in PSO algorithm is repeated until all particles are guided to a single point. And then use markup styles. Please keep the template at
4.2 Following Problem Constraints Method
In ELD problem equality and non-equality constraint of production and consume and also generators production constraint must be followed [1]. In this paper for non-equal constraints which are related to high and low limits of generators power. During algorithm performance process variable is considered constant when violates from its limits or new value is replaced using (10) and (11). For equal constraint which is supplying load by generators a new method is used which variables change in a way that constraints conditions are followed. If equal constraint is not followed [3] first one of generators is selected as float variable and compensates extra or shortage of production. In this condition float variable may violates from its limits. If this occurs float variable is fixed in its limits and in the next step extra or shortage of production is divided among all units using (12). If deviation from limit occurs for each variable the process is repeated until all equal and non-equal constraints are followed.
n i
UR P
Pi i0 i for 1,2,, (7)
n i
DR P
Pi0 i i for 1,2,, (8)
, 1,..., z
,..., 3 , 2 ,
max 1
,
, 1
,
1 , min
n i P
P P
z k
P P P
P P P P
i i u
z i
i l
k i i u
k i
l i i i
i
i
(9)
Fig 3.Prohibited zone effect on fuel cost curve
i i i i i i
i KwV C Pbest X C Gbest X
V1 1 2 (10)
1
1
i i
i X V
X (11)
] [
] [ ]
[ new old
J j
j D
P P P
4.3 Numerical Studies and Result Analysis
In this paper to evaluate the proposed method for ELD in power plant two sample system 13 and 140 units are used [17]. In order to compare the results of proposed method with results of other methods network loss are neglected.
A. 13 Unit System
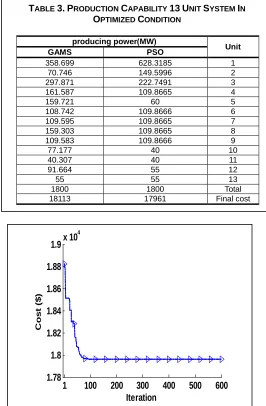
This system has 13 production units and should supply 1800 megawatt demand. Table 1 shows the comparison between proposed methods with other methods for 13 unit system. Presented time in the last column is based on 100 times repetition of proposed algorithm in different populations. Presented results in table 2 show for all populations the best results are almost equal and the average of results for all populations are close to each other but their value decreases by increasing number of populations. It can be concluded from this table that the proposed algorithm in this paper has almost a proper result for different populations. For example the average of obtained results from proposed algorithm is even better than the best result from classic particle swarm algorithm. Figure 4 shows convergence best result by proposed algorithm. As it can be seen proposed algorithm is convergence after 100 epochs. This shows the capability of algorithm in obtaining optimized result in a short time. Table 3 shows the power production of units in optimized condition. In this severely nonlinear system simulations are done using GAMS software. Results are shown in table 3. It is clear that PSO algorithm presents better results.
8.5‖ x 11‖—do not set the template for A4 paper. The pull-down style menu is at the left of the Formatting Toolbar at the top of your Word window (for example, the style at this point in the document is ―Text‖). Highlight a section that you want to designate with a certain style, then select the appropriate
B. 140 Generator System
This is a large scale system with 140 generators. The load of system is 49432megawatt. Systems have primary conditions
and increasing and decreasing rate is considered.
Experiments are done with PSO algorithm and GAMS software. Ultimate cost for PSO algorithm and GAMS software are 169600 and 1655680 respectively. Generators output is presented in table 4. It is obvious that GAMS software has obtained optimized solution. In fact by decreasing the complexity of cost function GAMS software has a good performance but in a small and complex problem PSO has a better performance. Convergence of best result by proposed algorithm is shown in figure 5.
5.
C
ONCLUSIONSIn this paper ELD problem on two sample system using a novel method based on particle swarm algorithm is solved. In the proposed method for equal and non-equal constraints in producing primary population and performing algorithm process an idea is presented that is very effective for obtaining optimized solutions. Comparison of results between proposed TABLE 1.PROPOSED METHOD RESULTS AND OTHER METHODS
IN 13UNIT SYSTEM
Method )$( respond best ( sec ) running time [7] GA 17975.340 --[17] EP 17994.070 157.43 [21] EP-SQP 17991.030 121 [21] PSO 18030.720 77 [21] PSO-SQP 17969.930 33.97 [23] QPSO 17963.950 --[22] CDEMD 17961.940 12.6 [7] IGA 17963.980 --PSO 17960.366 2.22
TABLE 2.PERFORMANCE RESULTS WITH DIFFERENT
POPULATIONS IN 13UNIT SYSTEM
Primary populati on best Respon d worst Respon d Average Respond devia nce time ( s ) 10 17960.5 0 18209.7 1 18055.76 51.09 0.78 20 17960.6 6 18126.1 9 18032.75 41.38 1.49 30 17960.3 6 18110.7 5 18023.24 37.62 2.22 50 17960.3 6 18085.7 5 18004.99 30.66 3.63 100 17960.3 6 18088.6 4 17995.84 27.28 7.52
TABLE 3.PRODUCTION CAPABILITY 13UNIT SYSTEM IN
OPTIMIZED CONDITION
Unit ( MW ) producing power PSO GAMS 1 628.3185 358.699 2 149.5996 70.746 3 222.7491 297.871 4 109.8665 161.587 5 60 159.721 6 109.8666 108.742 7 109.8665 109.595 8 109.8665 159.303 9 109.8666 109.583 10 40 77.177 11 40 40.307 12 55 91.664 13 55 55 Total 1800 1800 Final cost 17961 18113
1 100 200 300 400 500 600
1.78 1.8 1.82 1.84 1.86 1.88
1.9x 10
4 Iteration C o s t ($ )
algorithm and other references for ELD among power plants show high effectiveness of proposed algorithm. Also In this paper the comparison between results from proposed algorithm and GAMS software is presented and shows when the objective function is more nonlinear the proposed method is more proper to solve and if nonlinearity decreases GAMS software is a better option even if the scale of problem is large.
R
EFERENCES[1] K. Meng, H.G. Wang, Z.Y. Dong, K.P. Wong, ―Quantum-Inspired
Particle Swarm Optimization for Valve-point Economic Load Dispatch,‖ IEEE Transactions on Power Systems, Vol. 25, No. 1, pp. 215–222, 2010.
[2] S. Granville, ―Optimal Reactive Dispatch through Interior Point Methods,‖ IEEE Transactions on Power Systems, Vol. 9, No. 1, pp. 136–146, 1994.
[3] C.L. Chen, S.C. Wang, ―Branch-and-Bound Scheduling for
Thermal Generating Units,‖ IEEE Transactions on Energy Conversion, Vol. 8, No. 2, pp. 184–189, 1993.
[4] Z.X. Liang, J.D. Glover, ―A Zoom Feature for a Dynamic
Programming Solution to Economic Dispatch Including Transmission Losses,‖ IEEE Transactions on Power Systems, Vol. 7, No. 2, pp. 544–550, 1992.
[5] A.A. El-Keib, H. Ma, J.L. Hart, J.L. , ―Environmentally Constrained Economic Dispatch Using the Lagrangian Relaxation Method,‖ IEEE Transactions on Power Systems, Vol. 9, No. 4, pp. 1723–1729, 1994.
[6] D.C. Walters, G.B. Sheble, G.B. , ―Genetic Algorithm Solution of Economic Dispatch with Valve Point Loading,‖, IEEE Transactions on Power Systems, Vol. 8, No. 3, pp. 1325–1332, 1993.
[7] C.L Chiang, ―Improved Genetic Algorithm for Power Economic
Dispatch of Units with Valve-Point Effects and Multiple Fuels'‖ IEEE Transactions on Power Systems, Vol. 20, No. 4, pp. 1690– 1699, 2005.
[8] P. Subbaraj, R. Rengaraj, S. Salivahanan, S. , ―Enhancement of
Self-adaptive Real-coded Genetic Algorithm Using Taguchi Method for Economic Dispatch Problem,‖ Applied Soft Computing, Vol. 11, No. 1, pp. 83–92, 2011.
[9] Z.L. Gaing, Z.L. , ―Particle Swarm Optimization to Solving the Economic Dispatch Considering the Generator Constraints,‖
IEEE Transactions on Power Systems, Vol. 18, No. 3, pp. 1187–
1195, 2003.
[10]J.B. Park, K.S. Lee, J.R. Shin, K.Y. Lee, K.Y. ''A Particle Swarm Optimization for Economic Dispatch with Nonsmooth Cost Functions,‖ IEEE Transactions on Power Systems, Vol. 20, No. 1, pp. 34–42, 2005.
[11]H. Lu, P. Sriyanyong, Y.H. Song, T. Dillon, T. , ―Experimental Study of a New Hybrid PSO with Mutation for Economic Dispatch with Non-smooth Cost Function,‖ Electrical Power and Energy Systems, Vol. 32, No. 9, pp. 921–935, 2010.
[12]A.I. Selvakumar, K. Thanushkodi, K. , ―New Particle Swarm
Optimization Solution to Nonconvex Economic Dispatch
Problems,‖ IEEE Transactions on Power Systems, Vol. 22, No. 1, pp. 42–51, 2007.
[13]C.T. Su, C.T. Lin, C.T. , ―New Approach with a Hopfield Modeling Framework to Economic Dispatch,‖ IEEE Transactions on Power Systems, Vol. 15, No. 2, pp. 541–545, 2000.
[14]K.P. Wong, C.C. Fung, ―Simulated Annealing Based Economic
Dispatch Algorithm,‖ IEE Proceedings C Generation, Transmission and Distribution, Vol. 140, No. 6, pp. 509–515, 1993.
[15]B.K. Panigrahi, V.R. Pandi, V.R. , ―Bacterial Foraging Optimization: Nelder-Mead Hybrid Algorithm for Economic Load Dispatch,‖ IET Generation, Transmission & Distribution, Vol. 2, No. 4, pp. 556–565, 2008.
[16]S. Pothiya, I. Ngamroo, I. , ―Ant Colony Optimisation for Economic Dispatch Problem With Non-smooth Cost Functions,‖ International Journal of Electrical Power & Energy Systems, Vol. 32, No. 5, pp. 478–487, 2010.
[17]N. Sinha, R. Chakrabarti, R.K. Chattopadhyay, P. K.,
―Evolutionary Programming Techniques for Economic Load Dispatch,‖ IEEE Transactions on Evolutionary Computation, Vol. 7, No. 1, pp. 83–94, 2003.
[18]A. Bhattacharya, P.K. Chattopadhyay., ―Biogeography-Based
Optimization for Different Economic Load Dispatch Problems,‖ IEEE Transactions on Power Systems, Vol. 25, No. 2, pp. 1064– 1077, 2010.
[19]S.K. Wang, J.P. Chiou, C.W. Liu., ―Non-smooth/Non-convex Economic Dispatch by a Novel Hybrid Differential Evolution Algorithm,‖ IET Generation, Transmission & Distribution, Vol. 1, No. 5, pp. 793–803, 2007.
[20]A. Bhattacharya, P.K. Chattopadhyay, ―Hybrid Differential
Evolution with Biogeography-Based Optimization for Solution of Economic Load Dispatch,‖ IEEE Transactions on Power Systems, Vol. 25, No. 4, pp. 1955–1964, 2010.
[21]T.A.A. Victoire, A.E. Jeyakumar, ―Hybrid PSO-SQP for economic
dispatch with valve-point effect,‖ Electric Power Systems Research, vol. 71, no. 1, pp. 51–59, 2004.
[22]L.S. Coelho, R.C.T. Souza, V.C. Mariani, ―Improved differential evolution approach based on cultural algorithm and diversity measure applied to solve economic load dispatch problems,‖ Mathematics and Computers in Simulation ,vol. 79, pp. 3136– 3147, 2009.
[23]L.S. Coelho, V.C. Mariani, ―Particle swarm approach based on
TABLE 4.PRODUCTION CAPABILITY 140UNIT SYSTEM IN OPTIMIZED CONDITION
unit
Output power Unit
Output power unit
Output power unit
Output power unit
Output power unit
Output power unit
Output power
GAMS PSO GAMS PSO GAMS PSO GAMS PSO GAMS PSO GAMS PSO GAMS PSO
1 119 117.7 21 505 505 41 3 17.45 61 163 166.8 81 542 217.8 101 958 957.9 121 175 177.5
2 164 164 22 505 505 42 3 3.363 62 95 98.79 82 56 56.58 102 947.9 946.6 122 2 7.786
3 190 187.4 23 505 505 43 250 181.8 63 511 231.1 83 115 115.9 103 934 933.9 123 4 4.028
4 190 189.9 24 505 505 44 250 188.3 64 511 410 84 115 115.4 104 935 934.3 124 15 15.76
5 190 174.2 25 537 536 45 250 239.6 65 490 477.2 85 115 116 105 876.5 876.4 125 9 9.338
6 190 188.3 26 537 536 46 250 243.5 66 256.9 257.7 86 207 208 106 880.9 880.9 126 12 12.45
7 490 489.6 27 549 548 47 250 221.2 67 490 474.3 87 207 207.4 107 873.7 873.6 127 10 12.16
8 490 487.8 28 549 549 48 250 245.1 68 490 476.1 88 175 269 108 877.4 877.4 128 112 112.6
9 496 495.8 29 501 501 49 250 245.2 69 130 135.9 89 175 178.4 109 871.7 871.6 129 4 5.398
10 496 495.4 30 499 499 50 250 248.7 70 294.6 300.9 90 180.4 184.9 110 864.8 864.6 130 5 6.373
11 496 496 31 506 506 51 165 193.5 71 141.5 138.7 91 175 176.5 111 882 882 131 5 5.135
12 496 496 32 506 506 52 165 247 72 365.9 348 92 575.4 574.9 112 94 100.3 132 50 52.87
13 506 506 33 506 506 53 165 296.2 73 195 355.4 93 547.5 546 113 94 96.99 133 5 6.13
14 509 509 34 506 506 54 165 498.1 74 217.5 292 94 836.8 836.5 114 94 95.01 134 42 71.83
15 506 506 35 500 500 55 180 182 75 217.4 244.2 95 837.5 837.2 115 244 245.8 135 42 42.04
16 505 505 36 500 500 56 180 180.1 76 258.7 268 96 682 681.5 116 244 244 136 41 41.02
17 506 505.7 37 241 241 57 103 124.5 77 403.3 175 97 720 719.8 117 244 247.8 137 17 17.01
18 506 505.1 38 241 241 58 198 198.4 78 330 500.5 98 718 717.9 118 95 96.4 138 7 15.64
19 505 505 39 774 774 59 312 301.3 79 531 531 99 720 720 119 95 95.34 139 7 12.15
20 505 503.8 40 769 769 60 308.6 275.1 80 531 531 100 964 963.9 120 116 117.5 140 26 26.15