ISSN (e): 2250-3021, ISSN (p): 2278-8719
Vol. 09, Issue 5 (May. 2019), ||S (VIII) || PP 66-72
VLSI Based Efficient Epeleptic Seizure Detection System
Nuzhat Anjum Sheikh, Student
Prof. Mayuri Chawla, Guide, Prof. Parinay Lavatre, Co-guide
(Department of ETC Engineering, Jhulelal Institute of Technology, Lonara, India)
Abstract :
Epilepsy patients encounter difficulties in day by day life because of safety measures they need to take so as to adapt to this condition. At the point when a seizure happens, it may causewounds or imperil the life of the patients or others, particularly when they are utilizing substantial hardware, e.g., determining autos. Investigations of epilepsy regularly depend on electroencephalogram (EEG) motions so as to break down the conduct of the cerebrum amid
seizures. Finding the seizure time frame in EEG accounts physically is troublesome and tedious; one frequently needs to skim through tens or even several hours of EEG chronicles. Hence, programmed identification of such an action is of extraordinary significance. Another potential utilization of EEG flag examination is in the expectation of epileptic exercises previously they happen, as this will empower the patients (and parental figures) to avoid potential risk. In this paper, we first present a diagram of seizure identification and forecast issue and give bits of knowledge on the difficulties around there.
Keywords:
Gesture Component Analysis Dual Tree Discrete Wavelet, Seizure Detection, EEG, FPGAI.
Introduction
Around 1-2% of the populace experiences seizures. The unconventionality of when seizures will all of a sudden happen is an essential explanation behind the incapacity related with epilepsy, and this vulnerability drastically impacts the personal satisfaction for patients and their parental figures (Fisher et al. 2000). Notwithstanding most people with epilepsy demonstrating no impacts of the turmoil other than amid and promptly following the event of seizures, not knowing when these occasions may happen can keep them from driving, swimming, cooking, and so forth. Evacuating this vulnerability, through adequately early and precise seizure recognition and quick cautioning, may accordingly result in a noteworthy personal satisfaction enhancement. Precise location and logging of seizures can be utilized to enhance the indicative yield from patient checking amid epilepsy medical procedure assessment and to enhance comprehension of epilepsy as a dynamical illness. Also, exact programmed seizure recognition offers the potential for computerized "shut circle" treatment, in which a treatment, for example, electrical incitement, sedate mixture, cooling, or biofeedback might be conveyed in light of a seizure location (Osorio et al. 2001, Theodore and Fisher 2004, Osorio et al. 2005, Morrell 2006, Anderson et al., 2008, Stacey and Litt 2008, Rothman 2008, Osorio and Frei 2009). Shut circle control of seizures has real points of interest over treatment that does not use quick "criticism" of the patient state. Specifically, shut circle treatment can be unequivocally coordinated (e.g., conveyed endless supply of a seizure) and even adaptively dosed (e.g., conveying diverse portion levels and utilizing distinctive treatment modalities and conveyance locales relying on estimated seizure attributes and patient states). As it were, the treatment can be custom fitted to be regulated just when and where required. Coupling the utilization of quantitative observing calculations with treatment additionally empowers the target evaluation of remedial viability, by empowering portrayal of treatment portion reaction and corresponding organization with changes in seizure seriousness and recurrence of event after some time.
of a channel to the signs, (ii) recurrence changes in the flag, (iii) stage variable changes, (iv) rhythmicity changes, and (v) a proportion of separation between the flag fragment and a format motion with known morphology. These amounts may likewise be consolidated to determine different measures, for example, flag circular segment length or line-length measures (Esteller et al. 2001), or proportions of comparability between the power ghastly densities acquired from various flag ages (Murro et al. 1991, Alarcon et al. 1995, Gabor and Seyal 1996). Contingent on whether a measure uses a one, two, or a few info signs to deliver its yield, the measure is alluded to as a univariate, bivariate or multivariate measure, separately. Contrasts between measures in the latest moving window(s) are normally contrasted with reference or foundation esteems to recognize factually noteworthy changes related with the seizure movement. Frequently the proportion between the ongoing moving window ("closer view") and past non-seizure esteems ("foundation") is contrasted with an edge so as to identify huge changes (Osorio etal. 1998).
II.
Figures And Tables
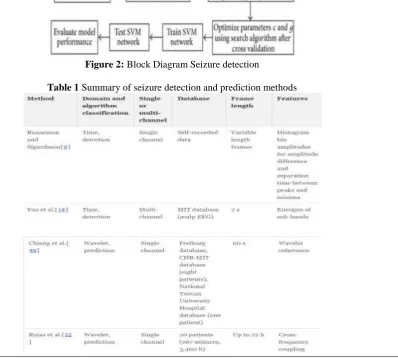
SVM has been utilized in current years as an option to ANN as highlighted in table 1. Because of Structural Risk Minimization (SRM), SVM accomplishes the upgraded speculation. SVM can be utilized for non direct information by utilizing bit work despite the fact that SVM is straight. Essential SVM recognizes the example into two class classifier, with some alteration, multiclass classifier can be gotten. Characterizing information is an essential employment in machine learning (Ubeyli, 2010). In EEG arrangement issues, n tries as pursues {(x1, y1)... (xn,yn)} This is known as the preparation set. Where xi is a vector and yi is a paired class name ±1. For this given information indicates every datum pointed have a place one of the two classes. The primary point of the SVM calculation is to pick which classification another information position will be inc as shown in below block diagram.
Figure 2: Block Diagram Seizure detection
Integrating the training algorithm on chip is very valuable for the portable detection system to be trained in time to adapt to the variations using the patient-specific and up-to-date EEG data.
However, training classical SVM is solving a quadratic programming (QP) problem which is computationally complex and energy-consuming, so integrating an efficient SVM training algorithm is very important. Evolving applications require processing of high quality data. One obvious way to accommodate this demand is to increase the bandwidth available to hardware. Of course, this "solution" is not without technological and economical difficulties. Another way is to reduce the volume of the data. There has been a tremendous amount of progress in the field of seizure detection using SVM as the base. In order to make further progress in this area we have proposed to use DTWT(dual tree wavelet transforms) to provide data translation and normalization.
III.
Objectives
ARCHITECTURE SVM - Architecture
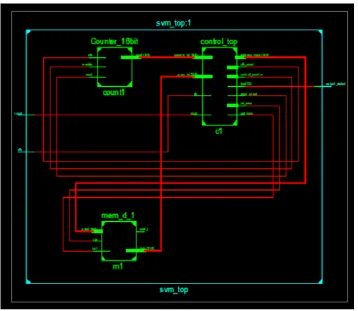
Figure3: SVM Block Diagram
The nonlinear SVM learning process can be transform to solving the linearly constrained QP problem. We adopt the nonlinear SVM for higher detection rate. The intuition behind the nonlinear SVM is the kernel technique, i.e. to project EEG signals into a higher dimensional space to make them linearly separable. It has been confirmed the Gaussian kernel function shows better performance compared to other functions in seizure detection. So the Gaussian kernel function is utilized in our design. Checking the Karush-Kuhn-Tucker (KKT) condition is the critical process for learning and an optimal situation is obtained if and only if the KKT condition is satisfied for all the multipliers. If all the Lagrange multipliers satisfy the KKT condition, the MSMO algorithm finishes.
SVM architecture first requires a way of normalizing the data train set which requires a floating point multiplication block working at a synchronous clock frequency at which the sample data needs to maintain the frame rate (FPS). We require a address generator counter that will provide the input data that needs to be processed and stored back. All the blocks are developed on Xilinx platform using structural modeling and further insight is provided in the upcoming section.
DTWT – Dual tree Wavelet Transform
Figure 4: Logical Structure of DTWT
MAV and VAR sub modules follow DWT sub module to calculate the mav and var values of the four coefficients. The calculated mav and var values of the four coefficients form the 8-dimensional input vector X of a sample as the input of SVM module for learning or detecting. All the blocks can be better understood by the upcoming simulation section.
IV.
Xilinx Simulation
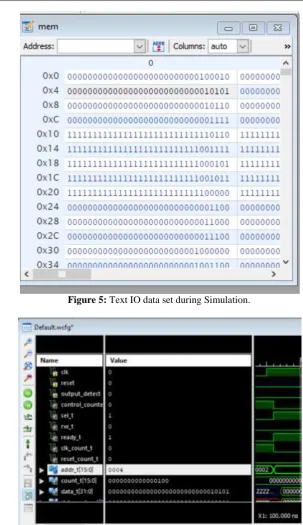
The input data set analyzed in our study is available on this page (http://epileptologie-bonn.de/cms/front_content.php). The sampling rate of the data was 173.61 Hz. Please note, however, that the time series have the spectral bandwith of the aquisition system, which is 0.5 Hz to 85 Hz. The application of a low-pass filter of 40 Hz, as described is regarded as the first step of analysis carried out for the downloadable time series.
Figure 5: Text IO data set during Simulation.
Figure 6: Wave form Confirmation for Text IO data set as input to normalization block.
Figure 7: Multiplier Test bench example.
Figure 9: Result Representation Online.
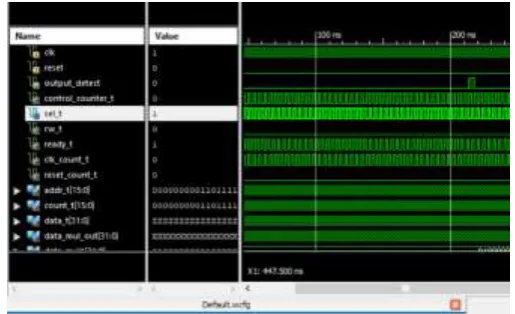
The SVM takes this normalized input data and processes using DTWT translation and provides a mechanism to detect epilepsy where in the input data is provided with the specified sampling frequency of the downloaded data set. The input classifier are extracted based on the MSMO algorithm and then finally the data to be tested is provided and searched with respect to the classifier data set and epilepsy output detected as shown in the below waveform.
Figure 10: Result Waveform of the input patient for epilepsy detection.
Implementation of a experimental setup and testing on live patient dataset.
V.
Conclusion
VI.
Application
It is widely used in medical science to improve health of the patient.VII.
Result and Discussion
A VLSI design for the automatic seizure detection is simulated to enable efficient on-chip learning and improve the detection rate. The architecture of the designed system comprises of a feature extraction module and an SVM module. The feature extraction module decomposes the EEG signal to fit the clinical bands using the DTWT and yields the mean absolute value and variance of the coefficients as the time-frequency domain feature vector. The modified sequential minimal optimization algorithm is integrated into the SVM module with the normalized vector machine prediction and detection to achieve the efficient on-chip training. This system is verified on the public EEG datasets, and the simulation results show that the designed VLSI system improves the detection rate and training efficiency.
VIII.
Future Scope
Implementation of a experimental setup and testing on live patient dataset.Acknowledgements
I would like to express sincere gratitude and appreciation to all those who gave me the possibility to complete this paper. A special thanks to my Project Guide Prof. Mayuri Chawla and Project Co-Guide Prof. Parinay Lavatre Whose help, stimulating suggestions and encouragement, helped to coordinate project especially in writing this paper.
References
[1]. "VLSI Design of SVM-Based Seizure Detection System With On-Chip Learning Capability" Lichen Feng, Zunchao Li, andYuanfa
Wang(2017).
[2]. “Clustering Challenges on Biological Networks” S. Butenko, W. A. Chaovalitwongse and P. M. Pardalos, World Scientific (2009).
[3]. “Feature Selection for Consistent Biclustering via Fractional 0-1 Programming” (with Stanislav Busygin and Oleg A. Prokopyev),
Journal of Combinatorial Optimization, Volume 10, Number 1 (2005), pp. 7-21.
[4]. “Biclustering in Data Mining” (with S. Busygin, and O. Prokopyev), Computers & Operations Research, Volume 35, Issue 9
(2008), pp. 2964-2987.
[5]. “On Biclustering with Features Selection for Microarray Data Set” (with S. Busygin and O. Prokopyev), In (BIOMAT 2005)
Proceedings of the International Symposium on Mathematical and Computational Biology (Edited by R. Mondaini & R. Dilao), World Scientific (2006), pp. 367-377.
[6]. “Biclustering: algorithms and applications in data mining and forecasting” (with P. Xanthopoulos, N. Boyko and N. Fan) In
Encyclopedia of Operations Research and Management Science (accepted to appear) Wiley(2010). W. Chaovalitwongse, L.D. Iasemidis, P.M. Pardalos, P.R. Carney, D.-S. Shiau, and J.C. Sackellares. A Robust Method for Studying the Dynamics of the
Intracranial EEG: Application to Epilepsy. Epilepsy Research, 64, 93-133, 2005.
[7]. W. Chaovalitwongse, P.M. Pardalos, and O.A. Prokopyev. Electroencephalogram (EEG) time series classification: Applications in
epilepsy , Annals of Operations Research, 148, 1 (2006), p 227-250.
[8]. Jicong Zhang, Petros Xanthopoulos ,Chang-Chia Liu, Panos M. Pardalos. Real-time differentiation of nonconvulsive status
epilepticus from other encephalopathies using quantitative EEG analysis: A pilot study“, Epilepsia, 51, 2 (2010), pp. 243-250 W. Chaovalitwongse , P.M. Pardalos, L.D. Iasemidis, D.-S. Shiau, and J.C. Sackellares. Dynamical Approaches and Multi-Quadratic
Integer Programming for Seizure Prediction. Optimization Methods and Software, 20 (2-3): 383-394, 2005 .
[9]. L.D. Iasemidis, P.M. Pardalos, D.-S. Shiau, W. Chaovalitwongse, K. Narayanan, A. Prasad, K. Tsakalis, P.R. Carney, and J.C.
Sackellares. Long Term Prospective On-Line Real-Time Seizure Prediction. Journal of Clinical Neurophysiology, 116 (3): 532-544,
2005.
[10]. P.M. Pardalos, W. Chaovalitwongse, L.D. Iasemidis, J.C. Sackellares, D.-S. Shiau, P.R. Carney, O.A. Prokopyev, and V.A.
Yatsenko. Seizure Warning Algorithm Based on Spatiotemporal Dynamics of Intracranial EEG. Mathematical Programming,
101(2): 365-385, 2004. (INFORMS Pierskalla Best Paper Award 2004) .
[11]. W. Chaovalitwongse , P.M. Pardalos, and O.A. Prokopyev. A New Linearization Technique for Multi-Quadratic 0-1 Programming