Mech. Sci., 3, 63–72, 2012 www.mech-sci.net/3/63/2012/ doi:10.5194/ms-3-63-2012
©Author(s) 2012. CC Attribution 3.0 License.
Mechanical
Sciences
Open Access
Modelling and experimental investigation of process
parameters in WEDM of WC-5.3 % Co using response
surface methodology
K. Jangra and S. Grover
Department of Mechanical Engineering, YMCA University of Science and Technology, Faridabad 121006, India
Correspondence to: K. Jangra ([email protected])
Received: 7 January 2012 – Revised: 18 September 2012 – Accepted: 4 October 2012 – Published: 1 November 2012
Abstract. Tungsten carbide-cobalt (WC-Co) composite is a difficult-to-machine material owing to its
excel-lent strength and hardness at elevated temperature. Wire electrical discharge machining (WEDM) is a best al-ternative for machining of WC-Co composite into intricate and complex shapes. Efficient machining of WC-Co composite on WEDM is a challenging task since it involves large numbers of parameters. Therefore, in present work, experimental investigation has been carried out to determine the influence of important WEDM parame-ters on machining performance of WC-Co composite. Response surface methodology, which is a collection of mathematical and experimental techniques, was utilised to obtain the experimental data. Using face-centered central composite design, experiments were conducted to investigate and correlate the four input parameters: pulse-on time, pulse-offtime, servo voltage and wire feed for three output performance characteristics – cut-ting speed (CS), surface roughness (SR) and radial overcut (RoC). Using analysis of variance on experimental data, quadratic vs. two-factor interaction (2FI) models have been suggested for CS and RoC while two-factor interaction (2FI) has been proposed for SR. Using these mathematical models, optimal parameters can be de-termined easily for desired performance characteristics, and hence a trade-offcan be made among different performance characteristics.
1 Introduction
Demand for tungsten carbide-cobalt (WC-Co) composite has been growing rapidly due to its excellent mechanical proper-ties like high wear and corrosion resistance, which makes it most suitable for cutting tools, dies and other special wear-resisting applications. Machining of WC-Co composite is very difficult with conventional machining processes like turning, milling and grinding (Liu and Li, 2001; Liu et al., 2003; Engqvist et al., 1999; Jia and Fischer, 1997) because of its high hardness and high melting temperature. Due to the low material removal rate and difficulty in machining of complex and intricate profiles in WC-Co composite, cost as-sociated with conventional machining processes is very high. Wire electrical discharge machining (WEDM) is a spe-cialised form of electrical discharge machining (EDM) pro-cess which is potentially used to generate intricate and
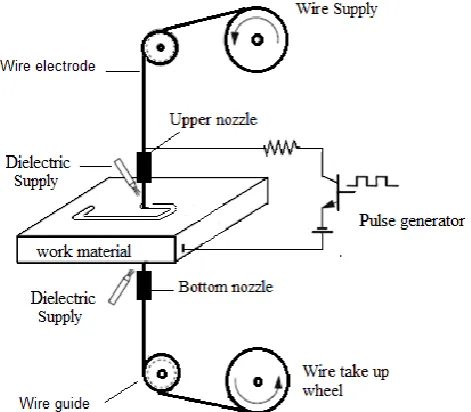
com-plex geometries in hard conductive materials without making any mechanical contact (Jangra et al., 2010). In WEDM, ma-terial is eroded due to the melting/evaporation of work sur-face which is mainly due to the localised high temperature generation in plasma channel between the work material and downward moving wire electrode (as shown in Fig. 1). In order to achieve high productivity within specified tolerance on WEDM, selection of optimal process parameters plays a key role which depends on large numbers of variables such as composition and grain size of work material, machining parameters, wire electrode material, wire diameter, cutting conditions and work geometry etc. (Jangra et al., 2011).
Several attempts have been made to determine optimal machining conditions for WC-Co composite on EDM and WEDM. Lee and Li (2001) investigated the influence of EDM parameters such as the electrode materials, electrode polarity, open circuit voltage, peak current, pulse duration,
64 K. Jangra and S. Grover: Modelling and experimental investigation of process parameters in WEDM
key role which depends on umpteen numbers of variables such as composition and grain size of work material,
machining parameters, wire electrode material, wire diameter, cutting conditions and work geometry etc (Jangra
et al., 2011).
Figure 1 Representation of WEDM process
Several attempts have been made to determine optimal machining conditions for WC-Co on EDM and
WEDM. Lee and Li (2001) investigated the influence of EDM parameters such as the electrode materials,
electrode polarity, open circuit voltage, peak current, pulse duration, pulse interval and flushing on the
machining characteristics, such as material removal rate (MRR), surface finish and relative tool wear in EDM of
tungsten carbide. Lee and Li (2003) elucidated the effect of discharge energy on integrity of EDMed surface of
tungsten carbide. It was found that the surface roughness is a function of two main parameters, peak current and
pulse duration. At high peak current and/or long pulse duration rough surface and abundance of micro-cracks
was observed. Mahdavinejad (2005) studied the instability in EDM of WC–Co composites. This machining
instability was mainly due to open circuit, short circuit and arcing pulses. Increase in pulse duration results into
more melting and recasting of material, which causes arcing and rougher surface.
The grain size of WC and cobalt composition also shows noticeable influence on machining performance of
WC-Co composite with WEDM (Kim and Kruth, 2001; Lauwers et al., 2006). Varying the cobalt concentration
and grain size of WC, alter the thermal conductivity of the material which affects the machining performance.
Chen et al. (2010) utilised Taguchi method, back propagation neural network and genetic algorithm to optimize
the WEDM parameters in machining of pure tungsten. Pulse-on time was most significant parameters which
influence the cutting speed and surface roughness both. Jangra et al. (2012) optimized the multi machining
characteristics in WEDM of WC-5.3% Co composite using an integrated approach of Taguchi, GRA and
entropy method. Six input parameters namely taper angle, discharge current, pulse-on time, pulse-off time, wire
tension and dielectric flow rate were investigated for four output machining characteristics namely MRR, SR,
RoC and angular error.
Although, WEDM can easily machine complex profiles in WC-Co composite but damaged work surface
consisting of recast layer, large micro-cracks etc, is a major concern in WEDM (Caydas, 2009, Jangra, K.,
Figure 1.Representation of WEDM process.
pulse interval and flushing on the machining characteris-tics, such as material removal rate (MRR), surface finish and relative tool wear in EDM of tungsten carbide. Lee and Li (2003) elucidated the effect of discharge energy on in-tegrity of EDMed surface of tungsten carbide. It was found that the surface roughness is a function of two main param-eters: peak current and pulse duration. At high peak current and/or long pulse duration, rough surface and abundance of micro-cracks were observed. Mahdavinejad and Mahdavine-jad (2005) studied the instability in EDM of WC-Co com-posites. This machining instability was mainly due to open circuit, short circuit and arcing pulses. Increase in pulse dura-tion results in more melting and recasting of material, which causes arcing and rougher surface.
The grain size of WC and cobalt composition also shows noticeable influence on machining performance of WC-Co composite with WEDM (Kim and Kruth, 2001; Lauwers et al., 2006). Varying the cobalt concentration and grain size of WC alters the thermal conductivity of the material, which af-fects the machining performance. Chen et al. (2010) utilised Taguchi method, back propagation neural network and ge-netic algorithm to optimize the WEDM parameters in ma-chining of pure tungsten. Pulse-on time was the most sig-nificant parameter that influences both the cutting speed and surface roughness. Jangra et al. (2012) optimized the multi-machining characteristics in WEDM of WC-5.3 % Co com-posite using an integrated approach of Taguchi, GRA and en-tropy method. Six input parameters – taper angle, discharge current, pulse-on time, pulse-off time, wire tension and di-electric flow rate – were investigated for four output machin-ing characteristics: MRR, SR, RoC and angular error.
Although WEDM can easily machine complex profiles in WC-Co composite but damaged work surface consisting
of recast layer, large micro-cracks are a major concern in WEDM (C¸ aydas¸ et al., 2009; Jangra, 2012). In order to ob-tain fine surface finish and low surface defects, low discharge parameters with high dielectric flushing rate are required. but they lower the cutting rate in WEDM. This implies that high cutting rate with low surface roughness and minimum sur-face defects is difficult to obtain in a single setting of pro-cess parameters. In order to achieve an efficient machining of WC-Co composite into desired shape, inter-relationship (mathematical modelling) between input WEDM parameters and output performance characteristics should be available to the manufacturers, so that a trade-offcan be made among various performance characteristics.
Two kinds of approaches, theoretical and empirical, have been commonly used in modelling of WEDM process (Patil and Brahmankar, 2010). Owing to the simplified and un-avoidable assumptions, the theoretical models yield large er-rors between predicted and experimental results. On the other hand empirical models are limited to specific experimen-tal conditions. Response surface methodology (RSM) is the most used statistical technique for determining the relation-ship between various input parameters and output responses (Myers and Montgomery, 1995; Hewidy et al., 2005; Kansal et al., 2005). RSM is a collection of mathematical and exper-imental techniques that requires sufficient number of exper-imental data to analyse the problem and to develop mathe-matical models for several variables and output performance characteristics.
Because the WEDM involves multi-performance charac-teristics, the objective of the present study is to investi-gate the influence of process parameters and to develop the mathematical models for three performance characteristics namely cutting speed (CS), surface roughness (SR) and ra-dial overcut (RoC) in WEDM of WC-5.3 % Co composite. Response surface methodology with face-centered central composite design has been utilised to conduct the experimen-tation which helps to investigate and to correlate the input parameters with output performance characteristics. Using these mathematical models, optimal combination of WEDM parameters can be selected for desired performance charac-teristics for WC-Co composite.
2 Experimental procedure
2.1 Work material and machining parameters
Tungsten carbide composite with low cobalt concentration (5.3 %) has been taken as a work material in the form of a rectangular block of thickness of 13 mm. The density and hardness of WC-5.3 % Co composite were measured as 14.95 g cm−3and 77 HRC, respectively.
Experiments were performed on 5-axis sprint cut (epulse-40) WEDM, most widely used in Indian industries, man-ufactured by Electronica Machine Tools Ltd., India. In present machine tool, range of the important parameters is as
K. Jangra and S. Grover: Modelling and experimental investigation of process parameters in WEDM 65
Table 1.Process parameters and their levels.
Symbol Parameters Levels
(−1) (0) (+1)
A Pulse-on Time (Ton) 108 115 122
B Pulse-offTime (Toff) 30 40 50
C Servo Voltage (SV) 20 30 40
D Wire Feed Rate (WF) 4 6 8
follows: discharge current, 10–230 amp; pulse-on time, 101– 131µs; pulse-off time, 10–63µs; servo voltage 0–90 V; di-electric flow rate, 0–12 litre per minute (l min−1); wire feed,
1–15 m min−1; wire tension, 1–15 N.
In present investigation, four important WEDM parame-ters, namely pulse-on time (Ton), pulse-offtime (Toff), servo
voltage (SV) and wire feed (WF) have been considered with three levels each (Table 1). Discharge current is kept at opti-mum value of 90 amp which is taken on the basis of earlier investigations (Jangra et al., 2011, 2012). Similarly, other pa-rameters were kept constant at their optimal values. As the workpiece thickness is low (13 mm), wire tension was kept fixed at 10 N. Zinc-coated brass wire of diameter 0.25 mm was used as an electrode because of its good capability to sustain high discharge energy. High flow rate results in quick and complete flushing of melted debris out of the spark gap. Therefore, dielectric flow rate is kept at maximum value of 12 l min−1. Vertical cutting was performed at zero wire offset.
2.2 Performance characteristics
CS was measured as surface area removed per minute (mm2min−1). It was obtained by multiplying the workpiece
thickness (13 mm) with linear cutting speed (mm min−1)
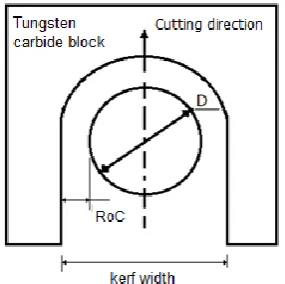
dis-playing on machine tool monitor screen. Surface roughness is a good indicator of the surface quality which can be eas-ily measured by a tool manufacturer. In present work, SR value (inµm) was measured in terms of mean absolute devia-tion (Ra) using the digital surface tester Mitutoyo 201P. RoC (inµm) is the gap between machined work surface and wire periphery (as shown in Fig. 2). “D” represents the wire di-ameter. RoC helps to predict accurate wire offset for precise dimensional tolerance. Neglecting the wire lag compensation for straight cutting, wire offset is given by the sum of wire ra-dius and RoC (Sarkar et al., 2008). RoC was measured using optimal microscope.
2.3 Experimental design using RSM
For developing an adequate relationship between input WEDM parameters and output performance characteristics, response surface methodology (RSM) (Myers and Mont-gomery, 1995) has been employed. By using the design of experiments and applying regression analysis, the modelling of the desired response (Y) to several independent input
vari-TS5 (Figure 2 with better Quality)
Figure 2.Representation of RoC in WEDM.
ables (xi) can be gained. In the RSM, the quantitative form of relationship between desired response and independent input variables could be represented as
Y= Φ(x1,x2, ...,xk)±er. (1)
The function Φ is called response surface or response function. The residual er measures the experimental errors
(Cochran and Cox, 1962).
In applying the RSM, the dependent variable is viewed as a surface to which a mathematical model is fitted. For the de-velopment of regression equations related to various perfor-mance characteristics of WEDM process, the second-order response surface has been assumed as
Y=b0+
k
X
i=1
biXi+ k
X
i=1
biiXi2+
2
X
i<j=2
bi jXiXj±er. (2)
This assumed surface Y contains linear, squared and cross product terms of variables Xi. The model parameters can be estimated most effectively if proper experimental designs are used to collect the data. In present case, a standard second-order experimental design called face-centered central com-posite design (CCD) has been adopted for analysing and modelling four input parameters. This design consists of fac-torial portion with all parameters at three levels, eight star points and six central points. The star points are at the face of the cube portion on the design which corresponds toα-value of 1, the distance from design centre. The centre points, as implied by the name, are points with all levels set to coded level 0, the midpoint of each parameter range. Table 2 shows the experimental conditions.
3 Results and discussion
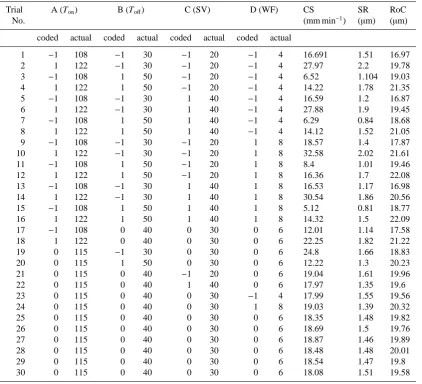
The 30 experiments were conducted and CS, SR and RoC were obtained for each experimental run (as listed in Ta-ble 2).
66 K. Jangra and S. Grover: Modelling and experimental investigation of process parameters in WEDM
Table 2.Test conditions in face-centered central composite design.
Trial A (Ton) B (Toff) C (SV) D (WF) CS SR RoC
No. (mm min−1) (µm) (µm)
coded actual coded actual coded actual coded actual
1 −1 108 −1 30 −1 20 −1 4 16.691 1.51 16.97
2 1 122 −1 30 −1 20 −1 4 27.97 2.2 19.78
3 −1 108 1 50 −1 20 −1 4 6.52 1.104 19.03
4 1 122 1 50 −1 20 −1 4 14.22 1.78 21.35
5 −1 108 −1 30 1 40 −1 4 16.59 1.2 16.87
6 1 122 −1 30 1 40 −1 4 27.88 1.9 19.45
7 −1 108 1 50 1 40 −1 4 6.29 0.84 18.68
8 1 122 1 50 1 40 −1 4 14.12 1.52 21.05
9 −1 108 −1 30 −1 20 1 8 18.57 1.4 17.87
10 1 122 −1 30 −1 20 1 8 32.58 2.02 21.61
11 −1 108 1 50 −1 20 1 8 8.4 1.01 19.46
12 1 122 1 50 −1 20 1 8 16.36 1.7 22.08
13 −1 108 −1 30 1 40 1 8 16.53 1.17 16.98
14 1 122 −1 30 1 40 1 8 30.54 1.86 20.56
15 −1 108 1 50 1 40 1 8 5.12 0.81 18.77
16 1 122 1 50 1 40 1 8 14.32 1.5 22.09
17 −1 108 0 40 0 30 0 6 12.01 1.14 17.58
18 1 122 0 40 0 30 0 6 22.25 1.82 21.22
19 0 115 −1 30 0 30 0 6 24.8 1.66 18.83
20 0 115 1 50 0 30 0 6 12.22 1.3 20.23
21 0 115 0 40 −1 20 0 6 19.04 1.61 19.96
22 0 115 0 40 1 40 0 6 17.97 1.35 19.6
23 0 115 0 40 0 30 −1 4 17.99 1.55 19.56
24 0 115 0 40 0 30 1 8 19.03 1.39 20.32
25 0 115 0 40 0 30 0 6 18.35 1.48 19.82
26 0 115 0 40 0 30 0 6 18.69 1.5 19.76
27 0 115 0 40 0 30 0 6 18.87 1.46 19.89
28 0 115 0 40 0 30 0 6 18.48 1.48 20.01
29 0 115 0 40 0 30 0 6 18.54 1.47 19.8
30 0 115 0 40 0 30 0 6 18.08 1.51 19.58
3.1 Mathematical model for CS, SR and RoC
Using the experimental data, regression equations have been developed for correlating the output performance character-istics and input WEDM parameters. Analysis of variance (ANOVA) has been applied on the experimental data to select the adequate model. Design expert (DX8), a statistical tool, has been utilised to analyse the experimental data. Quadratic vs. two-factor interaction (2FI) models have been suggested for CS and RoC, while two-factor interaction (2FI) has been proposed for SR. Table 3 shows the fit summary for proposed models.
In Table 3, a p-value for the model terms that are less than 0.05 (i.e.α=0.05, or 95 % confidence level) indicates that the obtained models are considered to be statistically signif-icant (Kanagarajan et al., 2008). It shows that the terms in the model have significant effect on responses. From Table 3, coefficient of determination (R2) and R2 (adj.) for all three
responses are closer to unity, which is desirable for the
re-sponse model to fit the actual data. The lack of fit is a mea-sure of the failure of the model to predict the data in the up-per and lower limits of the parameters. The “lack of fit” for all three characteristics is insignificant because of high prob-ability value (F-value), which is desirable for selecting the models. Figures 3 to 5 show that the residuals are normally distributed about a straight line and there is no problem with the observed results. Consequently, the proposed models for three responses can be considered as significant for fitting and predicting the experimental results within the specified experimental domain.
K. Jangra and S. Grover: Modelling and experimental investigation of process parameters in WEDM 67
Table 3.The ANOVA table for fitted models.
Source Sum of Degree of Mean F-value p-value
Squares freedom Square
(a) For CS
Model 1277.4 14 91.24 771.23 <0.0001 Significant
Residual 1.774 15 0.118
Lack of fit 1.401 10 0.140 1.873 0.2532 Not significant
Pure error 0.374 5 0.074
Cor. total 1279.17 29
Standard deviation=0.34396; R2=0.9986; R2(Adj.)=0.9973
(b) For SR
Model 3.0092 10 0.3009 680.53 <0.0001 Significant
Residual 0.0084 19 0.0004
Lack of fit 0.0066 14 0.00047 1.374 0.3859 Not significant
Pure error 0.0017 5 0.00034
Cor. Total 3.0175 29
Standard deviation=0.02229; R2=0.9972; R2(Adj.)=0.9957
(c) For RoC
Model 56.653 14 4.0466 89.536 <0.0001 Significant
Residual 0.678 15 0.0452
Lack of fit 0.576 10 0.0576 2.823 0.1318 Not significant
Pure error 0.102 5 0.0204
Cor. Total 57.33 29
Standard deviation=0.2126; R2=0.9881; R2(Adj.)=0.9771
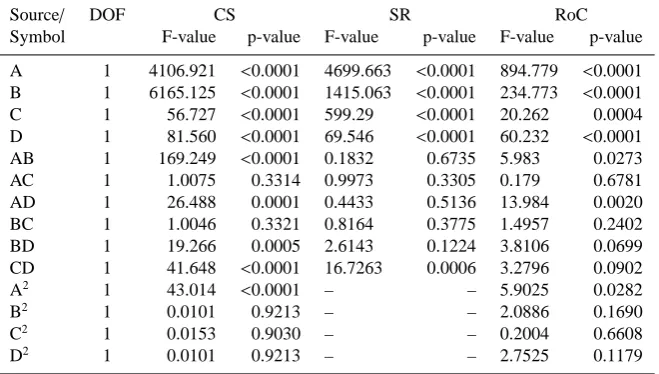
Table 4.F-value and p-value for each model term for CS, SR and RoC.
Source/ DOF CS SR RoC
Symbol F-value p-value F-value p-value F-value p-value
A 1 4106.921 <0.0001 4699.663 <0.0001 894.779 <0.0001
B 1 6165.125 <0.0001 1415.063 <0.0001 234.773 <0.0001
C 1 56.727 <0.0001 599.29 <0.0001 20.262 0.0004
D 1 81.560 <0.0001 69.546 <0.0001 60.232 <0.0001
AB 1 169.249 <0.0001 0.1832 0.6735 5.983 0.0273
AC 1 1.0075 0.3314 0.9973 0.3305 0.179 0.6781
AD 1 26.488 0.0001 0.4433 0.5136 13.984 0.0020
BC 1 1.0046 0.3321 0.8164 0.3775 1.4957 0.2402
BD 1 19.266 0.0005 2.6143 0.1224 3.8106 0.0699
CD 1 41.648 <0.0001 16.7263 0.0006 3.2796 0.0902
A2 1 43.014 <0.0001 – – 5.9025 0.0282
B2 1 0.0101 0.9213 – – 2.0886 0.1690
C2 1 0.0153 0.9030 – – 0.2004 0.6608
D2 1 0.0101 0.9213 – – 2.7525 0.1179
68 K. Jangra and S. Grover: Modelling and experimental investigation of process parameters in WEDM about a straight line and there is no problem with the observed results. Consequently, the proposed models for
three responses can be considered as significant for fitting and predicting the experimental results within the
specified experimental domain.
Figure 3 Residuals plot for CS
Figure 4 Residuals plot for SR
Figure 5 Residuals plot for RoC Design-Expert® Software
MRR Color points by value of MRR:
32.58
5.12
Internally Studentized Residuals
N o r m a l % P r o b a b il it y
Normal Plot of Residuals
-3.00 -2.00 -1.00 0.00 1.00 2.00 3.00 1 5 10 20 30 50 70 80 90 95 99 Design-Expert® Software SR
Color points by value of SR:
2.2
0.81
Internally Studentized Residuals
N o r m a l % P r o b a b il it y
Normal Plot of Residuals
-3.00 -2.00 -1.00 0.00 1.00 2.00 1 5 10 20 30 50 70 80 90 95 99 Design-Expert® Software RoC
Color points by value of RoC:
22.09
16.87
Internally Studentized Residuals
N o r m a l % P r o b a b il it y
Normal Plot of Residuals
-3.00 -2.00 -1.00 0.00 1.00 2.00 1 5 10 20 30 50 70 80 90 95 99
Figure 3.Residuals plot for CS.
about a straight line and there is no problem with the observed results. Consequently, the proposed models for
three responses can be considered as significant for fitting and predicting the experimental results within the
specified experimental domain.
Figure 3 Residuals plot for CS
Figure 4 Residuals plot for SR
Figure 5 Residuals plot for RoC Design-Expert® Software
MRR Color points by value of MRR:
32.58
5.12
Internally Studentized Residuals
N o r m a l % P r o b a b il it y
Normal Plot of Residuals
-3.00 -2.00 -1.00 0.00 1.00 2.00 3.00 1 5 10 20 30 50 70 80 90 95 99 Design-Expert® Software SR
Color points by value of SR:
2.2
0.81
Internally Studentized Residuals
N o r m a l % P r o b a b il it y
Normal Plot of Residuals
-3.00 -2.00 -1.00 0.00 1.00 2.00 1 5 10 20 30 50 70 80 90 95 99 Design-Expert® Software RoC
Color points by value of RoC:
22.09
16.87
Internally Studentized Residuals
N o r m a l % P r o b a b il it y
Normal Plot of Residuals
-3.00 -2.00 -1.00 0.00 1.00 2.00 1 5 10 20 30 50 70 80 90 95 99
Figure 4.Residuals plot for SR.
Using backward elimination method, non-significant terms were eliminated. Final regression equations for perfor-mance characteristics have been obtained as follows.
3.1.1 Cutting speed (CS)
Regression equation is in terms of coded parameters:
CS=18.51+5.20A−6.37B−0.61C+0.73D
−1.12AB+0.44AD−0.38BD−0.55CD−1.45A2 (3)
Regression equation is in terms of actual parameters:
CS=−494.76+8.0055A+1.314B+0.1054C−1.682D
−0.01598AB+0.031612AD−0.01887BD
−0.02774CD−0.0296A2 (4)
about a straight line and there is no problem with the observed results. Consequently, the proposed models for three responses can be considered as significant for fitting and predicting the experimental results within the specified experimental domain.
Figure 3 Residuals plot for CS
Figure 4 Residuals plot for SR
Figure 5 Residuals plot for RoC Design-Expert® Software
MRR Color points by value of MRR:
32.58
5.12
Internally Studentized Residuals
N o r m a l % P r o b a b il it y
Normal Plot of Residuals
-3.00 -2.00 -1.00 0.00 1.00 2.00 3.00 1 5 10 20 30 50 70 80 90 95 99 Design-Expert® Software SR
Color points by value of SR:
2.2
0.81
Internally Studentized Residuals
N o r m a l % P r o b a b il it y
Normal Plot of Residuals
-3.00 -2.00 -1.00 0.00 1.00 2.00
1 5 10 20 30 50 70 80 90 95 99 Design-Expert® Software RoC
Color points by value of RoC:
22.09
16.87
Internally Studentized Residuals
N o r m a l % P r o b a b il it y
Normal Plot of Residuals
-3.00 -2.00 -1.00 0.00 1.00 2.00
1 5 10 20 30 50 70 80 90 95 99
Figure 5.Residuals plot for RoC.
3.1.2 Surface roughness (SR)
Regression equation is in terms of coded parameters:
SR=1.47+0.34A−0.19B−0.12C−0.041D+0.022CD (5) Regression equation is in terms of actual parameters:
SR=−2.679+0.04854A−0.01864B−0.01858C
−0.05292D+0.001075CD (6)
3.1.3 Radial overcut (RoC)
Regression equation is in terms of coded parameters:
RoC=19.7654+1.49889A+0.76778B−0.22556C
+0.38889D−0.13AB+0.19875AD−0.32088A2 (7)
Regression equation is in terms of actual parameters:
RoC=−94.5438+1.69975A+0.454676B−0.09212C
−1.74364D−0.00186AB−0.00519AD−0.00655A2 (8)
These predicted models were verified by conducting confir-mation tests within the selected range of the WEDM param-eters.
3.2 Effect of WEDM parameters on performance characteristics
Response surface graphs (Figs. 6 to 8) have been plotted to analyse the influence of WEDM parameters on performance characteristics, namely CS, SR and RoC. Surface plots have been plotted for combined effect of two factors while keeping other two factors at their mid-values.
K. Jangra and S. Grover: Modelling and experimental investigation of process parameters in WEDM 69
Figure 6a.Combined effect of Tonand Toffon CS.
Figure 6b.Combined effect of SV and WF on CS.
SV. In WEDM, cutting speed depends on the melting of work surface and then flushing of the eroded material out of the spark zone. Melting of work surface depends on the ther-mal conductivity of work material and energy consumed per spark which is supposed to be the function of discharge cur-rent (Ip), pulse duration (Ton) and discharge voltage (SV)
(Luo, 1995). Increasing pulse duration (Ton) increases the
heat generation at the work surface which increases the cut-ting speed. Decreasing servo voltage closes the spark gap which results in rapid and large ionization of dielectric fluid which gives rise to more melting of work material and hence increases the cutting speed.
The rise in cutting speed can be highly noticed at high value of wire feed. High discharge energy results in more melting and evaporation of the work material causing liber-ation of large number of carbide debrises which coagulates in the spark gap and hence affects the machining process by producing arcs. Increasing wire feed rate leads to the easy and rapid escape of the eroded material out of the spark gap
Figure 6c.Combined effects of Tonand WF on CS.
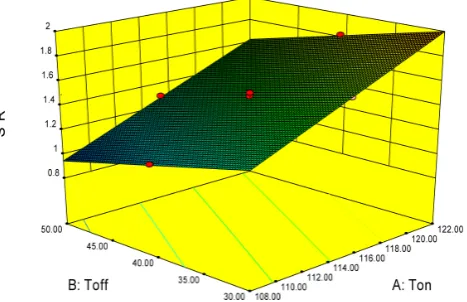
Figure 7a.Combined effects of Tonand Toffon SR.
and hence increases the cutting speed. This can be observed from the combined effect of WF with SV and Ton as shown
in Fig. 6b–c.
Increasing pulse-off time (Toff) value decreases the
dis-charge frequency and increases the overall machining time. Also long pulse-offtime at high dielectric flow rate produces the cooling effect on work material and hence decreases the CS. The interaction among WEDM parameters (Tonand Toff;
SV and WF) can be observed from curvature of the contour plots on response surface graphs. The low F-value (<0.05) for these interactions effect shows a significant influence on performance characteristics as shown in Table 4.
3.2.2 Effect of WEDM parameters on surface roughness Surface roughness increases with increasing pulse-on time (Ton) and decreasing servo voltage (SV) as shown in Fig. 7a–
b. In WEDM, SR is mainly described by the shape and size of the surface craters which mainly depends on the discharge energy and re-deposition of melted material on work surface.
70 K. Jangra and S. Grover: Modelling and experimental investigation of process parameters in WEDM
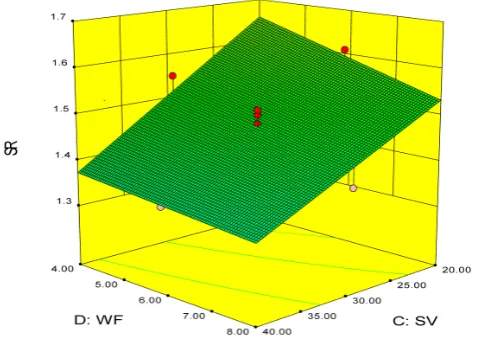
Figure 7b.Combined effects of Tonand SV on SR.
Figure 7c.Combined effects of SV and WF on SR.
Increasing pulse-on time and decreasing servo voltage in-creases the discharge energy across the electrodes which re-sults in deeper erosion crater on the work surface and hence increases the surface roughness (Lee and Li, 2003).
Due to the large difference between melting temperatures for WC and Co, discharge energy tends to melt, evaporate and remove cobalt even before the melting of WC. As a re-sult WC grains may release without melting or in semi-solid state which coagulate in the spark gap (Saha et al., 2008). At high discharge energy, the probability of re-deposition of melted material of work surface is high. Increasing Toff-value
increases the time between two consecutive sparks which re-sults in complete flushing of the carbide debris out of the spark gap, and hence low re-deposition of eroded material results in low surface roughness as shown by the combined effect of Tonand Toffin Fig. 7a.
Surface roughness shows mild tendency to decrease with increasing wire feed rate (WF) as shown in Fig. 7c. Increas-ing wire feed results in easy escape of carbide debris out of the spark gap which results in low re-deposition of melted
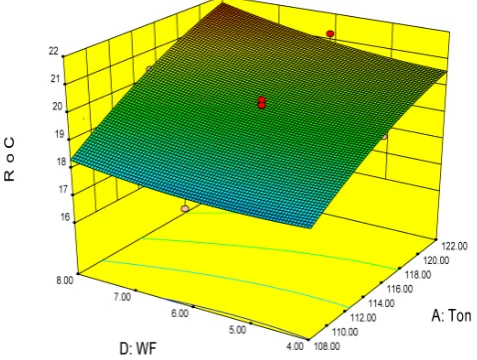
Figure 8a.Combined effects of Tonand Toffon RoC.
residuals and hence low surface roughness. Curved contour on response graphs between WF and SV shows some inter-action between these parameters. To get good surface fin-ish, it is desirable to keep the electrical discharging energy at smaller level, by setting low Tonand high Toff-value.
3.2.3 Effect of WEDM parameters on radial overcut RoC is the thickness of material removed perpendicular to the cutting direction as shown in Fig. 2. RoC helps to achieve accurate wire offset for rough cutting operation for obtaining precise dimensional tolerance. RoC depends on the amount of material melted and flushing it out of the spark gap. In-creasing pulse-on time (Ton) results in high discharge
en-ergy which causes more melting and erosion of work sur-face which increases the RoC. At high value of pulse-offtime (Toff), eroded carbide debris is easily flushed away from the
spark gap. Therefore, RoC increases with increase in Tonand
Toff as shown by surface plots in Fig. 8a, c and d. At low
value of Toff, tendency of recasting of residue material on the
work surface is high, which decreases the RoC.
Increasing wire feed rate helps to clear offthe spark gap quickly which results in low re-deposition of eroded material and hence increases the RoC as shown in Fig. 8b. Decreasing servo voltage (SV) results in more ionization of the spark gap which results in more melting of work material and hence increases the RoC. Curved contours on response graph show the interaction between WEDM parameters. Using response surface graphs, values of WEDM parameters can be selected for the desired value of performance characteristics.
4 Conclusions
K. Jangra and S. Grover: Modelling and experimental investigation of process parameters in WEDM 71
Figure 8b.Combined effects of SV and WF on RoC.
Figure 8c.Combined effects of Tonand WF on RoC.
influence of four important WEDM parameters – pulse-on time (Ton), pulse-off time (Toff), servo voltage (SV) and
wire feed (WF) – on three performance characteristics: cut-ting speed (CS), surface roughness (SR) and radial over-cut (RoC). Face centered central composite design was em-ployed to conduct the experiments and to develop a correla-tion between the WEDM parameters and each performance characteristics. Analysis of variance (ANOVA) on experi-mental data shows that quadratic vs. two-factor interaction (2FI) model as the best fit for CS and RoC, while two-factor interaction (2FI) has been proposed for SR.
Response surface graphs were used to describe the influence of WEDM parameters on each performance characteristic. Ton, Toff, SV and WF produce significant
influence on each performance characteristic. In case of cutting speed, interaction between Tonand Toff; Tonand WF;
Toff and WF; SV and WF produces significant effect, while,
in SR, interaction effect of SV and WF has been found significant. In case of RoC, interaction among Ton and Toff;
Figure 8d.Combined effects of WF and Toffon RoC.
Tonand WF produces significant effect. Using mathematical
models, optimal parameters can be determined easily for desired performance characteristics. Hence a trade-off can be made among various performance characteristics.
Edited by: B. Azarhoushang
Reviewed by: two anonymous referees
References
C¸ aydas¸, U., Hasc¸alik, A., and Ekici, S.: An adaptive neuro-fuzzy
inference system (ANFIS) model for wire-EDM, Expert Syst. Appl., 36, 6135–6139, 2009.
Chen, H.-C., Lin, J.-C., Yang, Y.-K., and Tsai, C.-H.: Optimization of wire electrical discharge machining for pure tungsten using a neural network integrated simulating annealing approach, Expert Syst. Appl., 37, 7147–7153, 2010.
Cochran, G. and Cox, G. M.: Experimental design, Asia Publishing House, New Delhi, 1962.
Engqvist, H., Ederyd, S., and Axen, N.: Grooving wear of single-crystal tungsten carbide, Wear, 230, 165–174, 1999.
Hewidy, M. S., El-Taweel, T. A., and El-Safty, M. F.: Modeling the machining parameters of wire electrical discharge machining of Inconel 601 using RSM, J. Mater. Process. Tech., 169, 328–336, 2005.
Jangra, K.: Study of unmachined area in intricate machining after rough cut in WEDM, Int. J. Indust. Eng. Comput., 3, 887–892, 2012.
Jangra, K., Jain, A., and Grover, S.: Optimization of multiple-machining characteristics in wire electrical discharge multiple-machining of punching die using grey relational analysis, J. Sci. Ind. Res., 69, 606–612, 2010.
Jangra, K., Grover, S., Chan, F. T. S., and Aggarwal, A.: Digraph and matrix method to evaluate the machinability of tungsten car-bide composite with wire EDM, Int. J. Adv. Manuf. Tech., 56, 959–974, 2011.
Jangra, K., Grover, S., and Aggarwal, A.: Optimization of multi machining characteristics in WEDM of WC-5.3 % Co composite
72 K. Jangra and S. Grover: Modelling and experimental investigation of process parameters in WEDM
using integrated approach of Taguchi, GRA and Entropy method, Frontiers of Mechanical Engineering, 7, 288–299, 2012. Jia, K. and Fischer, T. E.: Sliding wear of conventional and
nanos-tructured cemented carbides, Wear, 203–204, 310–318, 1997. Kanagarajan, D., Karthikeyan, R., Palanikumar, K., Paulo, and
Davim, J.: Optimization of electrical discharge machining
char-acteristics of WC/Co composites uing non-dominated sorting
ge-netic algorithm (NSGA-II), Int. J. Adv. Manuf. Tech., 36, 1124– 1132, 2008.
Kansal, H. K., Singh, S., and Kumar, P.: Parametric optimization of powder mixed electrical discharge machining by response sur-face methodology, J. Mater. Process. Tech., 169, 427–436, 2005. Kim, C. H. and Kruth, J. P.: Influence of electrical conductivity of dielectrical fluid on WEDM of sintered carbide, KSME Int. J., 15, 1276–1282, 2001.
Lauwers, B., Liu, W., and Eeraerts, W.: Influence of the composi-tion of WC-based cermets on manufacturability by wire-EDM, J. Mater. Process. Tech., 8, 83–89, 2006.
Lee, S. H. and Li, X. P.: Study of the effect of machining parameters
on the machining characteristics in electrical discharge machin-ing of tungsten carbide, J. Mater. Process. Tech., 115, 344–358, 2001.
Lee, S. H. and Li, X. P.: Study of the surface integrity of the ma-chined workpiece in the EDM of tungsten carbide, J. Mater. Pro-cess. Tech., 139, 315–321, 2003.
Liu, K. and Li, X. P.: Ductile cutting of tungsten carbide, J. Mater. Process. Tech., 113, 348–354, 2001.
Liu, K., Li, X. P., and Rahman, M.: Characteristics of high speed micro cutting of tungsten carbide, J. Mater. Process. Tech., 140, 352–357, 2003.
Luo, Y. F.: An energy-distribution strategy in fast cutting wire EDM, J. Mater. Process. Tech., 55, 380–390, 1995.
Mahdavinejad, R. A. and Mahdavinejad, A.: ED machining of WC-Co, J. Mater. Process. Tech., 162–163, 637–643, 2005.
Myers, R. H. and Montgomery, D. C.: Response Surface Methodol-ogy, New York, Wiley, 11, 535–561 and 12, 570–615, 1995. Patil, N. G. and Brahmankar, P. K.: Determination of material
re-moval rate in wire electro-discharge machining of metla ma-trix composites using dimensional analysis, Int. J. Adv. Manuf. Tech., 51, 599–610, 2010.
Saha, P., Singha, A., and Pal, S. K.: Soft computing models based prediction of cutting speed and surface roughness in wire electro-discharge machining of tungsten carbide cobalt composite, Int. J. Adv. Manuf. Tech., 39, 74–84, 2008.
Sarkar, S., Sekh, M., Mitra, S., and Bhattacharyya, B.: Modelling
and optimization of wire electrical discharge machining of γ